Biofertilizers Market Analysis, Size, and Forecast 2024-2028: North America (US and Canada), Europe (France, Germany, Italy, and UK), Middle East and Africa (Egypt, KSA, Oman, and UAE), APAC (China, India, and Japan), South America (Argentina and Brazil), and Rest of World (ROW)

Biofertilizers Market Analysis, Size, and Forecast 2024-2028:
North America (US and Canada), Europe (France, Germany, Italy, and UK), Middle East and Africa (Egypt, KSA, Oman, and UAE), APAC (China, India, and Japan), South America (Argentina and Brazil), and Rest of World (ROW)

Published: Jul 2024 169 Pages SKU: IRTNTR70678

Market Overview at a Glance

$2.27 B
Market Opportunity
13.64%
CAGR
11.72
YoY growth 2023-2024(%)

Biofertilizers Market Size 2024-2028

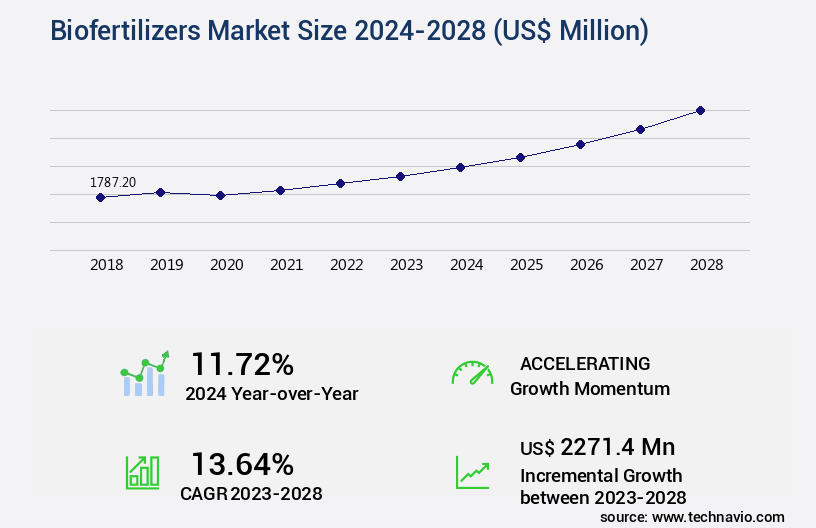
The biofertilizers market size is valued to increase by USD 2.27 billion, at a CAGR of 13.64% from 2023 to 2028. Increase in demand for biofertilizers from developing countries will drive the biofertilizers market.

Market Insights

  • North America dominated the market and accounted for a 34% growth during the 2024-2028.
  • By Application - Seed treatment segment was valued at USD 1.27 billion in 2022
  • By Product - Nitrogen-fixing biofertilizers segment accounted for the largest market revenue share in 2022

Market Size & Forecast

  • Market Opportunities: USD 169.11 million 
  • Market Future Opportunities 2023: USD 2271.40 million
  • CAGR from 2023 to 2028 : 13.64%

Market Summary

  • The market is experiencing significant growth due to increasing demand from developing countries where agriculture plays a pivotal role in their economy. This trend is driven by the growing adoption of organic farming practices, which prioritize the use of natural fertilizers over synthetic ones. One key factor fueling this shift is health concerns regarding the use of nitrogenous fertilizers, which can lead to soil degradation and contamination of water sources. Biofertilizers, derived from natural sources such as bacteria, fungi, and algae, offer a sustainable alternative to chemical fertilizers. They not only enhance soil fertility but also improve its structure and water-holding capacity.
  • In addition, they contribute to reducing greenhouse gas emissions, making them an environmentally-friendly solution. A real-world business scenario illustrating the importance of biofertilizers can be seen in the context of supply chain optimization. A large agricultural conglomerate, aiming to expand its organic produce line, recognizes the potential of biofertilizers to increase crop yield and quality. By partnering with local biofertilizer producers, the conglomerate can secure a steady supply, ensuring operational efficiency and meeting consumer demand for organic produce. This strategic move not only benefits the environment but also strengthens the company's reputation as a responsible and sustainable business.

What will be the size of the Biofertilizers Market during the forecast period?

Biofertilizers Market Size

Get Key Insights on Market Forecast (PDF) Request Free Sample

  • Biofertilizers have emerged as a critical component of sustainable intensification in modern agriculture, offering numerous benefits for crop quality, water use efficiency, and environmental sustainability. These organic fertilizers, derived from various sources such as plant residues, animal manure, and microbial fermentation, promote soil enzyme activity, nutrient cycling, and plant-microbe interactions. One significant trend in the biofertilizer market is the focus on enhancing nutrient availability and improving crop management through the application of microbial communities. For instance, the use of biofertilizers in vegetable production has led to increased fruit yield and drought tolerance, enabling farmers to maintain agricultural practices during water scarcity.
  • Moreover, the implementation of biofertilizers in grain production has resulted in improved salinity tolerance, contributing to economic viability and agricultural sustainability. Soil microbiology plays a pivotal role in the carbon sequestration process, which is essential for mitigating climate change. Biofertilizers contribute to this process by promoting the growth of microbial communities that facilitate the conversion of atmospheric carbon dioxide into organic matter. Additionally, biofertilizers aid in root exudates production, fostering symbiotic relationships and stimulating plant growth. Incorporating biofertilizers into agricultural practices not only enhances crop quality but also offers environmental benefits. By reducing the reliance on synthetic fertilizers, farmers can minimize the environmental impact of agricultural operations and contribute to a more sustainable future.
  • As the demand for sustainable agricultural practices continues to grow, the biofertilizer market is poised for significant expansion.

Unpacking the Biofertilizers Market Landscape

Biofertilizers, a vital component of organic farming, enhance soil fertility through the natural process of nitrogen fixation and phosphorus solubilization. Compared to conventional fertilizers, biofertilizers offer a more sustainable approach, reducing the need for synthetic inputs by up to 30%. Moreover, the application of biofertilizers can improve crop productivity by 10-20%, as shown in numerous agricultural studies. Biofertilizers play a crucial role in growth promotion by increasing nitrogenase activity and potassium mobilization. They also contribute to soil amendment by improving soil structure, rhizosphere competence, and microbial diversity. Furthermore, biofertilizers offer pest resistance and disease suppression through the production of siderophores, phytohormones, and biocontrol agents. Biofertilizers are essential for sustainable agriculture, as they promote root colonization by mycorrhizal fungi and enhance nutrient uptake through humic acid and enzyme production. By improving soil health and optimizing nutrient availability, biofertilizers contribute to yield improvement and precision farming practices. In summary, biofertilizers offer a cost-effective and environmentally friendly solution for enhancing soil fertility and promoting crop growth.

Key Market Drivers Fueling Growth

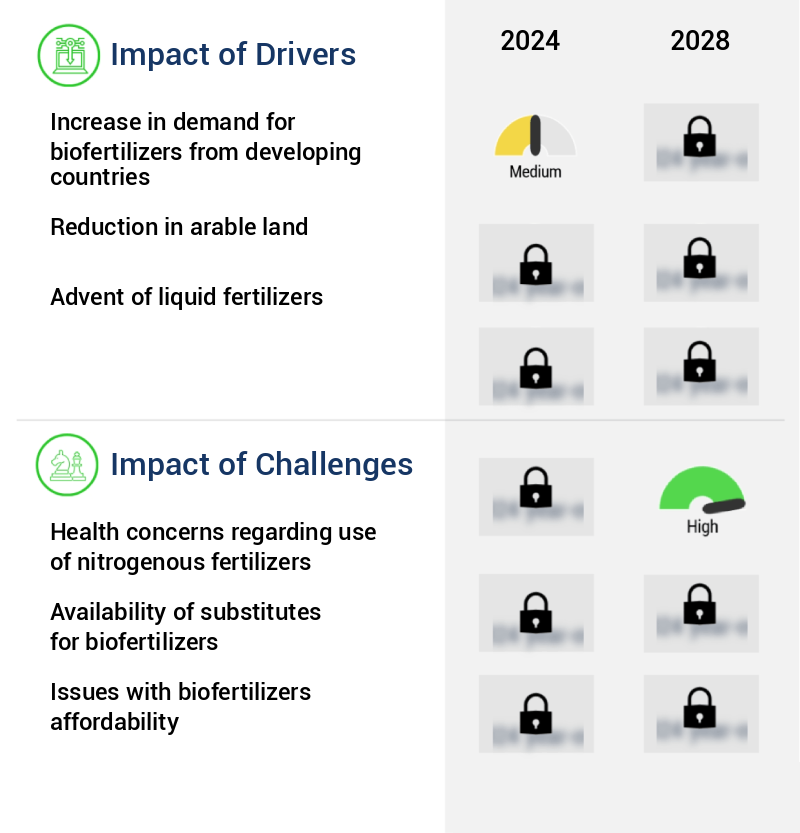
Developing countries' rising demand for biofertilizers serves as the primary market driver.

  • The market is experiencing significant growth due to the increasing demand from key agricultural sectors in China, India, Brazil, Indonesia, and Pakistan. This expansion is driven by the growing agricultural sector in these countries to meet escalating food requirements. Biofertilizers offer several advantages, including ease of application and superior performance, making them a preferred choice for farmers. The adoption of technology-driven irrigation systems, such as micro drip irrigation, is also fueling the demand for biofertilizers. With APAC being a major consumer of fertilizers globally, the increasing population and rising per capita income contribute to the market's growth.
  • According to estimates, over 50% of the world's population relies on agriculture for their livelihoods, and the use of biofertilizers can enhance crop productivity by up to 20%. Additionally, biofertilizers can reduce the need for synthetic fertilizers by up to 30%, contributing to environmental sustainability.

Prevailing Industry Trends & Opportunities

Organic farming is increasingly gaining popularity as the next market trend. The adoption of organic farming practices is on the rise. 

  • Amidst the growing global population and the ensuing pressure on land and natural resources, the agricultural sector faces a significant challenge in maintaining optimal crop nutrient levels. Traditional chemical and inorganic fertilizers, such as ammonia, have been widely used to address this issue. However, their excessive application has been linked to impaired soil quality and potential health hazards. In response, the organic farming industry is gaining traction, driven by the increasing awareness of sustainable farming practices. Organic farming employs biofertilizers, which are naturally occurring microorganisms that promote nutrient uptake and enhance soil health. Compared to chemical fertilizers, biofertilizers offer several advantages.
  • For instance, they can reduce the need for synthetic fertilizers by up to 50%, while improving crop yield by up to 30%. Furthermore, they help to restore soil health, ensuring long-term productivity. These benefits make biofertilizers an attractive alternative for farmers in various sectors, including horticulture, agriculture, and aquaculture.

Significant Market Challenges

The use of nitrogenous fertilizers in the industry raises significant health concerns, posing a substantial challenge to its growth. 

  • Biofertilizers, a sustainable alternative to traditional nitrogenous fertilizers, have gained significant traction in various industries due to their eco-friendly nature and potential health benefits. Unlike nitrogenous fertilizers, which contain chemicals like ammonia, biofertilizers rely on naturally occurring microorganisms to enhance crop productivity. These microorganisms convert atmospheric nitrogen into ammonia, making it available to plants. This process not only reduces the reliance on synthetic fertilizers but also eliminates the risks associated with their use. According to the Food and Agriculture Organization (FAO), biofertilizers can increase crop yield by 10-20% and reduce the use of chemical fertilizers by up to 50%.
  • Furthermore, they help improve soil structure and fertility, leading to better water retention and reduced water usage. The market is expected to grow at a steady pace due to increasing awareness of sustainable agriculture and the need to mitigate the negative impacts of chemical fertilizers on human health and the environment. For instance, cadmium, aluminum, copper, and lead, which are common contaminants in water bodies due to the use of nitrogenous fertilizers, can lead to severe health issues such as hypertension, skin diseases, and kidney failure. The application of chemical fertilizers to plants can also increase the risks of cancer, including leukemia, large intestine cancer, and prostate cancer.
  • By adopting biofertilizers, farmers can significantly reduce the risks associated with chemical fertilizers while maintaining optimal crop productivity.

Biofertilizers Market Size

In-Depth Market Segmentation: Biofertilizers Market

The biofertilizers industry research report provides comprehensive data (region-wise segment analysis), with forecasts and estimates in "USD million" for the period 2024-2028, as well as historical data from 2018-2022 for the following segments.

  • Application
    • Seed treatment
    • Soil treatment
  • Product
    • Nitrogen-fixing biofertilizers
    • Phosphate-solubilizing biofertilizers
    • Others
  • Form
    • Liquid
    • Granular
    • Powder
  • Crop Type
    • Organic
    • Conventional
  • Geography
    • North America
      • US
      • Canada
    • Europe
      • France
      • Germany
      • Italy
      • UK
    • Middle East and Africa
      • Egypt
      • KSA
      • Oman
      • UAE
    • APAC
      • China
      • India
      • Japan
    • South America
      • Argentina
      • Brazil
    • Rest of World (ROW)

By Application Insights

The seed treatment segment is estimated to witness significant growth during the forecast period.

The market continues to evolve, with seed treatment emerging as a significant trend. Seed treatment, which involves applying biofertilizers directly to seeds, enhances their quality and provides access to essential nutrients and beneficial microbes. This process, known as inoculation, boosts crop productivity by promoting growth, enhancing nitrogen fixation, and improving phosphorus solubilization.

Biofertilizers Market Size

Request Free Sample

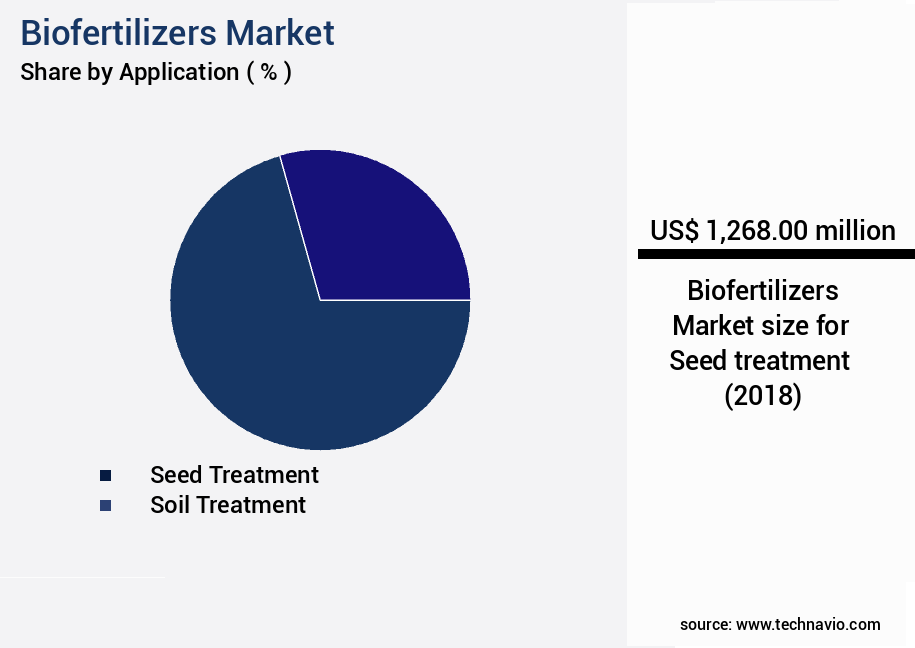
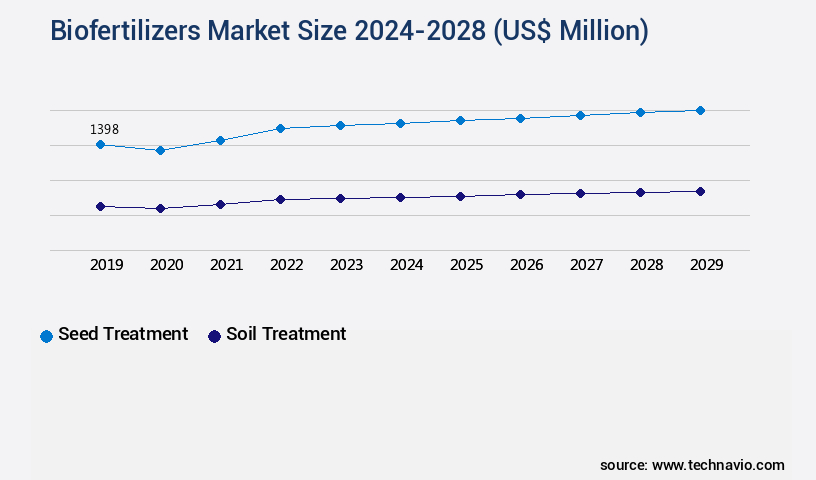
The Seed treatment segment was valued at USD 1.27 billion in 2018 and showed a gradual increase during the forecast period.

Seed treatment also bolsters plant stress tolerance, enabling better root colonization and mycorrhizal association. Furthermore, it aids in soil amendment, pest resistance, and disease suppression, all while increasing microbial diversity and enhancing soil health. With precision farming gaining traction, seed treatment reduces the reliance on conventional chemical fertilizers and pesticides, contributing to sustainable agriculture. Approximately 30% of global seed treatment demand stems from the biofertilizers sector.

Biofertilizers Market Size

Request Free Sample

Regional Analysis

North America is estimated to contribute 34% to the growth of the global market during the forecast period. Technavio's analysts have elaborately explained the regional trends and drivers that shape the market during the forecast period.

Biofertilizers Market Share by Geography

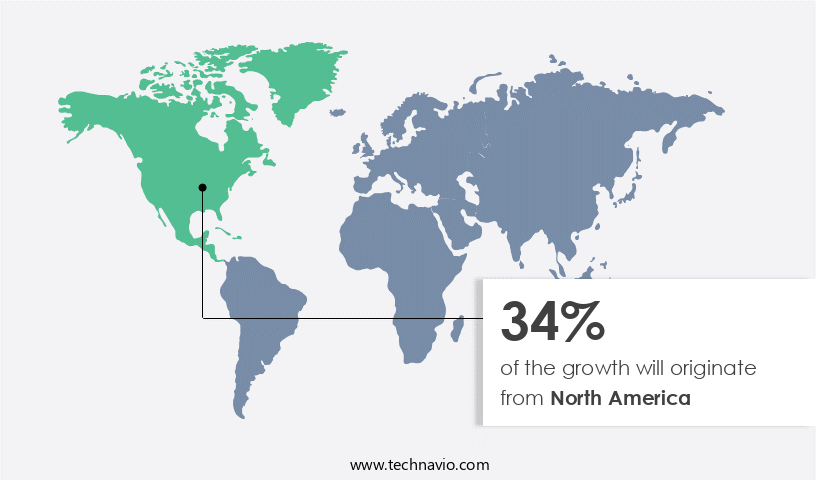
See How Biofertilizers Market Demand is Rising in North America Request Free Sample

The North American market is experiencing significant growth due to the increasing trend toward organic food consumption, driven by urbanization and rising household income. According to the US Department of Agriculture (USDA), the number of certified organic farms in the US has grown by over 20% since 2015. This growth is attributed to the availability of educational resources provided by the USDA, which help organic producers adopt the latest organic farming practices, including the use of biofertilizers. In Canada, the organic food market size was valued at over USD 4 billion in 2020 and is projected to expand at a steady pace.

Biofertilizers' adoption in organic farming is a key factor contributing to this growth, as they offer operational efficiency gains and cost reductions compared to synthetic fertilizers, while also ensuring regulatory compliance.

Biofertilizers Market Share by Geography

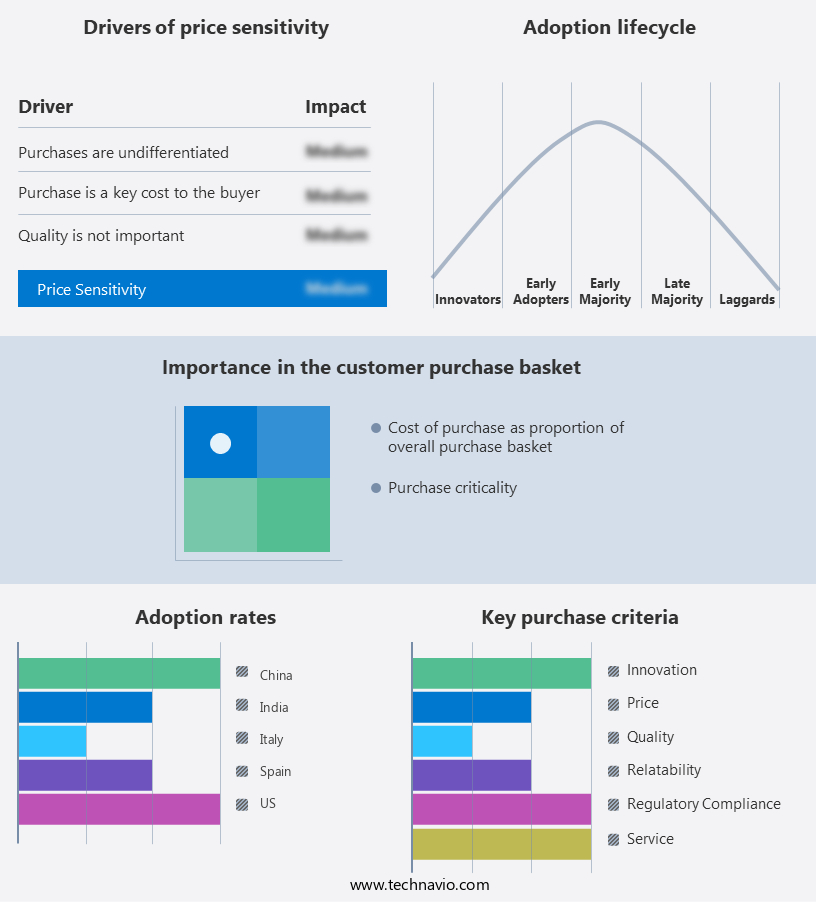
 Customer Landscape of Biofertilizers Industry

Competitive Intelligence by Technavio Analysis: Leading Players in the Biofertilizers Market

Companies are implementing various strategies, such as strategic alliances, biofertilizers market forecast, partnerships, mergers and acquisitions, geographical expansion, and product/service launches, to enhance their presence in the industry.

Novozymes A/S - This company specializes in the production and distribution of biofertilizers, including Soil Set, Contribute Sr, Liqui Plex Bonder, Liqui Plex Minerals, Crop Set, Natures Basics 2x, Grain Set, Agro Mos, and Galvanize Contact. 

The industry research and growth report includes detailed analyses of the competitive landscape of the market and information about key companies, including:

  • Novozymes A/S
  • Chr. Hansen Holding A/S
  • Syngenta AG
  • Bayer AG
  • BASF SE
  • Gujarat State Fertilizers & Chemicals Ltd.
  • Lallemand Inc.
  • Valent BioSciences
  • Kiwa Bio-Tech Products Group Corporation
  • AgriLife
  • Mapleton Agri Biotech
  • Madras Fertilizers Limited
  • Biomax Naturals
  • Rizobacter Argentina S.A.
  • Symborg
  • Stoller Group
  • T. Stanes & Company Limited
  • Camson Bio Technologies
  • Nutramax Laboratories
  • BioProtan

Qualitative and quantitative analysis of companies has been conducted to help clients understand the wider business environment as well as the strengths and weaknesses of key industry players. Data is qualitatively analyzed to categorize companies as pure play, category-focused, industry-focused, and diversified; it is quantitatively analyzed to categorize companies as dominant, leading, strong, tentative, and weak.

Recent Development and News in Biofertilizers Market

  • In August 2024, Danish biotech company Novozymes announced the launch of its new biofertilizer product, "Suezmax N," in collaboration with Suez, a global water technology and recycling solutions provider. This innovative biofertilizer is designed to enhance nitrogen use efficiency in crops, reducing the need for synthetic fertilizers and promoting sustainable agriculture (Novozymes Press Release, 2024).
  • In November 2024, Indian fertilizer manufacturer Coromandel International Limited signed a strategic partnership agreement with the International Fertilizer Development Center (IFDC) to develop and commercialize biofertilizer products using IFDC's proprietary technology. This collaboration aims to strengthen Coromandel's position in the global biofertilizer market and contribute to sustainable agriculture in India (Coromandel International Press Release, 2024).
  • In February 2025, US-based biofertilizer company, BioWorks, Inc., secured a Series C funding round of USD30 million, led by S2G Ventures. This investment will support the expansion of BioWorks' production capacity and the development of new biofertilizer products, further solidifying their position as a key player in the market (BioWorks Press Release, 2025).
  • In May 2025, the European Commission approved the use of certain biofertilizers derived from animal by-products for organic farming, marking a significant policy change. This decision is expected to boost the demand for biofertilizers in the European organic farming sector and promote more sustainable agricultural practices (European Commission Press Release, 2025).

Dive into Technavio's robust research methodology, blending expert interviews, extensive data synthesis, and validated models for unparalleled Biofertilizers Market insights. See full methodology.

Market Scope

Report Coverage

Details

Page number

169

Base year

2023

Historic period

2018-2022

Forecast period

2024-2028

Growth momentum & CAGR

Accelerate at a CAGR of 13.64%

Market growth 2024-2028

USD 2271.4 million

Market structure

Fragmented

YoY growth 2023-2024(%)

11.72

Key countries

US, Canada, Germany, UK, Italy, France, China, India, Japan, Brazil, Egypt, UAE, Oman, Argentina, KSA, UAE, Brazil, and Rest of World (ROW)

Competitive landscape

Leading Companies, Market Positioning of Companies, Competitive Strategies, and Industry Risks

Request Free Sample

Why Choose Technavio for Biofertilizers Market Insights?

"Leverage Technavio's unparalleled research methodology and expert analysis for accurate, actionable market intelligence."

The market is experiencing significant growth as farmers and agribusinesses seek sustainable farming practices. Rhizobacteria mediated nutrient uptake and mycorrhizal fungi colonization impact are key mechanisms driving this trend. Rhizobacteria enhance nutrient availability for plants, while mycorrhizal fungi increase phosphorus use efficiency in crops by up to 20% compared to non-inoculated plants. PGPR (Plant Growth Promoting Rhizobacteria) influence on crop yield is another significant factor, with studies showing an average increase of 10-30% in wheat, rice, and maize yields. Moreover, am fungi contribute to drought tolerance and biocontrol against plant pathogens, making biofertilizers an attractive option for farmers in regions with water scarcity and high disease pressure. The application of biofertilizers also improves soil health by promoting soil nutrient cycling processes, such as organic matter decomposition rate, and enhancing soil microbial diversity. Humic acid enhanced nutrient availability is another important benefit of biofertilizers. Humic acid acts as a natural chelating agent, making nutrients more accessible to plants and improving nitrogen use efficiency by up to 30% in legumes. Furthermore, plant growth promotion mechanisms, such as phytohormone modulation and crop stress tolerance mechanisms, contribute to the overall productivity and resilience of crops. The microbial community composition in soil plays a crucial role in the efficacy of biofertilizers across different crops. Understanding the rhizosphere microbial interactions and their impact on soil health and nutrient cycling processes is essential for optimizing biofertilizer application and ensuring compliance with regulatory requirements. In conclusion, the market offers a sustainable and efficient alternative to traditional fertilizers. By improving nutrient availability, promoting plant growth, and enhancing soil health, biofertilizers contribute to operational planning and supply chain efficiency for agribusinesses. The market growth is expected to continue, with an increasing focus on sustainable farming practices and the need to address the challenges of nutrient deficiencies, water scarcity, and plant pathogens.

What are the Key Data Covered in this Biofertilizers Market Research and Growth Report?

  • What is the expected growth of the Biofertilizers Market between 2024 and 2028?

    • USD 2.27 billion, at a CAGR of 13.64%

  • What segmentation does the market report cover?

    • The report is segmented by Application (Seed treatment and Soil treatment), Product (Nitrogen-fixing biofertilizers, Phosphate-solubilizing biofertilizers, and Others), Geography (North America, Europe, APAC, South America, and Middle East and Africa), Form (Liquid, Granular, and Powder), and Crop Type (Organic and Conventional)

  • Which regions are analyzed in the report?

    • North America, Europe, APAC, South America, and Middle East and Africa

  • What are the key growth drivers and market challenges?

    • Increase in demand for biofertilizers from developing countries, Health concerns regarding use of nitrogenous fertilizers

  • Who are the major players in the Biofertilizers Market?

    • Novozymes A/S, Chr. Hansen Holding A/S, Syngenta AG, Bayer AG, BASF SE, Gujarat State Fertilizers & Chemicals Ltd., Lallemand Inc., Valent BioSciences, Kiwa Bio-Tech Products Group Corporation, AgriLife, Mapleton Agri Biotech, Madras Fertilizers Limited, Biomax Naturals, Rizobacter Argentina S.A., Symborg, Stoller Group, T. Stanes & Company Limited, Camson Bio Technologies, Nutramax Laboratories, and BioProtan

We can help! Our analysts can customize this biofertilizers market research report to meet your requirements.

Get in touch

1 Executive Summary

  • 1.1 Market overview
    • Executive Summary - Chart on Market Overview
    • Executive Summary - Data Table on Market Overview
    • Executive Summary - Chart on Global Market Characteristics
    • Executive Summary - Chart on Market by Geography
    • Executive Summary - Chart on Market Segmentation by Application
    • Executive Summary - Chart on Market Segmentation by Product
    • Executive Summary - Chart on Incremental Growth
    • Executive Summary - Data Table on Incremental Growth
    • Executive Summary - Chart on Company Market Positioning

2 Market Landscape

  • 2.1 Market ecosystem
    • Parent Market
    • Data Table on - Parent Market
  • 2.2 Market characteristics
    • Market characteristics analysis
  • 2.3 Value chain analysis
    • Value Chain Analysis

3 Market Sizing

  • 3.1 Market definition
    • Offerings of companies included in the market definition
  • 3.2 Market segment analysis
    • Market segments
  • 3.3 Market size 2023
    • 3.4 Market outlook: Forecast for 2023-2028
      • Chart on Global - Market size and forecast 2023-2028 ($ million)
      • Data Table on Global - Market size and forecast 2023-2028 ($ million)
      • Chart on Global Market: Year-over-year growth 2023-2028 (%)
      • Data Table on Global Market: Year-over-year growth 2023-2028 (%)

    4 Historic Market Size

    • 4.1 Global Biofertilizers Market 2018 - 2022
      • Historic Market Size - Data Table on Global Biofertilizers Market 2018 - 2022 ($ million)
    • 4.2 Application segment analysis 2018 - 2022
      • Historic Market Size - Application Segment 2018 - 2022 ($ million)
    • 4.3 Product segment analysis 2018 - 2022
      • Historic Market Size - Product Segment 2018 - 2022 ($ million)
    • 4.4 Geography segment analysis 2018 - 2022
      • Historic Market Size - Geography Segment 2018 - 2022 ($ million)
    • 4.5 Country segment analysis 2018 - 2022
      • Historic Market Size - Country Segment 2018 - 2022 ($ million)

    5 Five Forces Analysis

    • 5.1 Five forces summary
      • Five forces analysis - Comparison between 2023 and 2028
    • 5.2 Bargaining power of buyers
      • Bargaining power of buyers - Impact of key factors 2023 and 2028
    • 5.3 Bargaining power of suppliers
      • Bargaining power of suppliers - Impact of key factors in 2023 and 2028
    • 5.4 Threat of new entrants
      • Threat of new entrants - Impact of key factors in 2023 and 2028
    • 5.5 Threat of substitutes
      • Threat of substitutes - Impact of key factors in 2023 and 2028
    • 5.6 Threat of rivalry
      • Threat of rivalry - Impact of key factors in 2023 and 2028
    • 5.7 Market condition
      • Chart on Market condition - Five forces 2023 and 2028

    6 Market Segmentation by Application

    • 6.1 Market segments
      • Chart on Application - Market share (2023-2028) (%)
      • Data Table on Application - Market share (2023-2028) (%)
    • 6.2 Comparison by Application
      • Chart on Comparison by Application
      • Data Table on Comparison by Application
    • 6.3 Seed treatment - Market size and forecast (2023-2028)
      • Chart on Seed treatment - Market size and forecast (2023-2028) ($ million)
      • Data Table on Seed treatment - Market size and forecast (2023-2028) ($ million)
      • Chart on Seed treatment - Year-over-year growth (2023-2028) (%)
      • Data Table on Seed treatment - Year-over-year growth (2023-2028) (%)
    • 6.4 Soil treatment - Market size and forecast (2023-2028)
      • Chart on Soil treatment - Market size and forecast (2023-2028) ($ million)
      • Data Table on Soil treatment - Market size and forecast (2023-2028) ($ million)
      • Chart on Soil treatment - Year-over-year growth (2023-2028) (%)
      • Data Table on Soil treatment - Year-over-year growth (2023-2028) (%)
    • 6.5 Market opportunity by Application
      • Market opportunity by Application ($ million)
      • Data Table on Market opportunity by Application ($ million)

    7 Market Segmentation by Product

    • 7.1 Market segments
      • Chart on Product - Market share (2023-2028) (%)
      • Data Table on Product - Market share (2023-2028) (%)
    • 7.2 Comparison by Product
      • Chart on Comparison by Product
      • Data Table on Comparison by Product
    • 7.3 Nitrogen-fixing biofertilizers - Market size and forecast (2023-2028)
      • Chart on Nitrogen-fixing biofertilizers - Market size and forecast (2023-2028) ($ million)
      • Data Table on Nitrogen-fixing biofertilizers - Market size and forecast (2023-2028) ($ million)
      • Chart on Nitrogen-fixing biofertilizers - Year-over-year growth (2023-2028) (%)
      • Data Table on Nitrogen-fixing biofertilizers - Year-over-year growth (2023-2028) (%)
    • 7.4 Phosphate-solubilizing biofertilizers - Market size and forecast (2023-2028)
      • Chart on Phosphate-solubilizing biofertilizers - Market size and forecast (2023-2028) ($ million)
      • Data Table on Phosphate-solubilizing biofertilizers - Market size and forecast (2023-2028) ($ million)
      • Chart on Phosphate-solubilizing biofertilizers - Year-over-year growth (2023-2028) (%)
      • Data Table on Phosphate-solubilizing biofertilizers - Year-over-year growth (2023-2028) (%)
    • 7.5 Others - Market size and forecast (2023-2028)
      • Chart on Others - Market size and forecast (2023-2028) ($ million)
      • Data Table on Others - Market size and forecast (2023-2028) ($ million)
      • Chart on Others - Year-over-year growth (2023-2028) (%)
      • Data Table on Others - Year-over-year growth (2023-2028) (%)
    • 7.6 Market opportunity by Product
      • Market opportunity by Product ($ million)
      • Data Table on Market opportunity by Product ($ million)

    8 Market Segmentation by Form

    • 8.1 Market segments
      • Chart on Form - Market share (2023-2028) (%)
      • Data Table on Form - Market share (2023-2028) (%)
    • 8.2 Comparison by Form
      • Chart on Comparison by Form
      • Data Table on Comparison by Form
    • 8.3 Liquid - Market size and forecast (2023-2028)
      • Chart on Liquid - Market size and forecast (2023-2028) ($ million)
      • Data Table on Liquid - Market size and forecast (2023-2028) ($ million)
      • Chart on Liquid - Year-over-year growth (2023-2028) (%)
      • Data Table on Liquid - Year-over-year growth (2023-2028) (%)
    • 8.4 Granular - Market size and forecast (2023-2028)
      • Chart on Granular - Market size and forecast (2023-2028) ($ million)
      • Data Table on Granular - Market size and forecast (2023-2028) ($ million)
      • Chart on Granular - Year-over-year growth (2023-2028) (%)
      • Data Table on Granular - Year-over-year growth (2023-2028) (%)
    • 8.5 Powder - Market size and forecast (2023-2028)
      • Chart on Powder - Market size and forecast (2023-2028) ($ million)
      • Data Table on Powder - Market size and forecast (2023-2028) ($ million)
      • Chart on Powder - Year-over-year growth (2023-2028) (%)
      • Data Table on Powder - Year-over-year growth (2023-2028) (%)
    • 8.6 Market opportunity by Form
      • Market opportunity by Form ($ million)
      • Data Table on Market opportunity by Form ($ million)

    9 Market Segmentation by Crop Type

    • 9.1 Market segments
      • Chart on Crop Type - Market share (2023-2028) (%)
      • Data Table on Crop Type - Market share (2023-2028) (%)
    • 9.2 Comparison by Crop Type
      • Chart on Comparison by Crop Type
      • Data Table on Comparison by Crop Type
    • 9.3 Organic - Market size and forecast (2023-2028)
      • Chart on Organic - Market size and forecast (2023-2028) ($ million)
      • Data Table on Organic - Market size and forecast (2023-2028) ($ million)
      • Chart on Organic - Year-over-year growth (2023-2028) (%)
      • Data Table on Organic - Year-over-year growth (2023-2028) (%)
    • 9.4 Conventional - Market size and forecast (2023-2028)
      • Chart on Conventional - Market size and forecast (2023-2028) ($ million)
      • Data Table on Conventional - Market size and forecast (2023-2028) ($ million)
      • Chart on Conventional - Year-over-year growth (2023-2028) (%)
      • Data Table on Conventional - Year-over-year growth (2023-2028) (%)
    • 9.5 Market opportunity by Crop Type
      • Market opportunity by Crop Type ($ million)
      • Data Table on Market opportunity by Crop Type ($ million)

    10 Customer Landscape

    • 10.1 Customer landscape overview
      • Analysis of price sensitivity, lifecycle, customer purchase basket, adoption rates, and purchase criteria

    11 Geographic Landscape

    • 11.1 Geographic segmentation
      • Chart on Market share by geography 2023-2028 (%)
      • Data Table on Market share by geography 2023-2028 (%)
    • 11.2 Geographic comparison
      • Chart on Geographic comparison
      • Data Table on Geographic comparison
    • 11.3 North America - Market size and forecast 2023-2028
      • Chart on North America - Market size and forecast 2023-2028 ($ million)
      • Data Table on North America - Market size and forecast 2023-2028 ($ million)
      • Chart on North America - Year-over-year growth 2023-2028 (%)
      • Data Table on North America - Year-over-year growth 2023-2028 (%)
    • 11.4 Europe - Market size and forecast 2023-2028
      • Chart on Europe - Market size and forecast 2023-2028 ($ million)
      • Data Table on Europe - Market size and forecast 2023-2028 ($ million)
      • Chart on Europe - Year-over-year growth 2023-2028 (%)
      • Data Table on Europe - Year-over-year growth 2023-2028 (%)
    • 11.5 APAC - Market size and forecast 2023-2028
      • Chart on APAC - Market size and forecast 2023-2028 ($ million)
      • Data Table on APAC - Market size and forecast 2023-2028 ($ million)
      • Chart on APAC - Year-over-year growth 2023-2028 (%)
      • Data Table on APAC - Year-over-year growth 2023-2028 (%)
    • 11.6 South America - Market size and forecast 2023-2028
      • Chart on South America - Market size and forecast 2023-2028 ($ million)
      • Data Table on South America - Market size and forecast 2023-2028 ($ million)
      • Chart on South America - Year-over-year growth 2023-2028 (%)
      • Data Table on South America - Year-over-year growth 2023-2028 (%)
    • 11.7 Middle East and Africa - Market size and forecast 2023-2028
      • Chart on Middle East and Africa - Market size and forecast 2023-2028 ($ million)
      • Data Table on Middle East and Africa - Market size and forecast 2023-2028 ($ million)
      • Chart on Middle East and Africa - Year-over-year growth 2023-2028 (%)
      • Data Table on Middle East and Africa - Year-over-year growth 2023-2028 (%)
    • 11.8 US - Market size and forecast 2023-2028
      • Chart on US - Market size and forecast 2023-2028 ($ million)
      • Data Table on US - Market size and forecast 2023-2028 ($ million)
      • Chart on US - Year-over-year growth 2023-2028 (%)
      • Data Table on US - Year-over-year growth 2023-2028 (%)
    • 11.9 China - Market size and forecast 2023-2028
      • Chart on China - Market size and forecast 2023-2028 ($ million)
      • Data Table on China - Market size and forecast 2023-2028 ($ million)
      • Chart on China - Year-over-year growth 2023-2028 (%)
      • Data Table on China - Year-over-year growth 2023-2028 (%)
    • 11.10 India - Market size and forecast 2023-2028
      • Chart on India - Market size and forecast 2023-2028 ($ million)
      • Data Table on India - Market size and forecast 2023-2028 ($ million)
      • Chart on India - Year-over-year growth 2023-2028 (%)
      • Data Table on India - Year-over-year growth 2023-2028 (%)
    • 11.11 Spain - Market size and forecast 2023-2028
      • Chart on Spain - Market size and forecast 2023-2028 ($ million)
      • Data Table on Spain - Market size and forecast 2023-2028 ($ million)
      • Chart on Spain - Year-over-year growth 2023-2028 (%)
      • Data Table on Spain - Year-over-year growth 2023-2028 (%)
    • 11.12 Italy - Market size and forecast 2023-2028
      • Chart on Italy - Market size and forecast 2023-2028 ($ million)
      • Data Table on Italy - Market size and forecast 2023-2028 ($ million)
      • Chart on Italy - Year-over-year growth 2023-2028 (%)
      • Data Table on Italy - Year-over-year growth 2023-2028 (%)
    • 11.13 Market opportunity by geography
      • Market opportunity by geography ($ million)
      • Data Tables on Market opportunity by geography ($ million)
    • 11.14 Canada - Market size and forecast (2023-2028)
      • Chart on Canada - Market size and forecast (2023-2028) ($ million)
      • Data Table on Canada - Market size and forecast (2023-2028) ($ million)
      • Chart on Canada - Year-over-year growth (2023-2028) (%)
      • Data Table on Canada - Year-over-year growth (2023-2028) (%)
    • 11.15 Germany - Market size and forecast (2023-2028)
      • Chart on Germany - Market size and forecast (2023-2028) ($ million)
      • Data Table on Germany - Market size and forecast (2023-2028) ($ million)
      • Chart on Germany - Year-over-year growth (2023-2028) (%)
      • Data Table on Germany - Year-over-year growth (2023-2028) (%)
    • 11.16 UK - Market size and forecast (2023-2028)
      • Chart on UK - Market size and forecast (2023-2028) ($ million)
      • Data Table on UK - Market size and forecast (2023-2028) ($ million)
      • Chart on UK - Year-over-year growth (2023-2028) (%)
      • Data Table on UK - Year-over-year growth (2023-2028) (%)
    • 11.17 France - Market size and forecast (2023-2028)
      • Chart on France - Market size and forecast (2023-2028) ($ million)
      • Data Table on France - Market size and forecast (2023-2028) ($ million)
      • Chart on France - Year-over-year growth (2023-2028) (%)
      • Data Table on France - Year-over-year growth (2023-2028) (%)
    • 11.18 Japan - Market size and forecast (2023-2028)
      • Chart on Japan - Market size and forecast (2023-2028) ($ million)
      • Data Table on Japan - Market size and forecast (2023-2028) ($ million)
      • Chart on Japan - Year-over-year growth (2023-2028) (%)
      • Data Table on Japan - Year-over-year growth (2023-2028) (%)
    • 11.19 Brazil - Market size and forecast (2023-2028)
      • Chart on Brazil - Market size and forecast (2023-2028) ($ million)
      • Data Table on Brazil - Market size and forecast (2023-2028) ($ million)
      • Chart on Brazil - Year-over-year growth (2023-2028) (%)
      • Data Table on Brazil - Year-over-year growth (2023-2028) (%)
    • 11.20 Egypt - Market size and forecast (2023-2028)
      • Chart on Egypt - Market size and forecast (2023-2028) ($ million)
      • Data Table on Egypt - Market size and forecast (2023-2028) ($ million)
      • Chart on Egypt - Year-over-year growth (2023-2028) (%)
      • Data Table on Egypt - Year-over-year growth (2023-2028) (%)
    • 11.21 UAE - Market size and forecast (2023-2028)
      • Chart on UAE - Market size and forecast (2023-2028) ($ million)
      • Data Table on UAE - Market size and forecast (2023-2028) ($ million)
      • Chart on UAE - Year-over-year growth (2023-2028) (%)
      • Data Table on UAE - Year-over-year growth (2023-2028) (%)
    • 11.22 Oman - Market size and forecast (2023-2028)
      • Chart on Oman - Market size and forecast (2023-2028) ($ million)
      • Data Table on Oman - Market size and forecast (2023-2028) ($ million)
      • Chart on Oman - Year-over-year growth (2023-2028) (%)
      • Data Table on Oman - Year-over-year growth (2023-2028) (%)
    • 11.23 Argentina - Market size and forecast (2023-2028)
      • Chart on Argentina - Market size and forecast (2023-2028) ($ million)
      • Data Table on Argentina - Market size and forecast (2023-2028) ($ million)
      • Chart on Argentina - Year-over-year growth (2023-2028) (%)
      • Data Table on Argentina - Year-over-year growth (2023-2028) (%)
    • 11.24 KSA - Market size and forecast (2023-2028)
      • Chart on KSA - Market size and forecast (2023-2028) ($ million)
      • Data Table on KSA - Market size and forecast (2023-2028) ($ million)
      • Chart on KSA - Year-over-year growth (2023-2028) (%)
      • Data Table on KSA - Year-over-year growth (2023-2028) (%)
    • 11.25 UAE - Market size and forecast (2023-2028)
      • Chart on UAE - Market size and forecast (2023-2028) ($ million)
      • Data Table on UAE - Market size and forecast (2023-2028) ($ million)
      • Chart on UAE - Year-over-year growth (2023-2028) (%)
      • Data Table on UAE - Year-over-year growth (2023-2028) (%)
    • 11.26 Brazil - Market size and forecast (2023-2028)
      • Chart on Brazil - Market size and forecast (2023-2028) ($ million)
      • Data Table on Brazil - Market size and forecast (2023-2028) ($ million)
      • Chart on Brazil - Year-over-year growth (2023-2028) (%)
      • Data Table on Brazil - Year-over-year growth (2023-2028) (%)
    • 11.27 Rest of World (ROW) - Market size and forecast (2023-2028)
      • Chart on Rest of World (ROW) - Market size and forecast (2023-2028) ($ million)
      • Data Table on Rest of World (ROW) - Market size and forecast (2023-2028) ($ million)
      • Chart on Rest of World (ROW) - Year-over-year growth (2023-2028) (%)
      • Data Table on Rest of World (ROW) - Year-over-year growth (2023-2028) (%)

    12 Drivers, Challenges, and Opportunity/Restraints

    • 12.1 Market drivers
      • 12.2 Market challenges
        • 12.3 Impact of drivers and challenges
          • Impact of drivers and challenges in 2023 and 2028
        • 12.4 Market opportunities/restraints

          13 Competitive Landscape

          • 13.1 Overview
            • 13.2 Competitive Landscape
              • Overview on criticality of inputs and factors of differentiation
            • 13.3 Landscape disruption
              • Overview on factors of disruption
            • 13.4 Industry risks
              • Impact of key risks on business

            14 Competitive Analysis

            • 14.1 Companies profiled
              • Companies covered
            • 14.2 Market positioning of companies
              • Matrix on companies position and classification
            • 14.3 Novozymes A/S
              • Novozymes A/S - Overview
              • Novozymes A/S - Product / Service
              • Novozymes A/S - Key offerings
            • 14.4 Chr. Hansen Holding A/S
              • Chr. Hansen Holding A/S - Overview
              • Chr. Hansen Holding A/S - Product / Service
              • Chr. Hansen Holding A/S - Key offerings
            • 14.5 Syngenta AG
              • Syngenta AG - Overview
              • Syngenta AG - Product / Service
              • Syngenta AG - Key offerings
            • 14.6 Bayer AG
              • Bayer AG - Overview
              • Bayer AG - Product / Service
              • Bayer AG - Key offerings
            • 14.7 BASF SE
              • BASF SE - Overview
              • BASF SE - Product / Service
              • BASF SE - Key offerings
            • 14.8 Gujarat State Fertilizers & Chemicals Ltd.
              • Gujarat State Fertilizers & Chemicals Ltd. - Overview
              • Gujarat State Fertilizers & Chemicals Ltd. - Product / Service
              • Gujarat State Fertilizers & Chemicals Ltd. - Key offerings
            • 14.9 Lallemand Inc.
              • Lallemand Inc. - Overview
              • Lallemand Inc. - Product / Service
              • Lallemand Inc. - Key offerings
            • 14.10 Valent BioSciences
              • Valent BioSciences - Overview
              • Valent BioSciences - Product / Service
              • Valent BioSciences - Key offerings
            • 14.11 Kiwa Bio-Tech Products Group Corporation
              • Kiwa Bio-Tech Products Group Corporation - Overview
              • Kiwa Bio-Tech Products Group Corporation - Product / Service
              • Kiwa Bio-Tech Products Group Corporation - Key offerings
            • 14.12 AgriLife
              • AgriLife - Overview
              • AgriLife - Product / Service
              • AgriLife - Key offerings
            • 14.13 Mapleton Agri Biotech
              • Mapleton Agri Biotech - Overview
              • Mapleton Agri Biotech - Product / Service
              • Mapleton Agri Biotech - Key offerings
            • 14.14 Madras Fertilizers Limited
              • Madras Fertilizers Limited - Overview
              • Madras Fertilizers Limited - Product / Service
              • Madras Fertilizers Limited - Key offerings
            • 14.15 Biomax Naturals
              • Biomax Naturals - Overview
              • Biomax Naturals - Product / Service
              • Biomax Naturals - Key offerings
            • 14.16 Rizobacter Argentina S.A.
              • Rizobacter Argentina S.A. - Overview
              • Rizobacter Argentina S.A. - Product / Service
              • Rizobacter Argentina S.A. - Key offerings
            • 14.17 Symborg
              • Symborg - Overview
              • Symborg - Product / Service
              • Symborg - Key offerings
            • 14.18 Stoller Group
              • Stoller Group - Overview
              • Stoller Group - Product / Service
              • Stoller Group - Key offerings
            • 14.19 T. Stanes & Company Limited
              • T. Stanes & Company Limited - Overview
              • T. Stanes & Company Limited - Product / Service
              • T. Stanes & Company Limited - Key offerings
            • 14.20 Camson Bio Technologies
              • Camson Bio Technologies - Overview
              • Camson Bio Technologies - Product / Service
              • Camson Bio Technologies - Key offerings
            • 14.21 Nutramax Laboratories
              • Nutramax Laboratories - Overview
              • Nutramax Laboratories - Product / Service
              • Nutramax Laboratories - Key offerings
            • 14.22 BioProtan
              • BioProtan - Overview
              • BioProtan - Product / Service
              • BioProtan - Key offerings
            • 14.23 Alltech Inc.
              • Alltech Inc. - Overview
              • Alltech Inc. - Product / Service
              • Alltech Inc. - Key offerings
            • 14.24 Bioceres Crop Solutions Corp
              • Bioceres Crop Solutions Corp - Overview
              • Bioceres Crop Solutions Corp - Product / Service
              • Bioceres Crop Solutions Corp - Key offerings
            • 14.25 Biomaxnaturals
              • Biomaxnaturals - Overview
              • Biomaxnaturals - Product / Service
              • Biomaxnaturals - Key offerings
            • 14.26 Blacksmith Bioscience Inc.
              • Blacksmith Bioscience Inc. - Overview
              • Blacksmith Bioscience Inc. - Product / Service
              • Blacksmith Bioscience Inc. - Key offerings
            • 14.27 Corteva Inc.
              • Corteva Inc. - Overview
              • Corteva Inc. - Product / Service
              • Corteva Inc. - Key offerings
            • 14.28 EnviroKure Inc.
              • EnviroKure Inc. - Overview
              • EnviroKure Inc. - Product / Service
              • EnviroKure Inc. - Key offerings
            • 14.29 Futureco Bioscience SA
              • Futureco Bioscience SA - Overview
              • Futureco Bioscience SA - Product / Service
              • Futureco Bioscience SA - Key offerings
            • 14.30 Gujarat State Fertilizers and Chemicals Ltd.
              • Gujarat State Fertilizers and Chemicals Ltd. - Overview
              • Gujarat State Fertilizers and Chemicals Ltd. - Product / Service
              • Gujarat State Fertilizers and Chemicals Ltd. - Key offerings
            • 14.31 Kiwa Bio Tech Products Group Corp.
              • Kiwa Bio Tech Products Group Corp. - Overview
              • Kiwa Bio Tech Products Group Corp. - Product / Service
              • Kiwa Bio Tech Products Group Corp. - Key offerings
            • 14.32 Lallemand Inc.
              • Lallemand Inc. - Overview
              • Lallemand Inc. - Product / Service
              • Lallemand Inc. - Key offerings
            • 14.33 Madras Fertilizers Ltd.
              • Madras Fertilizers Ltd. - Overview
              • Madras Fertilizers Ltd. - Product / Service
              • Madras Fertilizers Ltd. - Key offerings
            • 14.34 Mapleton Agri Biotec Pty Ltd.
              • Mapleton Agri Biotec Pty Ltd. - Overview
              • Mapleton Agri Biotec Pty Ltd. - Product / Service
              • Mapleton Agri Biotec Pty Ltd. - Key offerings
            • 14.35 Monarch Bio Energy LLC
              • Monarch Bio Energy LLC - Overview
              • Monarch Bio Energy LLC - Product / Service
              • Monarch Bio Energy LLC - Key offerings
            • 14.36 National Fertilizers Ltd.
              • National Fertilizers Ltd. - Overview
              • National Fertilizers Ltd. - Product / Service
              • National Fertilizers Ltd. - Key offerings
            • 14.37 Novozymes AS
              • Novozymes AS - Overview
              • Novozymes AS - Product / Service
              • Novozymes AS - Key offerings
            • 14.38 NutriAg Group Ltd.
              • NutriAg Group Ltd. - Overview
              • NutriAg Group Ltd. - Product / Service
              • NutriAg Group Ltd. - Key offerings
            • 14.39 PUSHPA J. SHAH
              • PUSHPA J. SHAH - Overview
              • PUSHPA J. SHAH - Product / Service
              • PUSHPA J. SHAH - Key offerings
            • 14.40 Rashtriya Chemicals and Fertilizers Ltd.
              • Rashtriya Chemicals and Fertilizers Ltd. - Overview
              • Rashtriya Chemicals and Fertilizers Ltd. - Product / Service
              • Rashtriya Chemicals and Fertilizers Ltd. - Key offerings
            • 14.41 SOM Phytopharma India Ltd.
              • SOM Phytopharma India Ltd. - Overview
              • SOM Phytopharma India Ltd. - Product / Service
              • SOM Phytopharma India Ltd. - Key offerings
            • 14.42 Utkarsh Agrochem Pvt. Ltd.
              • Utkarsh Agrochem Pvt. Ltd. - Overview
              • Utkarsh Agrochem Pvt. Ltd. - Product / Service
              • Utkarsh Agrochem Pvt. Ltd. - Key offerings

            15 Appendix

            • 15.1 Scope of the report
              • 15.2 Inclusions and exclusions checklist
                • Inclusions checklist
                • Exclusions checklist
              • 15.3 Currency conversion rates for US$
                • Currency conversion rates for US$
              • 15.4 Research methodology
                • Research methodology
              • 15.5 Data procurement
                • Information sources
              • 15.6 Data validation
                • Data validation
              • 15.7 Validation techniques employed for market sizing
                • Validation techniques employed for market sizing
              • 15.8 Data synthesis
                • Data synthesis
              • 15.9 360 degree market analysis
                • 360 degree market analysis
              • 15.10 List of abbreviations
                • List of abbreviations

              Research Methodology

              Technavio presents a detailed picture of the market by way of study, synthesis, and summation of data from multiple sources. The analysts have presented the various facets of the market with a particular focus on identifying the key industry influencers. The data thus presented is comprehensive, reliable, and the result of extensive research, both primary and secondary.

              INFORMATION SOURCES

              Primary sources

              • Manufacturers and suppliers
              • Channel partners
              • Industry experts
              • Strategic decision makers

              Secondary sources

              • Industry journals and periodicals
              • Government data
              • Financial reports of key industry players
              • Historical data
              • Press releases

              DATA ANALYSIS

              Data Synthesis

              • Collation of data
              • Estimation of key figures
              • Analysis of derived insights

              Data Validation

              • Triangulation with data models
              • Reference against proprietary databases
              • Corroboration with industry experts

              REPORT WRITING

              Qualitative

              • Market drivers
              • Market challenges
              • Market trends
              • Five forces analysis

              Quantitative

              • Market size and forecast
              • Market segmentation
              • Geographical insights
              • Competitive landscape

              Interested in this report?

              Get your sample now to see our research methodology and insights!

              Download Now

              Frequently Asked Questions

              Biofertilizers market growth will increase by $ 2271.4 mn during 2024-2028 .

              The Biofertilizers market is expected to grow at a CAGR of 13.64% during 2024-2028 .

              Biofertilizers market is segmented by Application( Seed treatment, Soil treatment, Others) Product( Nitrogen-fixing biofertilizers, Phosphate-solubilizing biofertilizers, Others, South America, MEA)

              Novozymes A/S, Chr. Hansen Holding A/S, Syngenta AG, Bayer AG, BASF SE, Gujarat State Fertilizers & Chemicals Ltd., Lallemand Inc., Valent BioSciences, Kiwa Bio-Tech Products Group Corporation, AgriLife, Mapleton Agri Biotech, Madras Fertilizers Limited, Biomax Naturals, Rizobacter Argentina S.A., Symborg, Stoller Group, T. Stanes & Company Limited, Camson Bio Technologies, Nutramax Laboratories, BioProtan are a few of the key vendors in the Biofertilizers market.

              North America will register the highest growth rate of 34% among the other regions. Therefore, the Biofertilizers market in North America is expected to garner significant business opportunities for the vendors during the forecast period.

              US, Canada, Germany, UK, Italy, France, China, India, Japan, Brazil, Egypt, UAE, Oman, Argentina, KSA, UAE, Brazil, Rest of World (ROW)

              • Increase in demand for biofertilizers from developing countriesThe growing demand for biofertilizers from China is the driving factor this market.
              • India is the driving factor this market.
              • Brazil is the driving factor this market.
              • Indonesia is the driving factor this market.
              • and Pakistan is expected to drive the growth of the market in focus during the forecast period. The growth of the agricultural sector in these countries to meet the growing food requirements has contributed to the biofertilizer market growth. Biofertilizers can be easily applied and ensure superior performance. The growing demand for high-quality fertilizers and the use of technology-driven irrigation is the driving factor this market.
              • including micro drip irrigation is the driving factor this market.
              • are expected to drive the demand for biofertilizers during the forecast period. APAC is one of the major consumers of fertilizers in the world. The increasing population and rising per capita income contribute to the demand for food and agricultural products. For instance is the driving factor this market.
              • the population of India and China reached nearly 1.43 billion and 1.43 billion is the driving factor this market.
              • respectively is the driving factor this market.
              • in 2023. The shift from grain-based to high protein-based diets is the driving factor this market.
              • particularly in China and India is the driving factor this market.
              • has increased the use of biofertilizers to cultivate crops with high protein content. In India is the driving factor this market.
              • more than half of the population depends on agriculture as the primary source of livelihood. The country was the major producer of wheat is the driving factor this market.
              • sugarcane is the driving factor this market.
              • rice is the driving factor this market.
              • and fruits and vegetables in 2022. Government subsidies and incentives on fertilizers to support the agriculture sector will increase the demand for biofertilizers. Government support and initiatives for agriculture production in APAC will increase the consumption of biofertilizers. Hence is the driving factor this market.
              • such factors will drive the growth of the global biofertilizer market during the forecast period. is the driving factor this market.

              The Biofertilizers market vendors should focus on grabbing business opportunities from the Seed treatment segment as it accounted for the largest market share in the base year.