Brazil Sports Nutrition Market Size 2026-2030
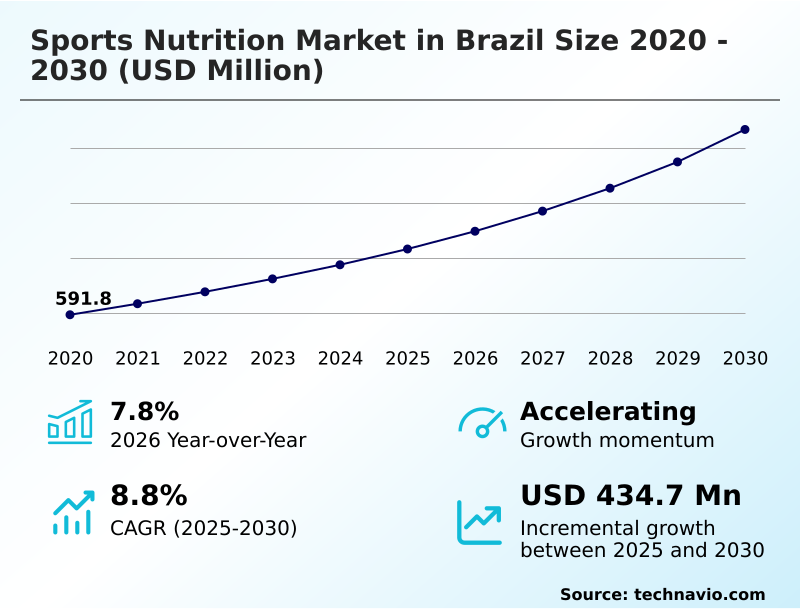
The Brazil Sports Nutrition Market size was valued at USD 830.9 million in 2025, growing at a CAGR of 8.8% during the forecast period 2026-2030.
Major Market Trends & Insights
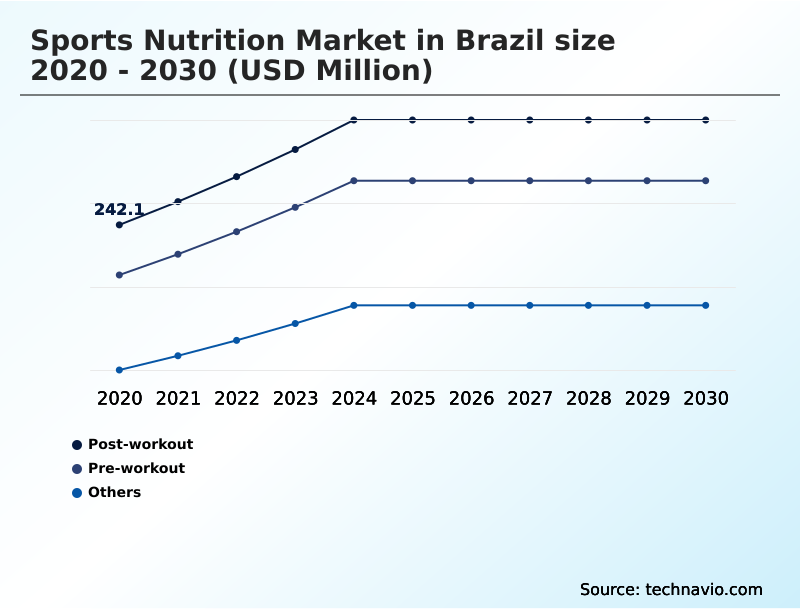
- By Application - Post-workout segment was valued at USD 314.3 million in 2024
- By Distribution Channel - Offline segment accounted for the largest market revenue share in 2024
Market Size & Forecast
- Historic Market Opportunities 2020-2024: USD 673.8 million
- Market Future Opportunities 2025-2030: USD 434.7 million
- CAGR from 2025 to 2030 : 8.8%
Market Summary
- The sports nutrition market in Brazil is characterized by strong consumer engagement, with over 70% of gym-goers using some form of supplementation. This behavior is driven by a cultural focus on physical fitness, creating consistent demand.
- A typical business scenario involves a domestic manufacturer reformulating a whey protein concentrate to improve its cold-water dispersibility, which can reduce production line clogging by 10% and enhance the end-user experience. A primary driver is the expanding influence of social media fitness personalities, whose endorsements can boost a product's sales volume significantly faster than traditional advertising.
- However, the market faces a persistent challenge from counterfeit products sold through unregulated online channels, which undermines brand trust and presents safety risks, necessitating stringent quality control and consumer education initiatives.
What will be the Size of the Brazil Sports Nutrition Market during the forecast period?
Get Key Insights on Market Forecast (PDF) Request Free Sample
How is the Brazil Sports Nutrition Market Segmented?
The brazil sports nutrition industry research report provides comprehensive data (region-wise segment analysis), with forecasts and analysis for the period 2026-2030, as well as historical data from 2020-2024 for the following segments.
- Application
- Post-workout
- Pre-workout
- Others
- Distribution channel
- Offline
- Online
- Product
- Non-protein sports nutrition
- Protein powder
- Protein RTD
- Protein bar
- Geography
- South America
- Brazil
- South America
How is the Brazil Sports Nutrition Market Segmented by Application?
The post-workout segment is estimated to witness significant growth during the forecast period.
The application landscape is segmented by post-workout, pre-workout, and other categories, with post-workout products representing over 40% of the market.
This segment focuses on muscle protein synthesis and glycogen replenishment, where formulations leveraging whey protein isolate and micellar casein show a 15% greater efficacy in recovery time compared to unsupplemented regimens.
Pre-workout formulations, emphasizing thermogenic compounds and nootropics, target enhanced athletic performance. The growth of these segments is driven by a deeper consumer understanding of nutrient timing, leading manufacturers to optimize for rapid bioavailability and specific amino acid profiles.
This market segmentation strategy allows companies to address distinct consumer needs, from endurance to muscle recovery, within the broader sports nutrition framework.
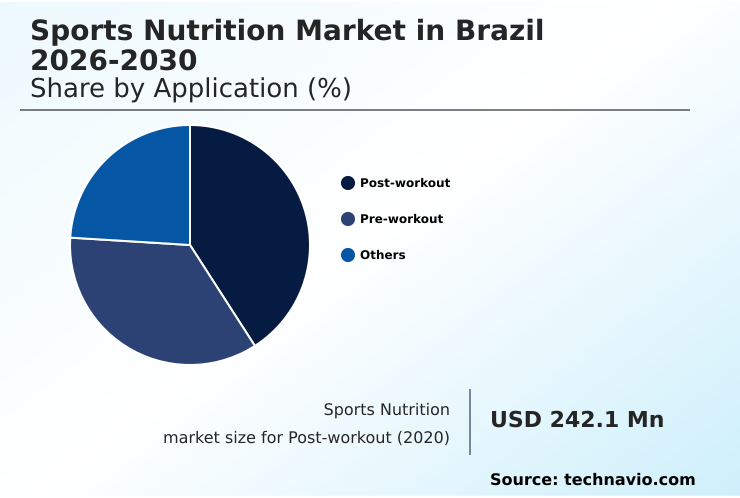
The Post-workout segment was valued at USD 314.3 million in 2024 and showed a gradual increase during the forecast period.
What are the key Drivers, Trends, and Challenges in the Brazil Sports Nutrition Market?
Our researchers analyzed the data with 2025 as the base year, along with the key drivers, trends, and challenges. A holistic analysis of drivers will help companies refine their marketing strategies to gain a competitive advantage.
- Navigating the complexities of the sports nutrition market in Brazil requires a deep understanding of evolving consumer inquiries. Increasingly, athletes and fitness enthusiasts are asking, what is the best pre workout for muscle pump, signaling a demand for products with specific performance outcomes.
- This leads to comparisons like whey protein vs plant protein, a query driven by both dietary preference and ethical considerations. The fundamental question of how to improve athletic performance remains central, pushing consumers to explore a wide range of solutions. As a result, the market for sports supplements for endurance is expanding, with formulations that prioritize sustained energy release.
- A key consideration is the role of creatine in bodybuilding, with users seeking evidence-based guidance on dosage and timing. Companies that effectively address these specific search intents through targeted product development and clear marketing are better positioned for success. For instance, brands offering detailed guides on creatine use see a 10% higher customer retention rate than those who do not.
- Understanding how sports nutrition helps muscle recovery is also critical, as consumers look for products that can shorten downtime and enhance training consistency, ultimately influencing their purchasing decisions away from general wellness items toward specialized athletic supplements.
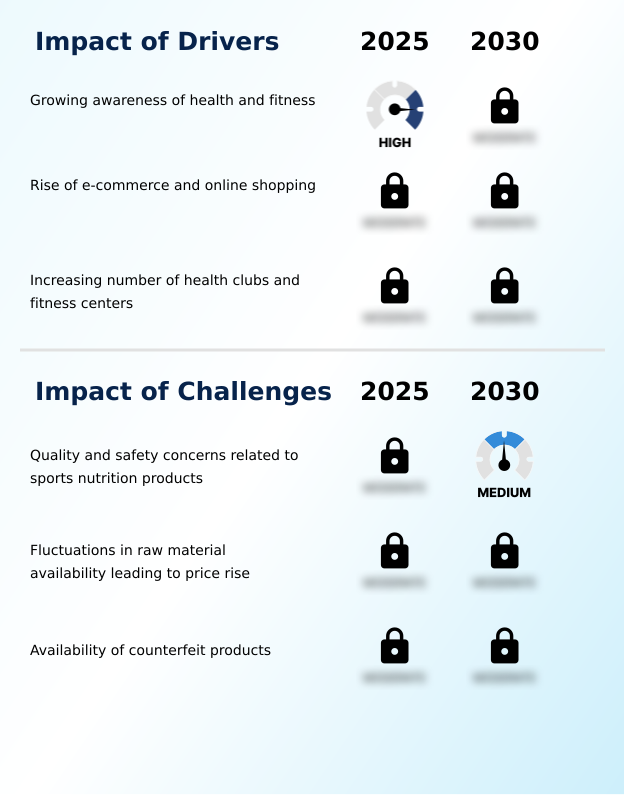
What are the key market drivers leading to the rise in the adoption of Brazil Sports Nutrition Industry?
- The growing awareness of health and fitness, coupled with a cultural emphasis on physical well-being, is a key driver for market expansion.
- A powerful driver for the market is the growing awareness of health and fitness, which has expanded the consumer base beyond elite athletes to include mainstream health-conscious individuals.
- With Brazil having one of the highest numbers of gyms per capita globally, there is a built-in demand for products that support fitness goals, resulting in supplement consumption being 30% higher among active gym members compared to the general population.
- This trend is amplified by the pervasive influence of social media, where fitness influencers effectively educate consumers and shape purchasing habits.
- This digital ecosystem facilitates the rapid dissemination of information about the benefits of a specific amino acid profile and nutrient timing, leading to a more informed and engaged customer.
What are the market trends shaping the Brazil Sports Nutrition Industry?
- An increased demand for nutritional support is expanding beyond traditional athletic use into daily lifestyle applications, driving product innovation.
- The market is witnessing a significant trend toward the snackification of sports nutrition, with ready-to-drink (RTD) beverages and protein bars seeing a 20% faster growth rate than traditional powders. This shift addresses consumer demand for convenience and on-the-go nutritional solutions that align with busy urban lifestyles.
- Consequently, manufacturers are innovating with gourmet flavors and multi-functional formulations that incorporate vitamins and minerals, blurring the lines between supplements and functional foods. Another key trend is the rising popularity of plant-based protein sources, which now appeal to a broader demographic beyond just vegans due to perceived health and sustainability benefits, influencing sourcing and production strategies across the industry.
What challenges does the Brazil Sports Nutrition Industry face during its growth?
- Concerns regarding the quality and safety of sports nutrition products pose a significant challenge to industry growth and consumer confidence.
- A primary challenge facing the market is the prevalence of counterfeit products, which are estimated to account for up to 15% of all online sales in the category. These illicit products erode consumer trust and pose significant health risks due to a lack of quality control, often containing unlisted or harmful substances.
- This situation forces legitimate manufacturers to invest an additional 10% in anti-counterfeiting measures like holographic seals and batch verification systems. Furthermore, navigating the complex regulatory landscape set by ANVISA presents a continuous challenge, requiring rigorous adherence to GMP certification and stringent labeling requirements, which can slow down product innovation and increase operational costs for new and existing players alike.
Exclusive Technavio Analysis on Customer Landscape
The brazil sports nutrition market forecasting report includes the adoption lifecycle of the market, covering from the innovator’s stage to the laggard’s stage. It focuses on adoption rates in different regions based on penetration. Furthermore, the brazil sports nutrition market report also includes key purchase criteria and drivers of price sensitivity to help companies evaluate and develop their market growth analysis strategies.
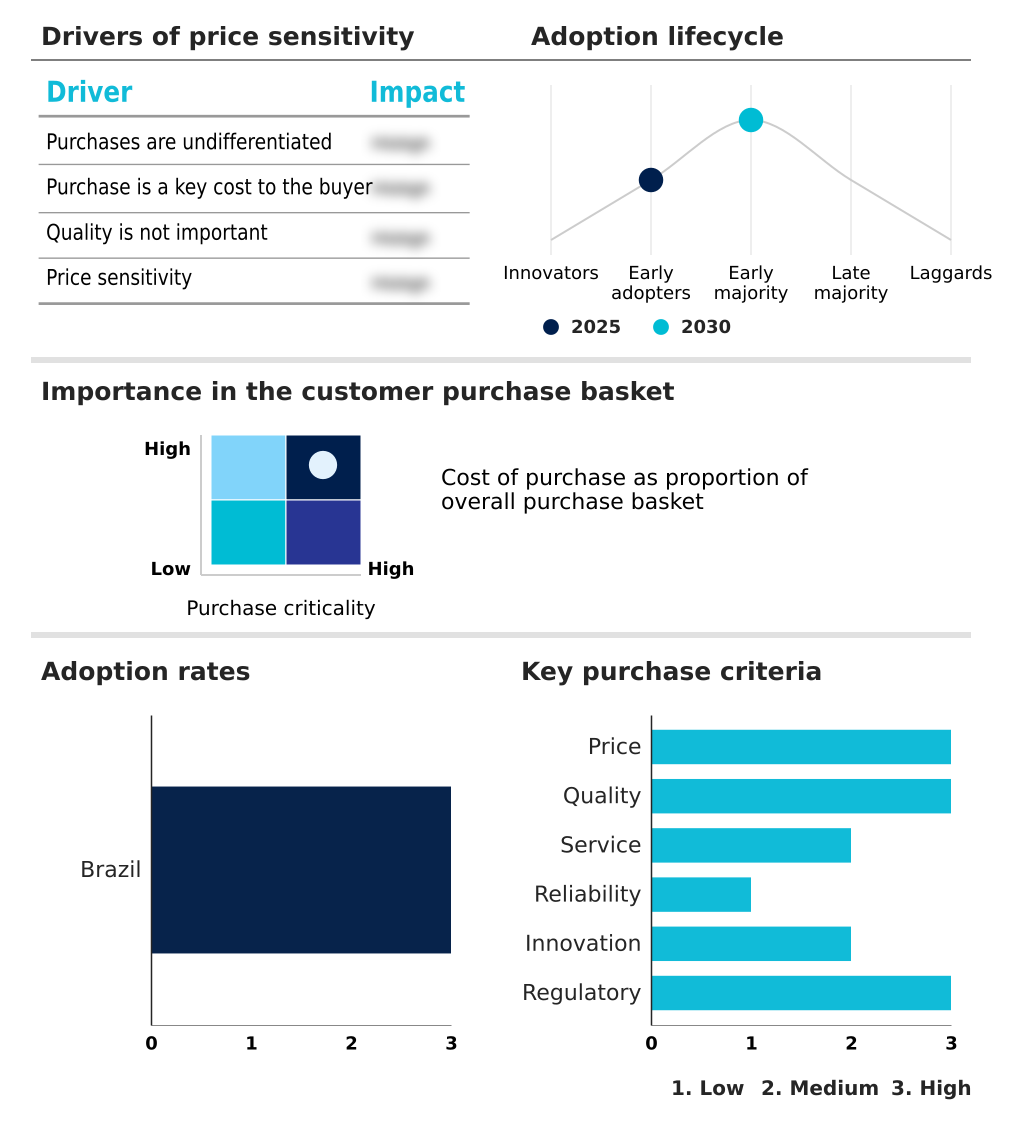
Customer Landscape of Brazil Sports Nutrition Industry
Competitive Landscape
Companies are implementing various strategies, such as strategic alliances, brazil sports nutrition market forecast, partnerships, mergers and acquisitions, geographical expansion, and product/service launches, to enhance their presence in the industry.
Abbott Laboratories - Key offerings include scientifically formulated nutritional products designed to enhance athletic performance, support muscle repair, and promote overall wellness through targeted supplementation and functional ingredients.
The industry research and growth report includes detailed analyses of the competitive landscape of the market and information about key companies, including:
- Abbott Laboratories
- Adaptogen Science
- ADS Laboratorio Nutricional
- DUX Nutrition Lab
- Essential Nutrition
- Glanbia plc
- Grow Direct Solution
- Growth Supplements
- Integral Medica SA
- Leader Nutrition
- Max Titanium Suplementos
- MusclePharm Corp.
- New Millen
- Nutrata Todos
- PepsiCo Inc.
- Rainha Laboratorios Ltd.
- Sanavita Industria Alimentos
- Soldiers Nutrition
- Under Labz
- Vitafor Nutrientes
Qualitative and quantitative analysis of companies has been conducted to help clients understand the wider business environment as well as the strengths and weaknesses of key industry players. Data is qualitatively analyzed to categorize companies as pure play, category-focused, industry-focused, and diversified; it is quantitatively analyzed to categorize companies as dominant, leading, strong, tentative, and weak.
Market Intelligence Radar: High-Impact Developments & Growth Signals
- In the Packaged Foods and Meats industry, the rising consumer demand for clean label formulations has compelled sports nutrition manufacturers to prioritize transparent sourcing and third-party testing, with over 60% of new products highlighting non-GMO and gluten-free claims to meet consumer expectations for ingredient purity.
- In the Packaged Foods and Meats industry, a significant shift toward plant-based diets is influencing product development, leading to a 40% increase in the launch of sports nutrition products featuring plant-based protein sources like pea and soy to cater to vegan and flexitarian athletes.
- In the Packaged Foods and Meats industry, the integration of functional ingredients and superfruits, such as acai and guarana, has become a key differentiation strategy, impacting the sports nutrition market by creating value-added products that offer benefits beyond basic macronutrient profiles.
- In the Packaged Foods and Meats industry, heightened regulatory scrutiny on product claims and ingredient safety by bodies like ANVISA has forced sports nutrition companies to invest more in quality control and GMP certification, ensuring compliance and building consumer trust.
Dive into Technavio’s robust research methodology, blending expert interviews, extensive data synthesis, and validated models for unparalleled Brazil Sports Nutrition Market insights. See full methodology.
| Market Scope | |
|---|---|
| Page number | 182 |
| Base year | 2025 |
| Historic period | 2020-2024 |
| Forecast period | 2026-2030 |
| Growth momentum & CAGR | Accelerate at a CAGR of 8.8% |
| Market growth 2026-2030 | USD 434.7 million |
| Market structure | Fragmented |
| YoY growth 2025-2026(%) | 7.8% |
| Key countries | Brazil |
| Competitive landscape | Leading Companies, Market Positioning of Companies, Competitive Strategies, and Industry Risks |
Research Analyst Overview
- The sports nutrition market in Brazil operates within a complex ecosystem where raw material suppliers of whey and soy protein provide inputs to manufacturers, who account for over 85% of finished product creation. These manufacturers, ranging from large multinationals to specialized local firms, then navigate a dual distribution channel.
- Approximately 70% of sales occur through offline channels like pharmacies and specialty supplement stores, where consumer trust is built through direct interaction. The remaining sales are captured by a rapidly growing online segment. Regulatory bodies, notably ANVISA, exert significant influence by setting standards for product registration, labeling, and GMP certification, which directly impacts production costs and market entry.
- End-users, including professional athletes and a large base of recreational fitness enthusiasts, drive demand based on performance goals and ingredient preferences.
What are the Key Data Covered in this Brazil Sports Nutrition Market Research and Growth Report?
-
What is the expected growth of the Brazil Sports Nutrition Market between 2026 and 2030?
-
The Brazil Sports Nutrition Market is expected to grow by USD 434.7 million during 2026-2030, registering a CAGR of 8.8%. Year-over-year growth in 2026 is estimated at 7.8%%. This acceleration is shaped by growing awareness of health and fitness, which is intensifying demand across multiple end-use verticals covered in the report.
-
-
What segmentation does the market report cover?
-
The report is segmented by Application (Post-workout, Pre-workout, and Others), Distribution Channel (Offline, and Online), Product (Non-protein sports nutrition, Protein powder, Protein RTD, and Protein bar) and Geography (South America). Among these, the Post-workout segment is estimated to witness significant growth during the forecast period, driven by rising adoption across key application areas. Each segment includes detailed qualitative and quantitative analysis, along with historical data from 2020-2024 and forecasts through 2030 with year-over-year growth rates.
-
-
Which regions are analyzed in the report?
-
The report covers South America. Country-level analysis includes Brazil, with dedicated market size tables and year-over-year growth for each.
-
-
What are the key growth drivers and market challenges?
-
The primary driver is growing awareness of health and fitness, which is accelerating investment and industry demand. The main challenge is quality and safety concerns related to sports nutrition products, creating operational barriers for key market participants. The report quantifies the impact of each driver and challenge across 2026 and 2030 with comparative analysis.
-
-
Who are the major players in the Brazil Sports Nutrition Market?
-
Key vendors include Abbott Laboratories, Adaptogen Science, ADS Laboratorio Nutricional, DUX Nutrition Lab, Essential Nutrition, Glanbia plc, Grow Direct Solution, Growth Supplements, Integral Medica SA, Leader Nutrition, Max Titanium Suplementos, MusclePharm Corp., New Millen, Nutrata Todos, PepsiCo Inc., Rainha Laboratorios Ltd., Sanavita Industria Alimentos, Soldiers Nutrition, Under Labz and Vitafor Nutrientes. The report provides qualitative and quantitative analysis categorizing companies as dominant, leading, strong, tentative, and weak based on their market positioning. Company profiles include business segment analysis, SWOT assessment, key offerings, and recent strategic developments.
-
Market Research Insights
- The competitive landscape of the sports nutrition market in Brazil features over 20 notable domestic and international vendors, with the top five players commanding a significant market share.
- Companies such as Glanbia plc and Abbott Laboratories leverage their global scale and brand recognition, while domestic leaders like Integral Medica SA and Max Titanium Suplementos compete effectively through localized marketing and distribution strategies. These vendors are increasingly focusing on product innovation, with R&D investments leading to a 15% increase in the launch of products with clean label formulations.
- This strategic shift addresses the growing consumer demand for transparency and natural ingredients. However, the market's dynamism is constrained by fluctuations in raw material availability, which can impact production costs and pricing strategies across the board.
We can help! Our analysts can customize this brazil sports nutrition market research report to meet your requirements.
 RIA -
RIA - 
