Sports Nutrition Market Size 2025-2029
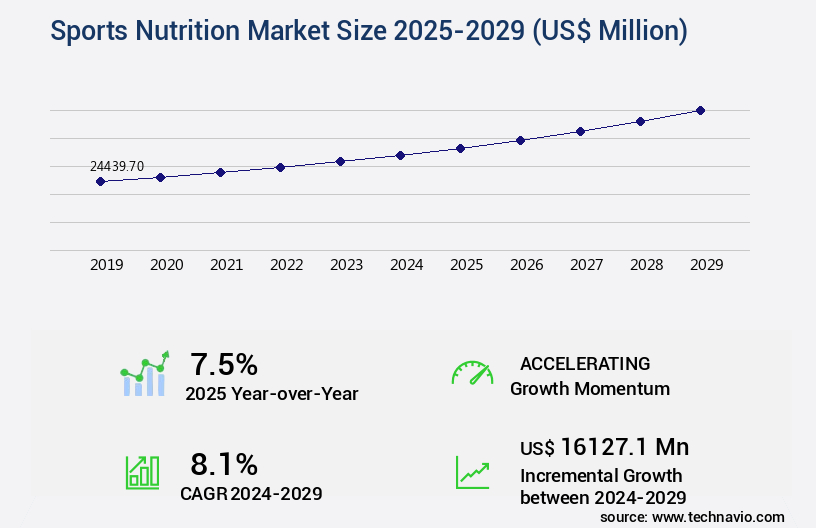
The sports nutrition market size is valued to increase USD 16.13 billion, at a CAGR of 8.1% from 2024 to 2029. Rise of personalized nutrition and data-driven approaches will drive the sports nutrition market.
Major Market Trends & Insights
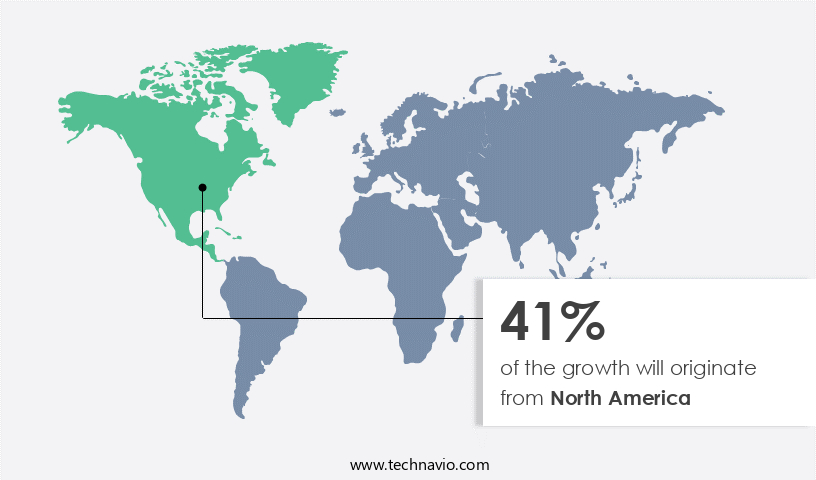
- North America dominated the market and accounted for a 41% growth during the forecast period.
- By Product - Non-protein segment was valued at USD 13.42 billion in 2023
- By Distribution Channel - Offline segment accounted for the largest market revenue share in 2023
Market Size & Forecast
- Market Opportunities: USD 103.73 million
- Market Future Opportunities: USD 16127.10 million
- CAGR : 8.1%
- North America: Largest market in 2023
Market Summary
- The market encompasses a dynamic and evolving industry, driven by advancements in core technologies and applications. Core technologies, such as protein supplementation and functional ingredients, continue to shape the market's landscape. Applications, including weight management, endurance, and muscle gain, fuel the demand for sports nutrition products. Service types, like customized meal plans and personal coaching, add value to the market. Regulations, such as FDA guidelines and certifications, ensure product safety and quality. With the rise of personalized nutrition and data-driven approaches, the market is witnessing a significant shift towards tailored solutions.
- The growing demand for plant-based sports nutrition, driven by consumer preferences and ethical considerations, is another key trend. According to a recent study, plant-based protein supplements accounted for over 15% of the market share in 2020. Despite these opportunities, concerns about the quality of ingredients used in sports nutrition products persist, presenting challenges for market participants.
What will be the Size of the Sports Nutrition Market during the forecast period?
Get Key Insights on Market Forecast (PDF) Request Free Sample
How is the Sports Nutrition Market Segmented and what are the key trends of market segmentation?
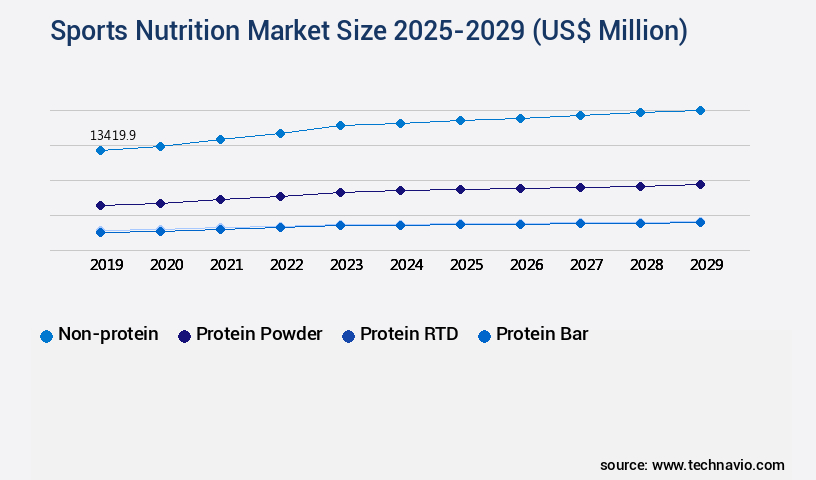
The sports nutrition industry research report provides comprehensive data (region-wise segment analysis), with forecasts and estimates in "USD million" for the period 2025-2029, as well as historical data from 2019-2023 for the following segments.
- Product
- Non-protein
- Protein powder
- Protein RTD
- Protein bar
- Distribution Channel
- Offline
- Online
- Raw Material
- Animal derived
- Plant-based
- Mixed
- End-user
- Athletes
- Fitness enthusiasts
- Bodybuilders
- Lifestyle users
- Form
- Powder
- Capsules & Tablets
- Ready-to-Drink (RTD)
- Bars
- Gels
- Chews
- Application
- Bodybuilding
- Weightlifting
- Strength Training
- Endurance Sports
- Team Sports
- Athletic Performance
- Weight Management
- Geography
- North America
- US
- Canada
- Europe
- France
- Germany
- Italy
- UK
- Middle East and Africa
- Egypt
- KSA
- Oman
- UAE
- APAC
- China
- India
- Japan
- South America
- Argentina
- Brazil
- Rest of World (ROW)
- North America
By Product Insights
The non-protein segment is estimated to witness significant growth during the forecast period.
In the dynamic and evolving the market, the non-protein segment is experiencing steady growth due to increasing consumer preferences for convenient products, the rising demand from mainstream consumers, and the trend toward clean-label options. This segment encompasses various categories, including amino acids, carbohydrates, Beta-alanine, creatine, L-carnitine, and nitric oxide boosters. These nutrients are available in various forms, such as powders, bars, ready-to-drink (RTD) beverages, gels, and tablets. The United Kingdom, Japan, Australia, and Sweden are the leading consumers of non-protein sports nutrition products. Consumer intake of protein is influenced by factors such as age, gender, and health conditions. For instance, individuals with liver or kidney disorders may prefer non-protein products due to the potential interference of excessive protein consumption with their metabolic processes.
Carbohydrate metabolism plays a crucial role in sports nutrition, with nutrient timing and digestive health being essential considerations. Non-essential amino acids, such as Beta-hydroxy-beta-methylbutyrate (HMB), support muscle protein synthesis and insulin sensitivity, contributing to performance enhancement. Strength training and endurance performance are key applications for sports nutrition products. Electrolyte balance and hydration strategies are essential for athletes, particularly during intense workouts and competitions. Weight management and glycogen replenishment are other important areas of focus for sports nutrition consumers. Protein powder blends, including whey protein isolate, casein protein, and soy protein, are popular choices for muscle hypertrophy and body composition improvement.
Protein synthesis and exercise recovery are crucial aspects of sports nutrition, with recovery strategies such as hydrolyzed whey protein and creatine supplementation being widely used. The hormonal response to sports nutrition products is an area of ongoing research, with the gut microbiome and muscle protein breakdown being key areas of interest. The amino acid profile of various sports nutrition products plays a significant role in their effectiveness, with fat oxidation and muscle growth being important considerations for athletes.
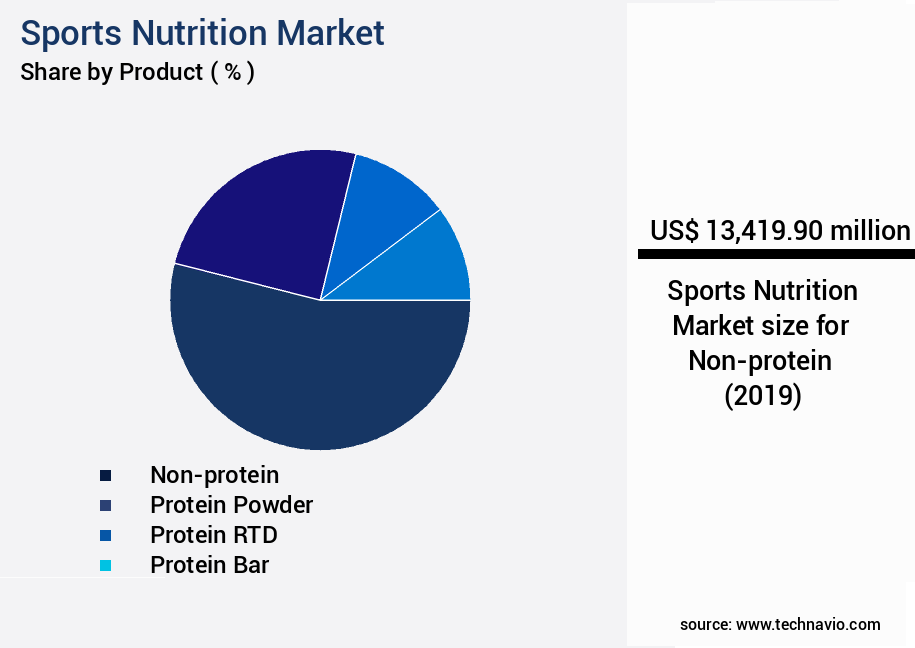
The Non-protein segment was valued at USD 13.42 billion in 2019 and showed a gradual increase during the forecast period.
Regional Analysis
North America is estimated to contribute 41% to the growth of the global market during the forecast period.Technavio’s analysts have elaborately explained the regional trends and drivers that shape the market during the forecast period.
See How Sports Nutrition Market Demand is Rising in North America Request Free Sample
The North American region holds a significant share in The market, with the US and Canada being the major contributors. Factors such as increasing consumer preference for sports nutrition products, the trend towards healthier eating, and the proliferation of health clubs are driving market growth in this region. During the forecast period, the market is expected to experience steady expansion due to the rising demand for meal-replacement powders and ready-to-drink (RTD) products.
Major market players are focusing on expanding their product offerings through strategic acquisitions. For instance, in 2024, Keurig Dr Pepper announced the acquisition of Ghost, a popular sports nutrition and energy drink brand, to strengthen its presence in the market.
Market Dynamics
Our researchers analyzed the data with 2024 as the base year, along with the key drivers, trends, and challenges. A holistic analysis of drivers will help companies refine their marketing strategies to gain a competitive advantage.
The market is a dynamic and evolving industry, catering to the unique nutritional needs of athletes and fitness enthusiasts. This market encompasses a wide range of products designed to enhance performance, aid in recovery, and promote overall health. One of the key areas of focus in sports nutrition is the role of specific nutrients in optimizing athletic performance. For instance, creatine has been shown to significantly impact muscle power, while whey protein plays a crucial role in muscle recovery post-exercise. Branched-chain amino acids (BCAAs) are another essential component, as they help reduce muscle soreness and support muscle growth.
Carbohydrate loading is another essential strategy for athletes participating in endurance events, ensuring optimal energy levels and improving performance. The timing of protein intake is also crucial, as it impacts muscle protein synthesis and overall muscle growth. Hydration is another critical aspect of sports nutrition, with electrolytes playing a vital role in maintaining proper hydration levels during exercise. Probiotics have gained popularity among athletes due to their positive impact on gut health, while personalized nutrition plans tailored to individual requirements have emerged as a promising trend. The market also emphasizes the importance of antioxidants in reducing exercise-induced oxidative stress and the role of dietary fiber in promoting digestive health.
The effectiveness of various protein sources and their impact on muscle hypertrophy is a topic of ongoing research. Adoption rates of sports nutrition products vary significantly across different segments, with a notable disparity between high-performance athletes and casual fitness enthusiasts. For instance, high-performance athletes may require more extensive nutritional support, with a greater focus on optimizing macronutrient intake and individual requirements. In conclusion, the market is a diverse and dynamic industry, driven by ongoing research and the evolving needs of athletes and fitness enthusiasts. From creatine and whey protein to carbohydrate loading and personalized nutrition plans, the market offers a wide range of products designed to support optimal performance and overall health.
Approximately 60% of new product developments in the market focus on functional ingredients, reflecting the growing demand for performance-enhancing and health-promoting nutrients. This trend underscores the market's commitment to innovation and its ability to cater to the evolving needs of athletes and fitness enthusiasts.
What are the key market drivers leading to the rise in the adoption of Sports Nutrition Industry?
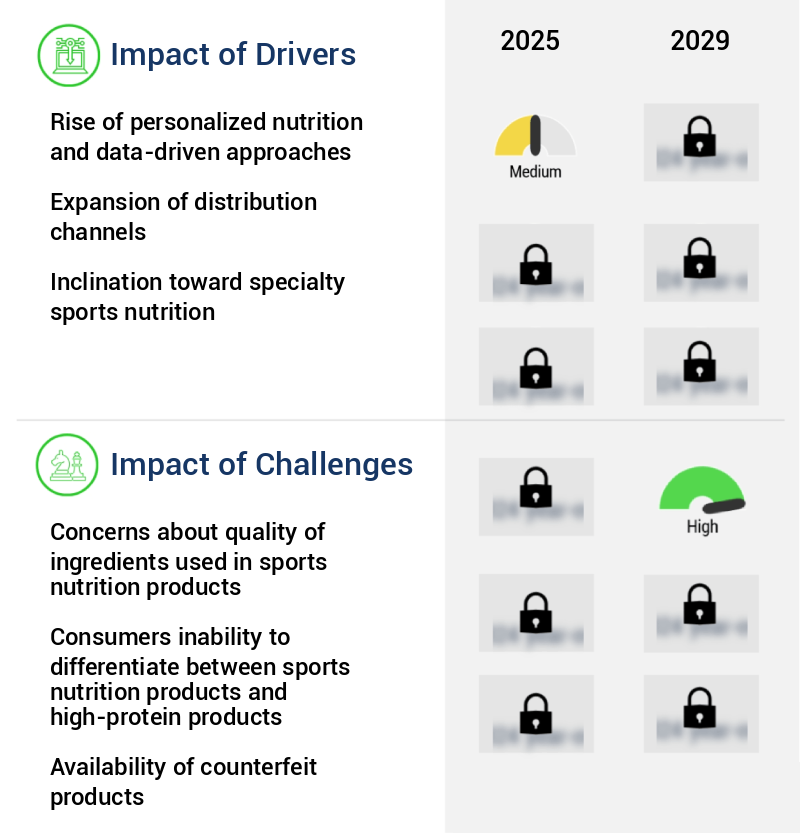
- The rise of personalized nutrition and data-driven approaches is the primary catalyst fueling market growth in this sector.
- In the realm of sports nutrition, personalization is a key trend shaping consumer behavior. By leveraging individual data such as genetics, body composition, and training metrics, athletes and fitness enthusiasts can unlock unique nutritional requirements. This data-driven approach enables the creation of customized protein blends, targeted supplement recommendations, and personalized meal plans. These tailored solutions optimize performance, recovery, and overall health, fostering a sense of control and ownership among consumers. The demand for proactive, personalized nutrition solutions is on the rise, as individuals seek to address their specific concerns and maximize the effectiveness of their sports nutrition investments.
- This shift towards personalization not only reduces the need for trial-and-error purchases but also bolsters user confidence in the efficacy of sports nutrition products. The ongoing evolution of data collection and analysis technologies continues to expand the possibilities for personalized sports nutrition, offering new opportunities for innovation and growth within this dynamic market.
What are the market trends shaping the Sports Nutrition Industry?
- The growing demand for plant-based sports nutrition represents a notable market trend. Plant-based sports nutrition is experiencing increasing popularity.
- The plant-based the market is experiencing significant growth due to the increasing popularity of plant-centric diets, sustainability concerns, and the demand for ethically sourced products. Consumers, including athletes and fitness enthusiasts, are turning to plant-derived protein sources like pea protein, hemp protein, and brown rice protein. This shift is driven by the environmental impact of food choices, as plant farming generally has a lower carbon footprint compared to animal agriculture. Plant-based sports nutrition caters to this trend, providing a sustainable and ethical alternative to traditional animal-derived protein sources.
- The adoption of plant-based diets, whether vegetarian, vegan, or flexitarian, has fueled the demand for plant-based protein options in the sports nutrition sector. This evolving market pattern highlights the importance of plant-based protein sources in catering to changing consumer preferences and values.
What challenges does the Sports Nutrition Industry face during its growth?
- The quality of ingredients used in sports nutrition products is a significant concern that poses a challenge to the industry's growth. This issue, which is of great importance to consumers seeking optimal performance and health benefits, necessitates rigorous scrutiny and transparency from manufacturers to ensure the authenticity and efficacy of their products.
- The market faces ongoing challenges due to concerns surrounding the use of additives and genetically modified organisms (GMOs) in its products. Consumers' increasing awareness of potential health risks has led to a growing preference for natural and organic alternatives. This shift in consumer behavior has resulted in a significant increase in demand for clean-label sports nutrition products. Moreover, the presence of banned substances, such as anabolic steroids and stimulants, in some sports nutrition products has negatively impacted the market. Despite stringent regulations, instances of contamination continue to emerge, causing distrust among consumers and potential health risks. Despite these challenges, the market remains dynamic and evolving.
- Manufacturers are responding to consumer demands by investing in research and development to create innovative, clean-label products. Additionally, the use of advanced technologies, such as DNA testing and blockchain traceability, is helping to ensure product integrity and transparency. In conclusion, the market is undergoing significant changes as consumers demand more natural, clean-label products and stricter regulations are enforced. Manufacturers must adapt to these trends to maintain consumer trust and ensure the long-term success of their businesses.
Exclusive Technavio Analysis on Customer Landscape
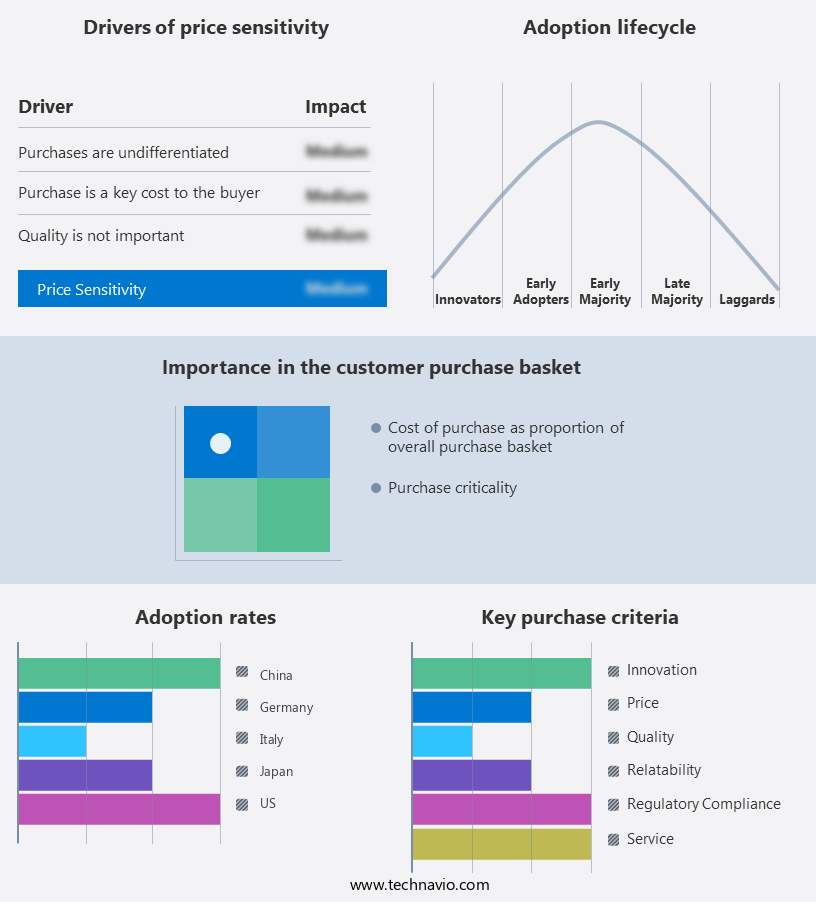
The sports nutrition market forecasting report includes the adoption lifecycle of the market, covering from the innovator’s stage to the laggard’s stage. It focuses on adoption rates in different regions based on penetration. Furthermore, the sports nutrition market report also includes key purchase criteria and drivers of price sensitivity to help companies evaluate and develop their market growth analysis strategies.
Customer Landscape of Sports Nutrition Industry
Competitive Landscape
Companies are implementing various strategies, such as strategic alliances, sports nutrition market forecast, partnerships, mergers and acquisitions, geographical expansion, and product/service launches, to enhance their presence in the industry.
Abbott Laboratories - Abbott's EAS Sports Nutrition brand provides a range of products, including EAS Lean 15 powder and bars, EAS Recovery powder, EAS Myoplex 30 bars, and EAS Myoplex Original shakes with Revigor. These offerings cater to various nutritional needs, enhancing athletic performance and aiding in recovery.
The industry research and growth report includes detailed analyses of the competitive landscape of the market and information about key companies, including:
- Abbott Laboratories
- Bodybuilding.com LLC
- Glanbia plc (Optimum Nutrition, BSN)
- GNC Holdings, Inc.
- Herbalife Nutrition Ltd.
- Iovate Health Sciences International Inc. (MuscleTech, Six Star)
- Maison Routin France
- Max Sports & Nutrition (Vitaleaf Technologies)
- Monster Beverage Corporation (Reign Total Body Fuel)
- MusclePharm Corporation
- Nutrabolt (Cellucor, C4 Energy)
- Quest Nutrition (Simply Good Foods Company)
- The Coca-Cola Company (Bodyarmor, fairlife protein shakes)
- The Nature's Bounty Co. (Pure Protein, Body Fortress)
- Ultimate Nutrition Inc.
- Universal Nutrition
- Vitaleaf Technologies
- VPX Sports (Bang Energy)
- Weider Global Nutrition
- Xtend (Nutrabolt)
Qualitative and quantitative analysis of companies has been conducted to help clients understand the wider business environment as well as the strengths and weaknesses of key industry players. Data is qualitatively analyzed to categorize companies as pure play, category-focused, industry-focused, and diversified; it is quantitatively analyzed to categorize companies as dominant, leading, strong, tentative, and weak.
Recent Development and News in Sports Nutrition Market
- In January 2024, Nestle's subsidiary, Gerber Scientific, launched a new line of sports nutrition products under the brand name "G-Force," catering to fitness enthusiasts and athletes. These products include ready-to-drink protein shakes, energy bars, and meal replacement powders (Source: Nestle Press Release).
- In March 2024, PepsiCo's subsidiary, Gatorade, announced a strategic partnership with the National Football League (NFL) to become the official sports fuel partner of the league. This collaboration included product promotion during NFL events and the development of NFL-branded Gatorade products (Source: PepsiCo Press Release).
- In April 2025, Amway, a global direct selling company, acquired Nutrilite, a leading brand in the market, for approximately USD1.1 billion. This acquisition expanded Amway's presence in the sports nutrition sector and strengthened its product offerings (Source: Amway Press Release).
- In May 2025, the European Commission approved the acquisition of H.J. Heinz Company by Kraft Foods Group, creating The Kraft Heinz Company. The combined entity, which will have a significant presence in the market through brands like Ovaltine and Mio Fit, is expected to generate annual synergies of USD1.5 billion (Source: European Commission Press Release).
Dive into Technavio’s robust research methodology, blending expert interviews, extensive data synthesis, and validated models for unparalleled Sports Nutrition Market insights. See full methodology.
|
Market Scope |
|
|
Report Coverage |
Details |
|
Page number |
247 |
|
Base year |
2024 |
|
Historic period |
2019-2023 |
|
Forecast period |
2025-2029 |
|
Growth momentum & CAGR |
Accelerate at a CAGR of 8.1% |
|
Market growth 2025-2029 |
USD 16127.1 million |
|
Market structure |
Fragmented |
|
YoY growth 2024-2025(%) |
7.5 |
|
Key countries |
US, Canada, Germany, UK, Italy, France, China, India, Japan, Brazil, Egypt, UAE, Oman, Argentina, KSA, UAE, Brazil, and Rest of World (ROW) |
|
Competitive landscape |
Leading Companies, Market Positioning of Companies, Competitive Strategies, and Industry Risks |
Research Analyst Overview
- The dynamic the market is characterized by continuous innovation and evolving consumer preferences. Carbohydrate metabolism plays a pivotal role, with nutrient timing gaining increasing attention for optimizing athletic performance. Dietary supplements, such as protein powder blends and carbohydrate sources, are popular choices for athletes seeking to enhance their training regimens. Digestive health is another significant focus, with the demand for sports bars and energy drinks growing due to their convenience and ability to provide essential nutrients during intense workouts. Creatine supplementation and strength training continue to be popular performance enhancement strategies, while electrolyte balance and hydration strategies are crucial for maintaining optimal body function during physical activity.
- Weight management and glycogen replenishment are essential aspects of sports nutrition, with protein synthesis and insulin sensitivity playing key roles in muscle growth and body composition. Non-essential amino acids, beta-hydroxy-beta-methylbutyrate (HMB), and various protein sources like whey protein isolate, casein protein, and soy protein are popular supplements used to support muscle hypertrophy and recovery. The market's ongoing evolution is driven by advancements in nutritional science and the growing understanding of the role of hormonal response, amino acid profiles, fat oxidation, and the gut microbiome in athletic performance. As a result, sports nutrition is a vibrant and ever-changing industry that caters to the diverse needs of athletes and fitness enthusiasts alike.
What are the Key Data Covered in this Sports Nutrition Market Research and Growth Report?
-
What is the expected growth of the Sports Nutrition Market between 2025 and 2029?
-
USD 16.13 billion, at a CAGR of 8.1%
-
-
What segmentation does the market report cover?
-
The report segmented by Product (Non-protein, Protein powder, Protein RTD, and Protein bar), Distribution Channel (Offline and Online), Raw Material (Animal derived, Plant-based, and Mixed), End-user (Athletes, Fitness enthusiasts, Bodybuilders, and Lifestyle users), Geography (North America, Europe, APAC, South America, and Middle East and Africa), Form (Powder, Capsules & Tablets, Ready-to-Drink (RTD), Bars, Gels, and Chews), and Application (Bodybuilding, Weightlifting, Strength Training, Endurance Sports, Team Sports, Athletic Performance, and Weight Management)
-
-
Which regions are analyzed in the report?
-
North America, Europe, APAC, South America, and Middle East and Africa
-
-
What are the key growth drivers and market challenges?
-
Rise of personalized nutrition and data-driven approaches, Concerns about quality of ingredients used in sports nutrition products
-
-
Who are the major players in the Sports Nutrition Market?
-
Key Companies Abbott Laboratories, Bodybuilding.com LLC, Glanbia plc (Optimum Nutrition, BSN), GNC Holdings, Inc., Herbalife Nutrition Ltd., Iovate Health Sciences International Inc. (MuscleTech, Six Star), Maison Routin France, Max Sports & Nutrition (Vitaleaf Technologies), Monster Beverage Corporation (Reign Total Body Fuel), MusclePharm Corporation, Nutrabolt (Cellucor, C4 Energy), Quest Nutrition (Simply Good Foods Company), The Coca-Cola Company (Bodyarmor, fairlife protein shakes), The Nature's Bounty Co. (Pure Protein, Body Fortress), Ultimate Nutrition Inc., Universal Nutrition, Vitaleaf Technologies, VPX Sports (Bang Energy), Weider Global Nutrition, and Xtend (Nutrabolt)
-
Market Research Insights
- The market encompasses a wide range of products and services designed to optimize athletic performance and support the unique nutritional needs of individuals engaging in regular exercise. Two key areas of focus within this market are the assessment of performance biomarkers and the evaluation of supplement efficacy. According to recent research, the global market value for sports nutrition supplements is projected to reach USD122.6 billion by 2027, representing a significant increase from the USD63.3 billion recorded in 2019. The relationship between exercise intensity and nutritional requirements is well-established. For instance, high-intensity workouts can lead to increased oxidative stress, which may negatively impact training volume and athletic performance.
- In response, athletes often turn to ergogenic aids, such as antioxidant supplements, to mitigate the effects of oxidative stress and enhance recovery. However, the efficacy of these supplements can vary greatly depending on individual factors like nutrient absorption and training periodization. Moreover, the importance of monitoring key performance indicators, such as maximal oxygen uptake (VO2 max), lactate threshold, and sleep quality, has become increasingly recognized in the sports nutrition landscape. By integrating kinematic analysis, biomechanical assessment, and metabolic rate measurements, athletes and coaches can make informed decisions regarding nutritional strategies and training plans to optimize athletic performance and minimize muscle damage.
- Nitrogen balance, muscle glycogen stores, and immune function are other essential nutritional considerations for athletes, as they directly impact training volume, recovery, and overall health. The ongoing quest for individualized nutrition and personalized training plans continues to drive innovation in the market, with a growing emphasis on the role of inflammation markers, leucine oxidation, and individual nutrient requirements in optimizing athletic performance.
We can help! Our analysts can customize this sports nutrition market research report to meet your requirements.
 RIA -
RIA - 
