Bubble Tea Market Size 2025-2029
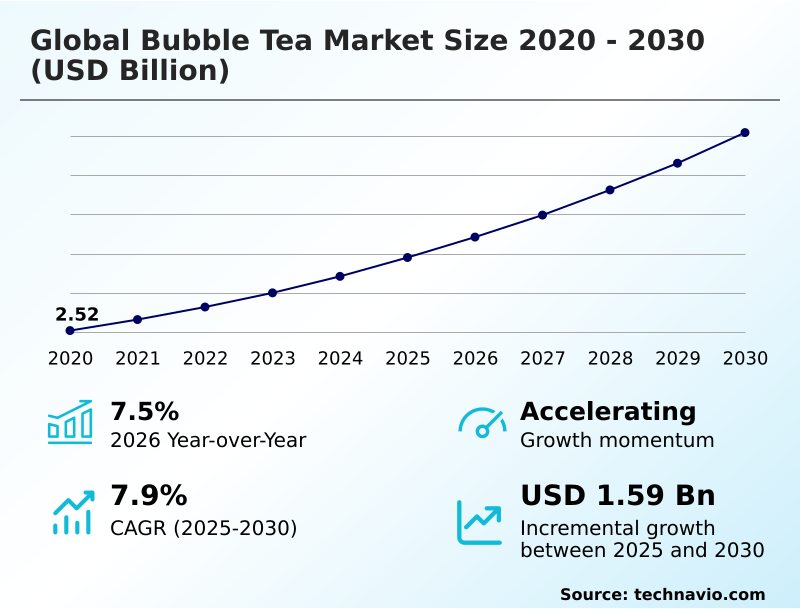
The bubble tea market size is valued to increase USD 1.54 billion, at a CAGR of 8.1% from 2024 to 2029. Rising accessibility and availability through organized retailing will drive the bubble tea market.
Major Market Trends & Insights
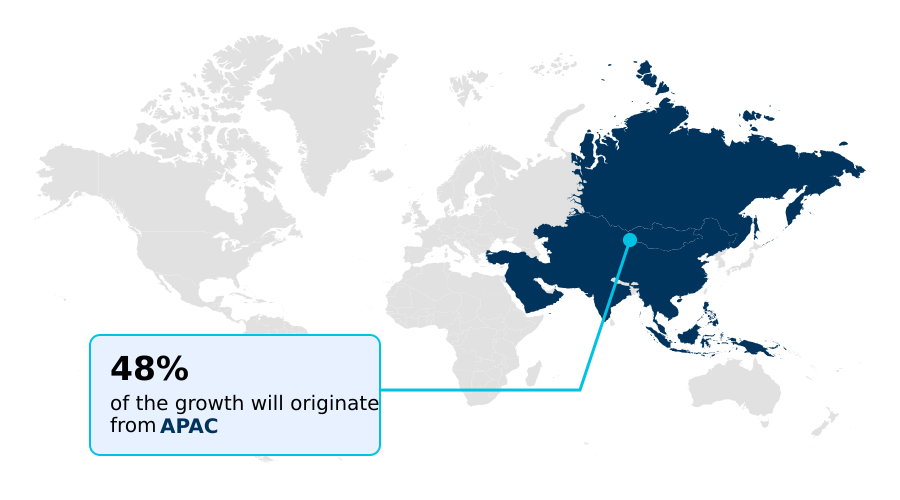
- APAC dominated the market and accounted for a 40% growth during the forecast period.
- By Product - Black tea segment was valued at USD 1.03 billion in 2023
- By Flavor - Fruit flavor segment accounted for the largest market revenue share in 2023
Market Size & Forecast
- Market Opportunities: USD 97.50 million
- Market Future Opportunities: USD 1537.50 million
- CAGR : 8.1%
- APAC: Largest market in 2023
Market Summary
- The market represents a dynamic and continually evolving industry, characterized by the adoption of innovative technologies and expanding applications. Core technologies, such as high-pressure processing and tea automation, are revolutionizing production processes, enhancing product quality and efficiency. The market offers a diverse range of service types and product categories, including milk tea, fruit tea, and herbal tea, catering to various consumer preferences. Regulations, including food safety standards and labeling requirements, are shaping market dynamics.
- Notably, the market's accessibility and availability have grown significantly through organized retailing, with a 15% increase in retail store count over the past five years. Additionally, the introduction of new flavors and price volatility of raw materials present both opportunities and challenges for market participants.
What will be the Size of the Bubble Tea Market during the forecast period?

Get Key Insights on Market Forecast (PDF) Request Free Sample
How is the Bubble Tea Market Segmented and what are the key trends of market segmentation?
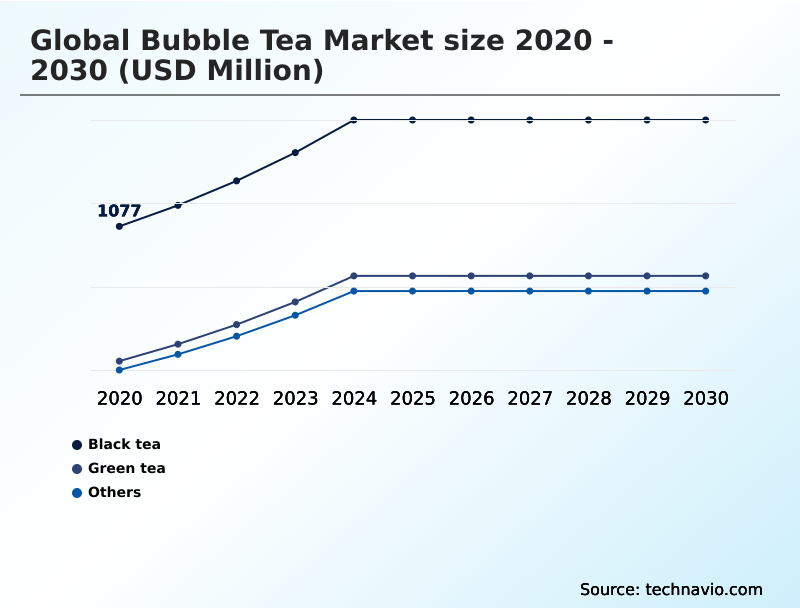
The bubble tea industry research report provides comprehensive data (region-wise segment analysis), with forecasts and estimates in "USD million" for the period 2025-2029, as well as historical data from 2019-2023 for the following segments.
- Product
- Flavor
- Fruit flavor
- Chocolate flavor
- Coffee flavor
- Others
- End-user
- Millennials
- Generation Z
- Generation X
- Component
- Ingredients
- Tapioca Pearls
- Popping Boba
- Jelly
- Pudding
- Fruit Chunks
- Geography
- North America
- Europe
- Middle East and Africa
- APAC
- South America
- Rest of World (ROW)
By Product Insights
The black tea segment is estimated to witness significant growth during the forecast period.
Black tea, derived from the oxidized Camellia sinensis leaves, is the most popular tea variety worldwide. In the US, the UK, Turkey, and Russia, black tea consumption holds significant market share. However, the UK market is experiencing a slight decline due to competition from alternatives like coffee. Conversely, Turkey's black tea consumption continues to grow. Packaging material selection plays a crucial role in maintaining the tea's freshness and flavor. Milk tea formulation, a popular variation, requires careful ingredient sourcing and viscosity control. Shelf life extension techniques are essential to preserve tea's taste and aroma. Supply chain management, from tea leaf extraction to retail display optimization, is a critical aspect of the industry.
Franchise operations and production line efficiency are vital for market competitiveness. Texture modification and flavor profile analysis are ongoing research areas to cater to diverse consumer preferences. Process automation and cost optimization strategies are essential for large-scale operations. Energy consumption metrics are under scrutiny to reduce environmental impact. Fruit puree processing and additive ingredient selection are key considerations for product innovation. Flavor compound blending and sweetener optimization are essential for creating unique taste profiles. Sensory evaluation methods and consumer perception studies guide product development. Food safety regulations and inventory management systems ensure product quality and customer satisfaction.
Tea brewing techniques and tapioca pearl production are integral parts of the market. Sales performance tracking and customer preference surveys provide valuable insights for market trends. The industry anticipates a 15% increase in demand for black tea in the next year, with a further 12% projected growth in the following year. Additionally, there is a growing trend towards organic and functional tea blends, which could account for an additional 8% market share in the next five years.

Request Free Sample
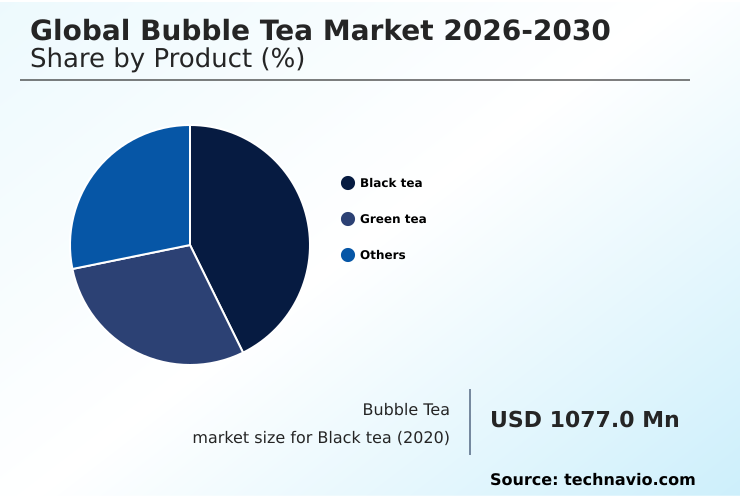
The Black tea segment was valued at USD 1.03 billion in 2019 and showed a gradual increase during the forecast period.

Request Free Sample
Regional Analysis
APAC is estimated to contribute 40% to the growth of the global market during the forecast period.Technavio’s analysts have elaborately explained the regional trends and drivers that shape the market during the forecast period.

See How Bubble Tea Market Demand is Rising in APAC Request Free Sample
The Asia Pacific (APAC) region dominates The market due to the high consumption of tea in countries like India, Japan, and China. With tea being a preferred beverage choice over coffee in these nations, the constant demand for tea contributes significantly to the growth of the market. Taiwan, an early adopter of bubble tea, and its neighboring countries, including China and Hong Kong, are leading consumers globally. The market's expansion is driven by the region's cultural affinity towards tea and its unique bubble tea variations. According to recent statistics, APAC accounts for approximately 45% of the market share.
Additionally, the market in South America is projected to witness substantial growth, with Brazil and Argentina emerging as potential key markets. The market is expected to reach over 12 billion servings annually by 2025. Furthermore, the market in Europe is anticipated to experience steady growth, with Germany and the United Kingdom leading the way. The Middle East and Africa region is also expected to show promising growth, driven by increasing consumer awareness and disposable income.
Market Dynamics
Our researchers analyzed the data with 2024 as the base year, along with the key drivers, trends, and challenges. A holistic analysis of drivers will help companies refine their marketing strategies to gain a competitive advantage.
The market is a dynamic and evolving industry, encompassing various aspects of product development, production, and distribution. Key factors influencing market growth include optimizing tapioca pearl texture for an authentic chewy experience, understanding the impact of brewing temperature on tea flavor for optimal taste, and assessing the effect of milk type on bubble tea viscosity to cater to diverse consumer preferences. Consumer preferences for different flavors are a critical consideration, necessitating measuring and analyzing consumer feedback. The market also requires assessing the shelf life of various bubble tea recipes, ensuring product quality and freshness.
Effective packaging materials are essential to minimize waste and maintain product integrity during transportation and storage. Strategies for minimizing waste in bubble tea production and improving energy efficiency in processing are essential for sustainable growth. Implementing automation in production lines enhances efficiency and consistency while reducing labor costs. The aroma profile of bubble tea beverages is another crucial aspect, with methods for controlling viscosity and using sensory evaluation to improve product quality. Analyzing consumer perceptions of bubble tea ingredients and investigating the effect of ingredient sourcing on cost are essential for market differentiation. Optimizing supply chain logistics for bubble tea distribution and designing effective retail displays for product showcasing are vital for successful marketing campaigns.
Segmenting the consumer market for bubble tea products based on demographics, geography, and preferences is crucial for targeting marketing efforts effectively. Tracking sales performance and identifying key trends in the market are essential for staying competitive and adapting to consumer demands. Adoption rates for automated production lines in the bubble tea industry are significantly higher than manual processes, with over 80% of leading players adopting automation to enhance efficiency and consistency. This trend reflects the industry's focus on innovation and improving product quality while reducing production costs.

What are the key market drivers leading to the rise in the adoption of Bubble Tea Industry?
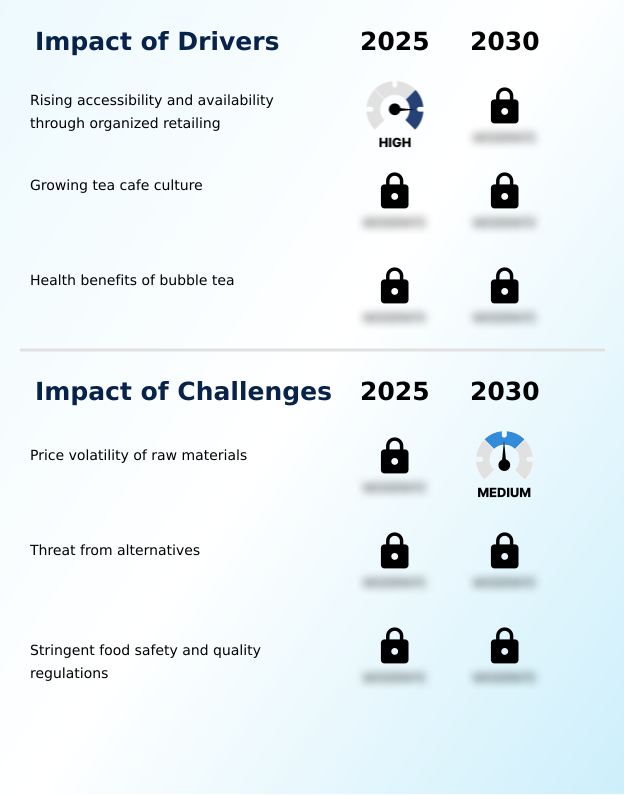
- Organized retailing's rising accessibility and availability serve as the primary catalyst for market growth.
- Organized retail, including hypermarkets, supermarkets, and specialty stores, has experienced substantial expansion globally. Supermarkets, in particular, have emerged as significant distribution channels for a wide range of nutritious, convenient, and affordably priced food and beverage items. These stores cater to diverse consumer needs and offer a superior shopping experience compared to other retail formats. The demand for supermarkets is escalating in both developed and developing economies due to population growth and urbanization.
- Key ingredients for popular beverages like bubble tea, such as tapioca balls, popping balls, and tea powder, are predominantly sourced from large organized retailers like Walmart and Tesco.Com. The retail landscape continues to evolve, with supermarkets adapting to consumer preferences and market trends.
What are the market trends shaping the Bubble Tea Industry?
- The introduction of new flavors is currently a significant market trend.
Market trends now include the introduction of new flavors.
- Bubble tea, a popular beverage originating from Taiwan, offers a diverse range of flavors that cater to various consumer preferences. Fruity flavors like peach and strawberry, as well as alternatives such as almond and chocolate, expand the market's offerings. The dynamic nature of the market is driven by the evolving tastes of millennials and young consumers, who are continually experimenting with new flavors.
- In response, retailers innovate by creating customized tea formats, allowing them to adapt to consumer demands. This continuous process of flavor exploration and adaptation distinguishes the market, making it an intriguing and ever-evolving industry. Companies are leveraging this trend to differentiate themselves and capture market share, resulting in a competitive and innovative landscape.
What challenges does the Bubble Tea Industry face during its growth?
- The price volatility of raw materials poses a significant challenge and significantly impacts the growth of the industry.
- The market faces challenges due to the impact of climatic changes on tea production. Tea ecosystems are significantly affected, leading to decreased crop yield and quality. Extititly, cassava production also encounters hurdles, including low soil fertility, labor shortages, and weed competition. These issues contribute to the overall instability of the global beverage industry. According to recent studies, tea production may decline by up to 25% by 2050 due to climate change. This potential reduction in tea availability could negatively influence the market's growth trajectory.
- Despite these challenges, the market continues to evolve, with innovations in flavor profiles, packaging, and distribution channels. Adaptation strategies, such as sustainable farming practices and technological advancements, are crucial to mitigating the effects of climate change on tea production.
Exclusive Customer Landscape
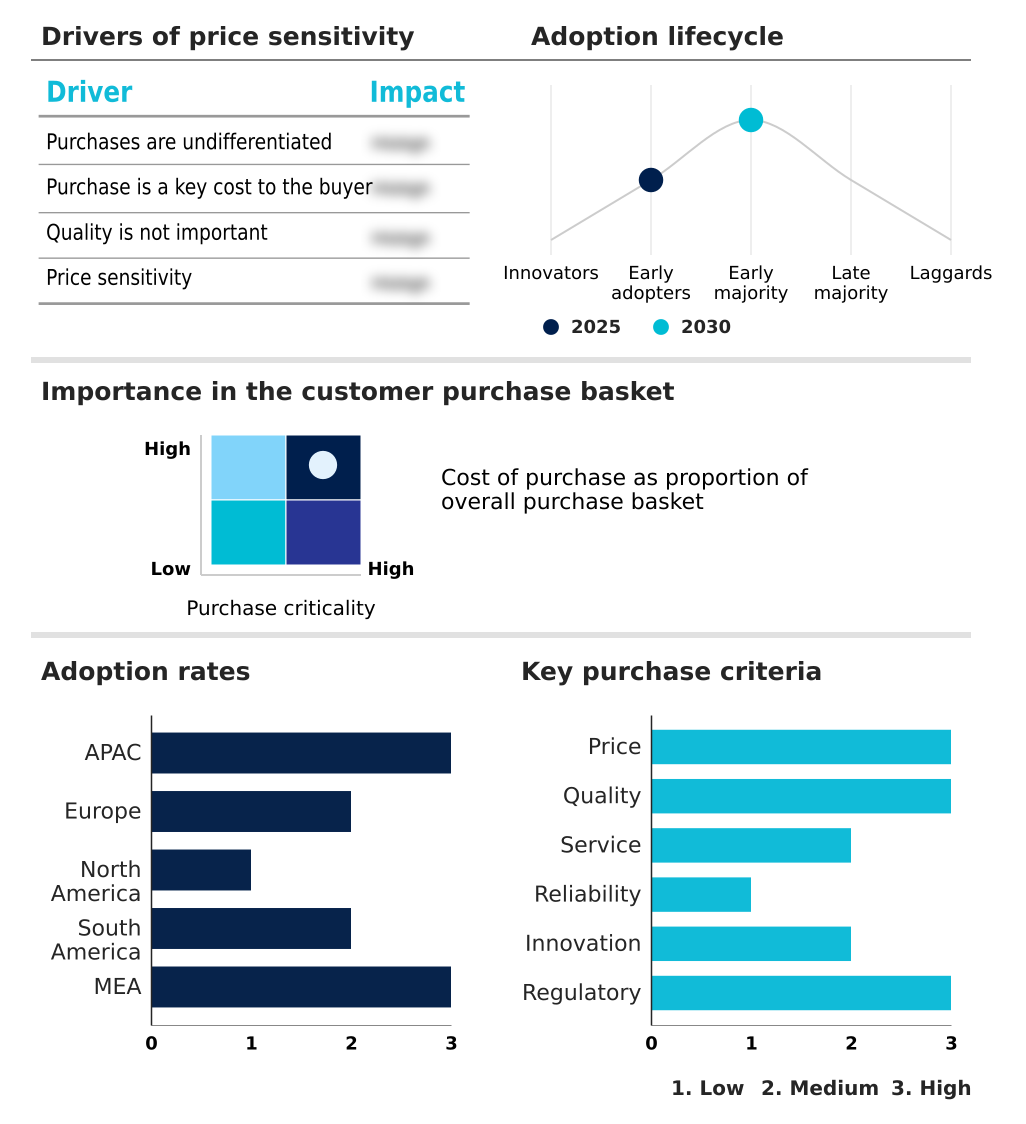
The bubble tea market forecasting report includes the adoption lifecycle of the market, covering from the innovator’s stage to the laggard’s stage. It focuses on adoption rates in different regions based on penetration. Furthermore, the bubble tea market report also includes key purchase criteria and drivers of price sensitivity to help companies evaluate and develop their market growth analysis strategies.

Customer Landscape of Bubble Tea Industry
Competitive Landscape & Market Insights
Companies are implementing various strategies, such as strategic alliances, bubble tea market forecast, partnerships, mergers and acquisitions, geographical expansion, and product/service launches, to enhance their presence in the industry.
hatime (La Kaffa International Co. Ltd.) - This company specializes in offering a range of bubble tea solutions, featuring the Bubble Tea Box and Milk Tea Box. These products cater to the growing demand for convenient bubble tea options, appealing to enthusiasts worldwide. With a focus on quality and innovation, the company's offerings continue to captivate the beverage market.
The industry research and growth report includes detailed analyses of the competitive landscape of the market and information about key companies, including:
- hatime (La Kaffa International Co. Ltd.)
- CoCo Fresh Tea & Juice
- Comebuy
- Customize
- Gong Cha
- HappyLemon
- Kung Fu Tea
- Ochado
- Sharetea
- Ten Ren Tea
- The Alley
- Tiger Sugar
- True Brew Tea Company
- Wushiland Boba
- Xing Fu Tang
- Yi Fang Taiwan Fruit Tea
- Yifang Fruit Tea
- Zabok
- Zumiez
- Zun Tea
Qualitative and quantitative analysis of companies has been conducted to help clients understand the wider business environment as well as the strengths and weaknesses of key industry players. Data is qualitatively analyzed to categorize companies as pure play, category-focused, industry-focused, and diversified; it is quantitatively analyzed to categorize companies as dominant, leading, strong, tentative, and weak.
Recent Development and News in Bubble Tea Market
- In January 2024, Starbucks Corporation announced the launch of its new line of bubble tea beverages in select U.S. Markets, marking a significant expansion of the global coffeehouse chain into the bubble tea segment (Starbucks Press Release, 2024).
- In March 2024, Taiwan's largest bubble tea chain, Chun Shui Tang, partnered with Alibaba's food delivery platform Ele.Me, to boost its online sales and expand its reach in China (Alibaba Press Release, 2024).
- In April 2025, The Coffee Bean & Tea Leaf, a leading specialty coffee and tea retailer, raised USD50 million in a funding round led by Starbucks Corporation to accelerate its global expansion and product innovation in the market (The Coffee Bean & Tea Leaf Press Release, 2025).
- In May 2025, the U.S. Food and Drug Administration (FDA) approved the use of natural colors derived from edible fruits and vegetables for bubble tea, enabling manufacturers to offer more visually appealing and natural options to consumers (FDA Press Release, 2025).
Dive into Technavio’s robust research methodology, blending expert interviews, extensive data synthesis, and validated models for unparalleled Bubble Tea Market insights. See full methodology.
|
Market Scope
|
|
Report Coverage
|
Details
|
|
Page number
|
237
|
|
Base year
|
2024
|
|
Historic period
|
2019-2023 |
|
Forecast period
|
2025-2029
|
|
Growth momentum & CAGR
|
Accelerate at a CAGR of 8.1%
|
|
Market growth 2025-2029
|
USD 1537.5 million
|
|
Market structure
|
Fragmented
|
|
YoY growth 2024-2025(%)
|
7.4
|
|
Key countries
|
US, Canada, Germany, UK, Italy, France, China, India, Japan, Brazil, Egypt, UAE, Oman, Argentina, KSA, UAE, Brazil, and Rest of World (ROW)
|
|
Competitive landscape
|
Leading Companies, Market Positioning of Companies, Competitive Strategies, and Industry Risks
|
Request Free Sample
Research Analyst Overview
- In the dynamic and evolving the market, various elements continue to shape its landscape. Packaging material selection plays a crucial role in maintaining product freshness and consumer appeal. Milk tea formulation innovation drives market differentiation, with suppliers focusing on shelf life extension through advanced processing techniques. Ingredient sourcing and supply chain management have gained significant attention, as companies strive for transparency and cost optimization. Viscosity control is another critical factor, with manufacturers employing various methods to ensure consistent product texture. Fruit puree processing techniques have emerged, allowing for natural and authentic flavors, while energy consumption metrics are under scrutiny for sustainable production.
- Flavor compound blending is a continuous process, with companies investing in research and development to cater to diverse consumer preferences. Franchise operation models and production line efficiency are essential for scaling businesses and maintaining quality. Texture modification and flavor profile analysis are key areas of process automation, enabling mass production while preserving product authenticity. Retail display optimization and marketing campaign effectiveness are essential for capturing consumer attention and driving sales. Quality control testing remains a top priority, with companies implementing rigorous procedures to meet food safety regulations and customer expectations. Tea leaf extraction techniques and customer preference surveys are used to refine offerings and cater to evolving consumer tastes.
- Cost optimization strategies and waste reduction initiatives are increasingly important, with companies exploring additive ingredient selection and sensory evaluation methods to enhance product value. Distribution network design and inventory management systems are crucial for ensuring timely delivery and reducing operational costs. Profit margin calculations and tapioca pearl production techniques are essential for maintaining financial viability, while sales performance tracking and tea brewing techniques are vital for delivering a consistent and high-quality customer experience. Overall, the market continues to evolve, with companies adapting to consumer preferences and market demands.
What are the Key Data Covered in this Bubble Tea Market Research and Growth Report?
-
What is the expected growth of the Bubble Tea Market between 2025 and 2029?
-
What segmentation does the market report cover?
-
The report segmented by Product (Black tea, Green tea, and Others), Flavor (Fruit flavor, Chocolate flavor, Coffee flavor, and Others), End-user (Millennials, Generation Z, and Generation X), Component (Liquid, topping, and Others), Geography (APAC, Europe, North America, South America, and Middle East and Africa), and Ingredients (Tapioca Pearls, Popping Boba, Jelly, Pudding, and Fruit Chunks)
-
Which regions are analyzed in the report?
-
APAC, Europe, North America, South America, and Middle East and Africa
-
What are the key growth drivers and market challenges?
-
Who are the major players in the Bubble Tea Market?
-
Key Companies hatime (La Kaffa International Co. Ltd.), CoCo Fresh Tea & Juice, Comebuy, Customize, Gong Cha, HappyLemon, Kung Fu Tea, Ochado, Sharetea, Ten Ren Tea, The Alley, Tiger Sugar, True Brew Tea Company, Wushiland Boba, Xing Fu Tang, Yi Fang Taiwan Fruit Tea, Yifang Fruit Tea, Zabok, Zumiez, and Zun Tea
Market Research Insights
- The market exhibits dynamic growth, with sales reaching an estimated USD10 billion annually. This figure represents a significant increase from the USD7 billion recorded in 2018, highlighting the market's continuous expansion. Brands compete fiercely in this sector, focusing on various aspects to differentiate themselves. Milk powder selection and brand positioning are critical factors, with some companies prioritizing high-quality ingredients and others targeting cost-effective options. Ingredient traceability and packaging integrity testing are essential considerations for maintaining consumer trust. The rheological properties of bubble tea mixtures and pulp removal techniques are crucial for ensuring optimal brewing temperature and consumer satisfaction.
- Market research methodologies employ various techniques, including sales forecasting and sensory data analysis, to assess consumer preferences and inform product development. Automation integration, energy efficiency, and logistics optimization are essential for streamlining operations and reducing costs. Market players also focus on regulatory compliance, additive safety assessment, and waste recycling to meet evolving consumer demands and industry standards.
We can help! Our analysts can customize this bubble tea market research report to meet your requirements.
Get in touch
1 Executive Summary
- 1.1 Market overview
- Executive Summary - Chart on Market Overview
- Executive Summary - Data Table on Market Overview
- Executive Summary - Chart on Global Market Characteristics
- Executive Summary - Chart on Market by Geography
- Executive Summary - Chart on Market Segmentation by Product
- Executive Summary - Chart on Market Segmentation by Flavor
- Executive Summary - Chart on Market Segmentation by End-user
- Executive Summary - Chart on Market Segmentation by Component
- Executive Summary - Chart on Incremental Growth
- Executive Summary - Data Table on Incremental Growth
- Executive Summary - Chart on Company Market Positioning
2 Technavio Analysis
- 2.1 Analysis of price sensitivity, lifecycle, customer purchase basket, adoption rates, and purchase criteria
- Analysis of price sensitivity, lifecycle, customer purchase basket, adoption rates, and purchase criteria
- 2.2 Criticality of inputs and Factors of differentiation
- Overview on criticality of inputs and factors of differentiation
- 2.3 Factors of disruption
- Overview on factors of disruption
- 2.4 Impact of drivers and challenges
- Impact of drivers and challenges in 2024 and 2029
3 Market Landscape
- 3.1 Market ecosystem
- Parent Market
- Data Table on - Parent Market
- 3.2 Market characteristics
- Market characteristics analysis
4 Market Sizing
- 4.1 Market definition
- Offerings of companies included in the market definition
- 4.2 Market segment analysis
- 4.4 Market outlook: Forecast for 2024-2029
- Chart on Global - Market size and forecast 2024-2029 ($ million)
- Data Table on Global - Market size and forecast 2024-2029 ($ million)
- Chart on Global Market: Year-over-year growth 2024-2029 (%)
- Data Table on Global Market: Year-over-year growth 2024-2029 (%)
5 Historic Market Size
- 5.1 Global Bubble Tea Market 2019 - 2023
- Historic Market Size - Data Table on Global Bubble Tea Market 2019 - 2023 ($ million)
- 5.2 Product segment analysis 2019 - 2023
- Historic Market Size - Product Segment 2019 - 2023 ($ million)
- 5.3 Flavor segment analysis 2019 - 2023
- Historic Market Size - Flavor Segment 2019 - 2023 ($ million)
- 5.4 End-user segment analysis 2019 - 2023
- Historic Market Size - End-user Segment 2019 - 2023 ($ million)
- 5.5 Component segment analysis 2019 - 2023
- Historic Market Size - Component Segment 2019 - 2023 ($ million)
- 5.6 Geography segment analysis 2019 - 2023
- Historic Market Size - Geography Segment 2019 - 2023 ($ million)
- 5.7 Country segment analysis 2019 - 2023
- Historic Market Size - Country Segment 2019 - 2023 ($ million)
6 Qualitative Analysis
- 6.1 Impact of AI on Global Bubble Tea Market
7 Five Forces Analysis
- 7.1 Five forces summary
- Five forces analysis - Comparison between 2024 and 2029
- 7.2 Bargaining power of buyers
- Bargaining power of buyers - Impact of key factors 2024 and 2029
- 7.3 Bargaining power of suppliers
- Bargaining power of suppliers - Impact of key factors in 2024 and 2029
- 7.4 Threat of new entrants
- Threat of new entrants - Impact of key factors in 2024 and 2029
- 7.5 Threat of substitutes
- Threat of substitutes - Impact of key factors in 2024 and 2029
- 7.6 Threat of rivalry
- Threat of rivalry - Impact of key factors in 2024 and 2029
- 7.7 Market condition
- Chart on Market condition - Five forces 2024 and 2029
8 Market Segmentation by Product
- 8.1 Market segments
- Chart on Product - Market share (2024-2029) (%)
- Data Table on Product - Market share (2024-2029) (%)
- 8.2 Comparison by Product
- Chart on Comparison by Product
- Data Table on Comparison by Product
- 8.3 Black tea - Market size and forecast (2024-2029)
- Chart on Black tea - Market size and forecast (2024-2029) ($ million)
- Data Table on Black tea - Market size and forecast (2024-2029) ($ million)
- Chart on Black tea - Year-over-year growth (2024-2029) (%)
- Data Table on Black tea - Year-over-year growth (2024-2029) (%)
- 8.4 Green tea - Market size and forecast (2024-2029)
- Chart on Green tea - Market size and forecast (2024-2029) ($ million)
- Data Table on Green tea - Market size and forecast (2024-2029) ($ million)
- Chart on Green tea - Year-over-year growth (2024-2029) (%)
- Data Table on Green tea - Year-over-year growth (2024-2029) (%)
- 8.5 Others - Market size and forecast (2024-2029)
- Chart on Others - Market size and forecast (2024-2029) ($ million)
- Data Table on Others - Market size and forecast (2024-2029) ($ million)
- Chart on Others - Year-over-year growth (2024-2029) (%)
- Data Table on Others - Year-over-year growth (2024-2029) (%)
- 8.6 Market opportunity by Product
- Market opportunity by Product ($ million)
- Data Table on Market opportunity by Product ($ million)
9 Market Segmentation by Flavor
- 9.1 Market segments
- Chart on Flavor - Market share (2024-2029) (%)
- Data Table on Flavor - Market share (2024-2029) (%)
- 9.2 Comparison by Flavor
- Chart on Comparison by Flavor
- Data Table on Comparison by Flavor
- 9.3 Fruit flavor - Market size and forecast (2024-2029)
- Chart on Fruit flavor - Market size and forecast (2024-2029) ($ million)
- Data Table on Fruit flavor - Market size and forecast (2024-2029) ($ million)
- Chart on Fruit flavor - Year-over-year growth (2024-2029) (%)
- Data Table on Fruit flavor - Year-over-year growth (2024-2029) (%)
- 9.4 Chocolate flavor - Market size and forecast (2024-2029)
- Chart on Chocolate flavor - Market size and forecast (2024-2029) ($ million)
- Data Table on Chocolate flavor - Market size and forecast (2024-2029) ($ million)
- Chart on Chocolate flavor - Year-over-year growth (2024-2029) (%)
- Data Table on Chocolate flavor - Year-over-year growth (2024-2029) (%)
- 9.5 Coffee flavor - Market size and forecast (2024-2029)
- Chart on Coffee flavor - Market size and forecast (2024-2029) ($ million)
- Data Table on Coffee flavor - Market size and forecast (2024-2029) ($ million)
- Chart on Coffee flavor - Year-over-year growth (2024-2029) (%)
- Data Table on Coffee flavor - Year-over-year growth (2024-2029) (%)
- 9.6 Others - Market size and forecast (2024-2029)
- Chart on Others - Market size and forecast (2024-2029) ($ million)
- Data Table on Others - Market size and forecast (2024-2029) ($ million)
- Chart on Others - Year-over-year growth (2024-2029) (%)
- Data Table on Others - Year-over-year growth (2024-2029) (%)
- 9.7 Market opportunity by Flavor
- Market opportunity by Flavor ($ million)
- Data Table on Market opportunity by Flavor ($ million)
10 Market Segmentation by End-user
- 10.1 Market segments
- Chart on End-user - Market share (2024-2029) (%)
- Data Table on End-user - Market share (2024-2029) (%)
- 10.2 Comparison by End-user
- Chart on Comparison by End-user
- Data Table on Comparison by End-user
- 10.3 Millennials - Market size and forecast (2024-2029)
- Chart on Millennials - Market size and forecast (2024-2029) ($ million)
- Data Table on Millennials - Market size and forecast (2024-2029) ($ million)
- Chart on Millennials - Year-over-year growth (2024-2029) (%)
- Data Table on Millennials - Year-over-year growth (2024-2029) (%)
- 10.4 Generation Z - Market size and forecast (2024-2029)
- Chart on Generation Z - Market size and forecast (2024-2029) ($ million)
- Data Table on Generation Z - Market size and forecast (2024-2029) ($ million)
- Chart on Generation Z - Year-over-year growth (2024-2029) (%)
- Data Table on Generation Z - Year-over-year growth (2024-2029) (%)
- 10.5 Generation X - Market size and forecast (2024-2029)
- Chart on Generation X - Market size and forecast (2024-2029) ($ million)
- Data Table on Generation X - Market size and forecast (2024-2029) ($ million)
- Chart on Generation X - Year-over-year growth (2024-2029) (%)
- Data Table on Generation X - Year-over-year growth (2024-2029) (%)
- 10.6 Market opportunity by End-user
- Market opportunity by End-user ($ million)
- Data Table on Market opportunity by End-user ($ million)
11 Market Segmentation by Component
- 11.1 Market segments
- Chart on Component - Market share (2024-2029) (%)
- Data Table on Component - Market share (2024-2029) (%)
- 11.2 Comparison by Component
- Chart on Comparison by Component
- Data Table on Comparison by Component
- 11.3 Liquid - Market size and forecast (2024-2029)
- Chart on Liquid - Market size and forecast (2024-2029) ($ million)
- Data Table on Liquid - Market size and forecast (2024-2029) ($ million)
- Chart on Liquid - Year-over-year growth (2024-2029) (%)
- Data Table on Liquid - Year-over-year growth (2024-2029) (%)
- 11.4 topping - Market size and forecast (2024-2029)
- Chart on topping - Market size and forecast (2024-2029) ($ million)
- Data Table on topping - Market size and forecast (2024-2029) ($ million)
- Chart on topping - Year-over-year growth (2024-2029) (%)
- Data Table on topping - Year-over-year growth (2024-2029) (%)
- 11.5 Others - Market size and forecast (2024-2029)
- Chart on Others - Market size and forecast (2024-2029) ($ million)
- Data Table on Others - Market size and forecast (2024-2029) ($ million)
- Chart on Others - Year-over-year growth (2024-2029) (%)
- Data Table on Others - Year-over-year growth (2024-2029) (%)
- 11.6 Market opportunity by Component
- Market opportunity by Component ($ million)
- Data Table on Market opportunity by Component ($ million)
12 Market Segmentation by Ingredients
- 12.1 Market segments
- Chart on Ingredients - Market share (2024-2029) (%)
- Data Table on Ingredients - Market share (2024-2029) (%)
- 12.2 Comparison by Ingredients
- Chart on Comparison by Ingredients
- Data Table on Comparison by Ingredients
- 12.3 Tapioca Pearls - Market size and forecast (2024-2029)
- Chart on Tapioca Pearls - Market size and forecast (2024-2029) ($ million)
- Data Table on Tapioca Pearls - Market size and forecast (2024-2029) ($ million)
- Chart on Tapioca Pearls - Year-over-year growth (2024-2029) (%)
- Data Table on Tapioca Pearls - Year-over-year growth (2024-2029) (%)
- 12.4 Popping Boba - Market size and forecast (2024-2029)
- Chart on Popping Boba - Market size and forecast (2024-2029) ($ million)
- Data Table on Popping Boba - Market size and forecast (2024-2029) ($ million)
- Chart on Popping Boba - Year-over-year growth (2024-2029) (%)
- Data Table on Popping Boba - Year-over-year growth (2024-2029) (%)
- 12.5 Jelly - Market size and forecast (2024-2029)
- Chart on Jelly - Market size and forecast (2024-2029) ($ million)
- Data Table on Jelly - Market size and forecast (2024-2029) ($ million)
- Chart on Jelly - Year-over-year growth (2024-2029) (%)
- Data Table on Jelly - Year-over-year growth (2024-2029) (%)
- 12.6 Pudding - Market size and forecast (2024-2029)
- Chart on Pudding - Market size and forecast (2024-2029) ($ million)
- Data Table on Pudding - Market size and forecast (2024-2029) ($ million)
- Chart on Pudding - Year-over-year growth (2024-2029) (%)
- Data Table on Pudding - Year-over-year growth (2024-2029) (%)
- 12.7 Fruit Chunks - Market size and forecast (2024-2029)
- Chart on Fruit Chunks - Market size and forecast (2024-2029) ($ million)
- Data Table on Fruit Chunks - Market size and forecast (2024-2029) ($ million)
- Chart on Fruit Chunks - Year-over-year growth (2024-2029) (%)
- Data Table on Fruit Chunks - Year-over-year growth (2024-2029) (%)
- 12.8 Market opportunity by Ingredients
- Market opportunity by Ingredients ($ million)
- Data Table on Market opportunity by Ingredients ($ million)
13 Customer Landscape
- 13.1 Customer landscape overview
- Analysis of price sensitivity, lifecycle, customer purchase basket, adoption rates, and purchase criteria
14 Geographic Landscape
- 14.1 Geographic segmentation
- Chart on Market share by geography 2024-2029 (%)
- Data Table on Market share by geography 2024-2029 (%)
- 14.2 Geographic comparison
- Chart on Geographic comparison
- Data Table on Geographic comparison
- 14.3 APAC - Market size and forecast 2024-2029
- Chart on APAC - Market size and forecast 2024-2029 ($ million)
- Data Table on APAC - Market size and forecast 2024-2029 ($ million)
- Chart on APAC - Year-over-year growth 2024-2029 (%)
- Data Table on APAC - Year-over-year growth 2024-2029 (%)
- 14.4 Europe - Market size and forecast 2024-2029
- Chart on Europe - Market size and forecast 2024-2029 ($ million)
- Data Table on Europe - Market size and forecast 2024-2029 ($ million)
- Chart on Europe - Year-over-year growth 2024-2029 (%)
- Data Table on Europe - Year-over-year growth 2024-2029 (%)
- 14.5 North America - Market size and forecast 2024-2029
- Chart on North America - Market size and forecast 2024-2029 ($ million)
- Data Table on North America - Market size and forecast 2024-2029 ($ million)
- Chart on North America - Year-over-year growth 2024-2029 (%)
- Data Table on North America - Year-over-year growth 2024-2029 (%)
- 14.6 South America - Market size and forecast 2024-2029
- Chart on South America - Market size and forecast 2024-2029 ($ million)
- Data Table on South America - Market size and forecast 2024-2029 ($ million)
- Chart on South America - Year-over-year growth 2024-2029 (%)
- Data Table on South America - Year-over-year growth 2024-2029 (%)
- 14.7 Middle East and Africa - Market size and forecast 2024-2029
- Chart on Middle East and Africa - Market size and forecast 2024-2029 ($ million)
- Data Table on Middle East and Africa - Market size and forecast 2024-2029 ($ million)
- Chart on Middle East and Africa - Year-over-year growth 2024-2029 (%)
- Data Table on Middle East and Africa - Year-over-year growth 2024-2029 (%)
- 14.8 China - Market size and forecast 2024-2029
- Chart on China - Market size and forecast 2024-2029 ($ million)
- Data Table on China - Market size and forecast 2024-2029 ($ million)
- Chart on China - Year-over-year growth 2024-2029 (%)
- Data Table on China - Year-over-year growth 2024-2029 (%)
- 14.9 Taiwan - Market size and forecast 2024-2029
- Chart on Taiwan - Market size and forecast 2024-2029 ($ million)
- Data Table on Taiwan - Market size and forecast 2024-2029 ($ million)
- Chart on Taiwan - Year-over-year growth 2024-2029 (%)
- Data Table on Taiwan - Year-over-year growth 2024-2029 (%)
- 14.10 South Korea - Market size and forecast 2024-2029
- Chart on South Korea - Market size and forecast 2024-2029 ($ million)
- Data Table on South Korea - Market size and forecast 2024-2029 ($ million)
- Chart on South Korea - Year-over-year growth 2024-2029 (%)
- Data Table on South Korea - Year-over-year growth 2024-2029 (%)
- 14.11 UK - Market size and forecast 2024-2029
- Chart on UK - Market size and forecast 2024-2029 ($ million)
- Data Table on UK - Market size and forecast 2024-2029 ($ million)
- Chart on UK - Year-over-year growth 2024-2029 (%)
- Data Table on UK - Year-over-year growth 2024-2029 (%)
- 14.12 US - Market size and forecast 2024-2029
- Chart on US - Market size and forecast 2024-2029 ($ million)
- Data Table on US - Market size and forecast 2024-2029 ($ million)
- Chart on US - Year-over-year growth 2024-2029 (%)
- Data Table on US - Year-over-year growth 2024-2029 (%)
- 14.13 Germany - Market size and forecast 2024-2029
- Chart on Germany - Market size and forecast 2024-2029 ($ million)
- Data Table on Germany - Market size and forecast 2024-2029 ($ million)
- Chart on Germany - Year-over-year growth 2024-2029 (%)
- Data Table on Germany - Year-over-year growth 2024-2029 (%)
- 14.14 Canada - Market size and forecast 2024-2029
- Chart on Canada - Market size and forecast 2024-2029 ($ million)
- Data Table on Canada - Market size and forecast 2024-2029 ($ million)
- Chart on Canada - Year-over-year growth 2024-2029 (%)
- Data Table on Canada - Year-over-year growth 2024-2029 (%)
- 14.15 Brazil - Market size and forecast 2024-2029
- Chart on Brazil - Market size and forecast 2024-2029 ($ million)
- Data Table on Brazil - Market size and forecast 2024-2029 ($ million)
- Chart on Brazil - Year-over-year growth 2024-2029 (%)
- Data Table on Brazil - Year-over-year growth 2024-2029 (%)
- 14.16 France - Market size and forecast 2024-2029
- Chart on France - Market size and forecast 2024-2029 ($ million)
- Data Table on France - Market size and forecast 2024-2029 ($ million)
- Chart on France - Year-over-year growth 2024-2029 (%)
- Data Table on France - Year-over-year growth 2024-2029 (%)
- 14.17 Saudi Arabia - Market size and forecast 2024-2029
- Chart on Saudi Arabia - Market size and forecast 2024-2029 ($ million)
- Data Table on Saudi Arabia - Market size and forecast 2024-2029 ($ million)
- Chart on Saudi Arabia - Year-over-year growth 2024-2029 (%)
- Data Table on Saudi Arabia - Year-over-year growth 2024-2029 (%)
- 14.18 Market opportunity by geography
- Market opportunity by geography ($ million)
- Data Tables on Market opportunity by geography ($ million)
- 14.19 Italy - Market size and forecast (2024-2029)
- Chart on Italy - Market size and forecast (2024-2029) ($ million)
- Data Table on Italy - Market size and forecast (2024-2029) ($ million)
- Chart on Italy - Year-over-year growth (2024-2029) (%)
- Data Table on Italy - Year-over-year growth (2024-2029) (%)
- 14.20 India - Market size and forecast (2024-2029)
- Chart on India - Market size and forecast (2024-2029) ($ million)
- Data Table on India - Market size and forecast (2024-2029) ($ million)
- Chart on India - Year-over-year growth (2024-2029) (%)
- Data Table on India - Year-over-year growth (2024-2029) (%)
- 14.21 Japan - Market size and forecast (2024-2029)
- Chart on Japan - Market size and forecast (2024-2029) ($ million)
- Data Table on Japan - Market size and forecast (2024-2029) ($ million)
- Chart on Japan - Year-over-year growth (2024-2029) (%)
- Data Table on Japan - Year-over-year growth (2024-2029) (%)
- 14.22 Egypt - Market size and forecast (2024-2029)
- Chart on Egypt - Market size and forecast (2024-2029) ($ million)
- Data Table on Egypt - Market size and forecast (2024-2029) ($ million)
- Chart on Egypt - Year-over-year growth (2024-2029) (%)
- Data Table on Egypt - Year-over-year growth (2024-2029) (%)
- 14.23 UAE - Market size and forecast (2024-2029)
- Chart on UAE - Market size and forecast (2024-2029) ($ million)
- Data Table on UAE - Market size and forecast (2024-2029) ($ million)
- Chart on UAE - Year-over-year growth (2024-2029) (%)
- Data Table on UAE - Year-over-year growth (2024-2029) (%)
- 14.24 Oman - Market size and forecast (2024-2029)
- Chart on Oman - Market size and forecast (2024-2029) ($ million)
- Data Table on Oman - Market size and forecast (2024-2029) ($ million)
- Chart on Oman - Year-over-year growth (2024-2029) (%)
- Data Table on Oman - Year-over-year growth (2024-2029) (%)
- 14.25 Argentina - Market size and forecast (2024-2029)
- Chart on Argentina - Market size and forecast (2024-2029) ($ million)
- Data Table on Argentina - Market size and forecast (2024-2029) ($ million)
- Chart on Argentina - Year-over-year growth (2024-2029) (%)
- Data Table on Argentina - Year-over-year growth (2024-2029) (%)
- 14.26 KSA - Market size and forecast (2024-2029)
- Chart on KSA - Market size and forecast (2024-2029) ($ million)
- Data Table on KSA - Market size and forecast (2024-2029) ($ million)
- Chart on KSA - Year-over-year growth (2024-2029) (%)
- Data Table on KSA - Year-over-year growth (2024-2029) (%)
- 14.27 Rest of World (ROW) - Market size and forecast (2024-2029)
- Chart on Rest of World (ROW) - Market size and forecast (2024-2029) ($ million)
- Data Table on Rest of World (ROW) - Market size and forecast (2024-2029) ($ million)
- Chart on Rest of World (ROW) - Year-over-year growth (2024-2029) (%)
- Data Table on Rest of World (ROW) - Year-over-year growth (2024-2029) (%)
15 Drivers, Challenges, and Opportunity/Restraints
- 15.3 Impact of drivers and challenges
- Impact of drivers and challenges in 2024 and 2029
- 15.4 Market opportunities/restraints
16 Competitive Landscape
- 16.2 Competitive Landscape
- Overview on criticality of inputs and factors of differentiation
- 16.3 Landscape disruption
- Overview on factors of disruption
- 16.4 Industry risks
- Impact of key risks on business
17 Competitive Analysis
- 17.2 Market positioning of companies
- Matrix on companies position and classification
- 17.3 hatime (La Kaffa International Co. Ltd.)
- hatime (La Kaffa International Co. Ltd.) - Overview
- hatime (La Kaffa International Co. Ltd.) - Product / Service
- hatime (La Kaffa International Co. Ltd.) - Key offerings
- 17.4 CoCo Fresh Tea & Juice
- CoCo Fresh Tea & Juice - Overview
- CoCo Fresh Tea & Juice - Product / Service
- CoCo Fresh Tea & Juice - Key offerings
- 17.5 Comebuy
- Comebuy - Overview
- Comebuy - Product / Service
- Comebuy - Key offerings
- 17.6 Customize
- Customize - Overview
- Customize - Product / Service
- Customize - Key offerings
- 17.7 Gong Cha
- Gong Cha - Overview
- Gong Cha - Product / Service
- Gong Cha - Key offerings
- 17.8 HappyLemon
- HappyLemon - Overview
- HappyLemon - Product / Service
- HappyLemon - Key offerings
- 17.9 Kung Fu Tea
- Kung Fu Tea - Overview
- Kung Fu Tea - Product / Service
- Kung Fu Tea - Key offerings
- 17.10 Ochado
- Ochado - Overview
- Ochado - Product / Service
- Ochado - Key offerings
- 17.11 Sharetea
- Sharetea - Overview
- Sharetea - Product / Service
- Sharetea - Key offerings
- 17.12 Ten Ren Tea
- Ten Ren Tea - Overview
- Ten Ren Tea - Product / Service
- Ten Ren Tea - Key offerings
- 17.13 The Alley
- The Alley - Overview
- The Alley - Product / Service
- The Alley - Key offerings
- 17.14 Tiger Sugar
- Tiger Sugar - Overview
- Tiger Sugar - Product / Service
- Tiger Sugar - Key offerings
- 17.15 True Brew Tea Company
- True Brew Tea Company - Overview
- True Brew Tea Company - Product / Service
- True Brew Tea Company - Key offerings
- 17.16 Wushiland Boba
- Wushiland Boba - Overview
- Wushiland Boba - Product / Service
- Wushiland Boba - Key offerings
- 17.17 Xing Fu Tang
- Xing Fu Tang - Overview
- Xing Fu Tang - Product / Service
- Xing Fu Tang - Key offerings
- 17.18 Yi Fang Taiwan Fruit Tea
- Yi Fang Taiwan Fruit Tea - Overview
- Yi Fang Taiwan Fruit Tea - Product / Service
- Yi Fang Taiwan Fruit Tea - Key offerings
- 17.19 Yifang Fruit Tea
- Yifang Fruit Tea - Overview
- Yifang Fruit Tea - Product / Service
- Yifang Fruit Tea - Key offerings
- 17.20 Zabok
- Zabok - Overview
- Zabok - Product / Service
- Zabok - Key offerings
- 17.21 Zumiez
- Zumiez - Overview
- Zumiez - Product / Service
- Zumiez - Key offerings
- 17.22 Zun Tea
- Zun Tea - Overview
- Zun Tea - Product / Service
- Zun Tea - Key offerings
- 17.23 Boba Box
- Boba Box - Overview
- Boba Box - Product / Service
- Boba Box - Key offerings
- 17.24 Boba Tea Direct
- Boba Tea Direct - Overview
- Boba Tea Direct - Product / Service
- Boba Tea Direct - Key offerings
- 17.25 BossenStore.com
- BossenStore.com - Overview
- BossenStore.com - Product / Service
- BossenStore.com - Key offerings
- 17.26 Bubble Tea House Co.
- Bubble Tea House Co. - Overview
- Bubble Tea House Co. - Product / Service
- Bubble Tea House Co. - Key offerings
- 17.27 Bubble Tea Supply
- Bubble Tea Supply - Overview
- Bubble Tea Supply - Product / Service
- Bubble Tea Supply - Key offerings
- 17.28 Chen En Food Product Enterprise Co. Ltd.
- Chen En Food Product Enterprise Co. Ltd. - Overview
- Chen En Food Product Enterprise Co. Ltd. - Product / Service
- Chen En Food Product Enterprise Co. Ltd. - Key offerings
- 17.29 Empire Eagle Food Co. Ltd.
- Empire Eagle Food Co. Ltd. - Overview
- Empire Eagle Food Co. Ltd. - Product / Service
- Empire Eagle Food Co. Ltd. - Key offerings
- 17.30 Europe BoBoQ GmbH
- Europe BoBoQ GmbH - Overview
- Europe BoBoQ GmbH - Product / Service
- Europe BoBoQ GmbH - Key offerings
- 17.31 Fanale Drinks
- Fanale Drinks - Overview
- Fanale Drinks - Product / Service
- Fanale Drinks - Key offerings
- 17.32 Fokus Inc.
- Fokus Inc. - Overview
- Fokus Inc. - Product / Service
- Fokus Inc. - Key offerings
- 17.33 HUEY YUHE ENTERPRISE CO. LTD.
- HUEY YUHE ENTERPRISE CO. LTD. - Overview
- HUEY YUHE ENTERPRISE CO. LTD. - Product / Service
- HUEY YUHE ENTERPRISE CO. LTD. - Key offerings
- 17.34 Karat by Lollicup
- Karat by Lollicup - Overview
- Karat by Lollicup - Product / Service
- Karat by Lollicup - Key offerings
- 17.35 Krishna Food India
- Krishna Food India - Overview
- Krishna Food India - Product / Service
- Krishna Food India - Key offerings
- 17.36 Possmei International Co. Ltd.
- Possmei International Co. Ltd. - Overview
- Possmei International Co. Ltd. - Product / Service
- Possmei International Co. Ltd. - Key offerings
- 17.37 Sumos M Sdn Bhd.
- Sumos M Sdn Bhd. - Overview
- Sumos M Sdn Bhd. - Product / Service
- Sumos M Sdn Bhd. - Key offerings
- 17.38 Sunnysyrup Food Co. Ltd.
- Sunnysyrup Food Co. Ltd. - Overview
- Sunnysyrup Food Co. Ltd. - Product / Service
- Sunnysyrup Food Co. Ltd. - Key offerings
- 17.39 Sunwide Bubble Tea
- Sunwide Bubble Tea - Overview
- Sunwide Bubble Tea - Product / Service
- Sunwide Bubble Tea - Key offerings
- 17.40 Troika JC
- Troika JC - Overview
- Troika JC - Product / Service
- Troika JC - Key offerings
- 17.41 Yen Chuan International Co. Ltd.
- Yen Chuan International Co. Ltd. - Overview
- Yen Chuan International Co. Ltd. - Product / Service
- Yen Chuan International Co. Ltd. - Key offerings
18 Appendix
- 18.2 Inclusions and exclusions checklist
- Inclusions checklist
- Exclusions checklist
- 18.3 Currency conversion rates for US$
- Currency conversion rates for US$
- 18.4 Research methodology
- 18.7 Validation techniques employed for market sizing
- Validation techniques employed for market sizing
- 18.9 360 degree market analysis
- 360 degree market analysis
- 18.10 List of abbreviations