Building Automation And Control Systems Market Analysis, Size, and Forecast 2026-2030: North America (US, Canada, and Mexico), Europe (UK, Germany, and Italy), APAC (China, Japan, and South Korea), Middle East and Africa (Saudi Arabia, UAE, and South Africa), South America (Brazil, Argentina, and Colombia), and Rest of World (ROW)

Building Automation And Control Systems Market Analysis, Size, and Forecast 2026-2030:
North America (US, Canada, and Mexico), Europe (UK, Germany, and Italy), APAC (China, Japan, and South Korea), Middle East and Africa (Saudi Arabia, UAE, and South Africa), South America (Brazil, Argentina, and Colombia), and Rest of World (ROW)

Published: Mar 2026 309 Pages SKU: IRTNTR44667

Market Overview at a Glance

$88.25 B
Market Opportunity
13.1%
CAGR 2025 - 2030
34.1%
North America Growth
$53.91 B
Commercial buildings segment 2024

Building Automation And Control Systems Market Size 2026-2030

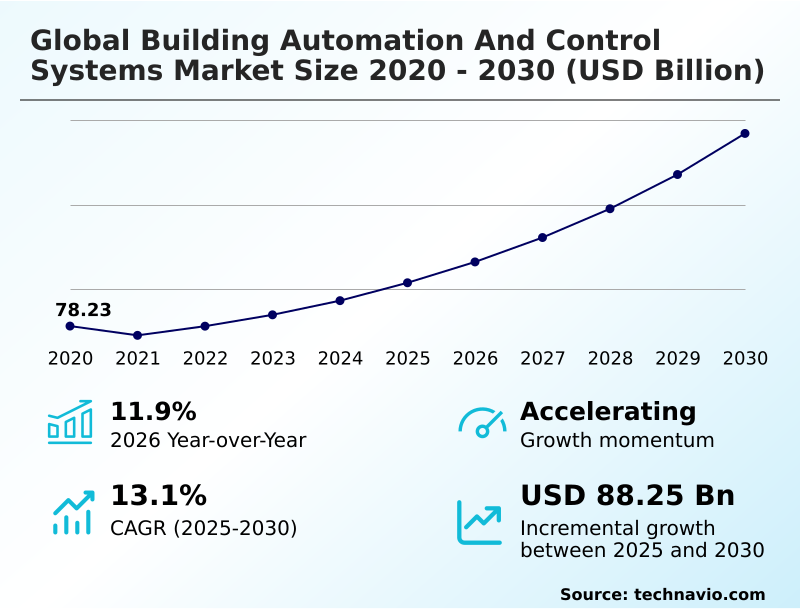
The building automation and control systems market size is valued to increase by USD 88.25 billion, at a CAGR of 13.1% from 2025 to 2030. Mainstreaming of regulatory decarbonization and mandatory efficiency standards will drive the building automation and control systems market.

Major Market Trends & Insights

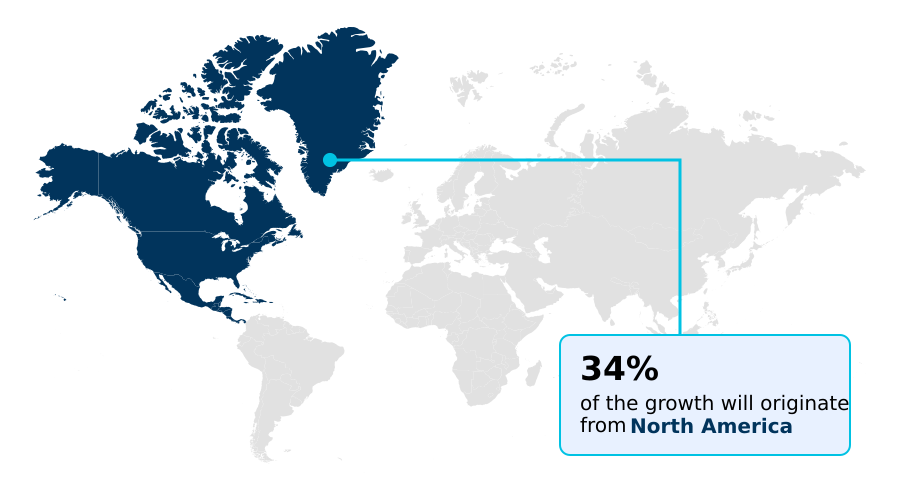
  • North America dominated the market and accounted for a 34.1% growth during the forecast period.
  • By End-user - Commercial buildings segment was valued at USD 53.91 billion in 2024
  • By Type - Integration segment accounted for the largest market revenue share in 2024

Market Size & Forecast

  • Market Opportunities: USD 113.83 billion
  • Market Future Opportunities: USD 88.25 billion
  • CAGR from 2025 to 2030 : 13.1%

Market Summary

  • The building automation and control systems market is undergoing a significant transformation, propelled by the urgent need for operational efficiency and decarbonization. This evolution is defined by the convergence of operational technology and information technology, where agentic artificial intelligence and machine learning are no longer aspirational but core components.
  • Modern infrastructures now function as self-optimizing ecosystems that integrate HVAC control systems, security, and lighting into a single, cohesive digital framework. For instance, a large commercial real estate portfolio can leverage predictive maintenance algorithms to anticipate equipment failures, reducing downtime and extending asset life, a shift from reactive to proactive management.
  • The adoption of digital twin technology allows for real-time simulation and risk-free optimization, ensuring buildings meet stringent sustainability targets. This market is also characterized by a move toward software-defined automation, which offers greater flexibility and interoperability, addressing long-standing issues with proprietary hardware.
  • As energy costs fluctuate, the ability of these systems to perform demand-side load shaping and integrate with the smart grid is critical for maintaining financial viability and environmental responsibility, making data-driven facility optimization a key competitive advantage.

What will be the Size of the Building Automation And Control Systems Market during the forecast period?

Get Key Insights on Market Forecast (PDF) Request Free Sample

How is the Building Automation And Control Systems Market Segmented?

The building automation and control systems industry research report provides comprehensive data (region-wise segment analysis), with forecasts and estimates in "USD million" for the period 2026-2030, as well as historical data from 2020-2024 for the following segments.
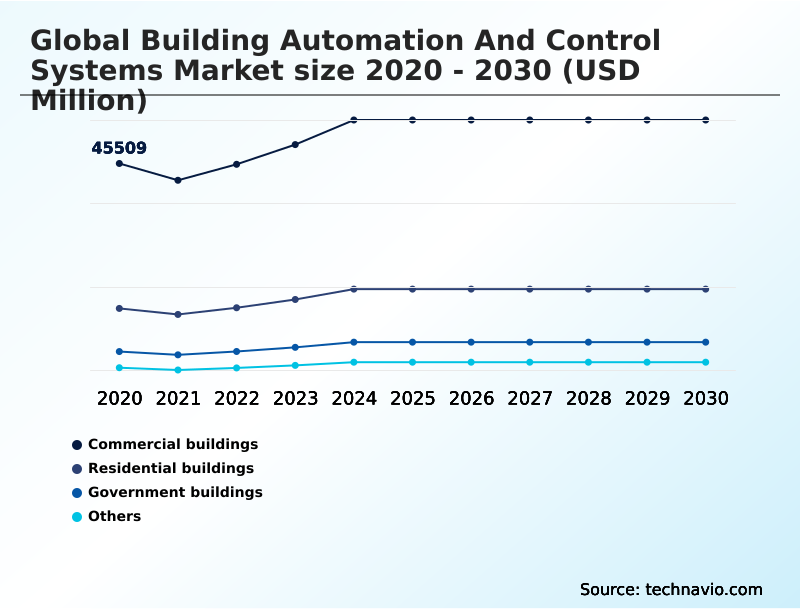
  • End-user
    • Commercial buildings
    • Residential buildings
    • Government buildings
    • Others
  • Type
    • Integration
    • Services
  • Product
    • HVAC control systems
    • Lighting control systems
    • Security and access control systems
    • Energy management systems
    • Others
  • Geography
    • North America
      • US
      • Canada
      • Mexico
    • Europe
      • UK
      • Germany
      • Italy
    • APAC
      • China
      • Japan
      • South Korea
    • Middle East and Africa
      • Saudi Arabia
      • UAE
      • South Africa
    • South America
      • Brazil
      • Argentina
      • Colombia
    • Rest of World (ROW)

By End-user Insights

The commercial buildings segment is estimated to witness significant growth during the forecast period.

The commercial buildings segment is at the forefront of the building automation and control systems market, driven by a strategic focus on operational efficiency and stringent ESG compliance reporting.

Property developers are moving beyond basic climate management to implement integrated, data-driven facility optimization platforms. These enterprise-level BACS leverage a dense network of sensors for occupancy-centric control, enabling intelligent load management and supporting net-zero building operations.

The integration of HVAC control systems, lighting control systems, and security and access control systems through software-defined automation and building information modeling (BIM) is standard.

This transition facilitates a smart building-as-a-service model, where advanced energy management systems reduce waste in unoccupied zones by over 30%, optimizing asset performance.

Request Free Sample

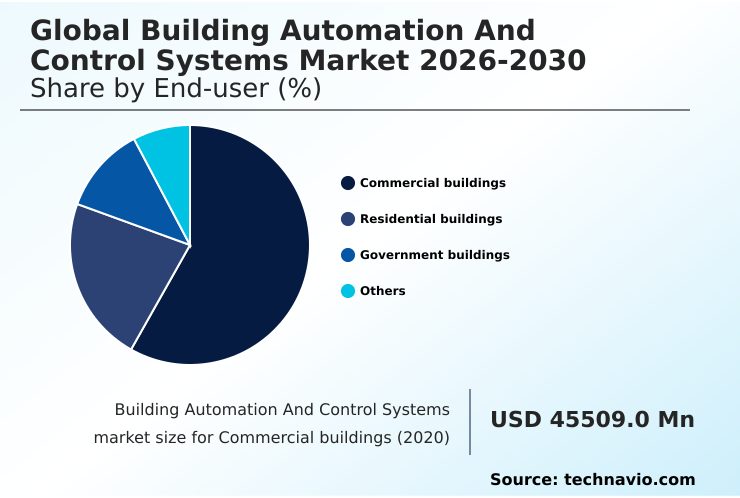
The Commercial buildings segment was valued at USD 53.91 billion in 2024 and showed a gradual increase during the forecast period.

Request Free Sample

Regional Analysis

North America is estimated to contribute 34.1% to the growth of the global market during the forecast period.Technavio’s analysts have elaborately explained the regional trends and drivers that shape the market during the forecast period.

See How Building Automation And Control Systems Market Demand is Rising in North America Request Free Sample

The geographic landscape of the building automation and control systems market is diverse, with North America contributing over 34% of the incremental growth, driven by stringent regulatory decarbonization mandates.

In this region, the focus is on grid-interactive buildings and demand-side load shaping to mitigate energy volatility. APAC is the fastest-growing region, characterized by large-scale smart city projects that leverage 5G connectivity for cloud-native building management and IP-based surveillance.

These projects utilize facility management software for real-time plug-load monitoring and automated fault detection. Meanwhile, Europe's market is defined by retrofitting existing structures using low-power protocols like LoRaWAN, which helps modernize buildings to meet efficiency standards without extensive rewiring.

Across all regions, unified security platforms are becoming standard for mission-critical facility applications.

Market Dynamics

Our researchers analyzed the data with 2025 as the base year, along with the key drivers, trends, and challenges. A holistic analysis of drivers will help companies refine their marketing strategies to gain a competitive advantage.

  • Achieving enhanced operational efficiency in the building automation and control systems market hinges on the strategic integration of HVAC and lighting controls for energy efficiency. The deployment of advanced systems requires a deep understanding of key technical aspects, from implementing BACnet protocol in commercial building automation to navigating the challenges of interoperability between legacy and modern BACS.
  • A primary focus is using digital twin technology for predictive building maintenance, which allows facility managers to preemptively address issues. However, this increased connectivity introduces cybersecurity vulnerabilities in IP-based access control systems, necessitating the adoption of a zero-trust architecture for securing connected building infrastructure.
  • The debate over edge computing versus cloud computing in smart buildings continues, with many adopting hybrid models. Demand-side load shaping for grid-interactive commercial buildings is becoming critical for energy cost management. Technologies like LoRaWAN protocol for wireless sensor networks in retrofits are enabling cost-effective upgrades.
  • Furthermore, agentic AI for autonomous HVAC optimization and real-time plug-load monitoring for space utilization analytics are delivering efficiency gains that are more than double those of manually managed systems. The benefits of circadian lighting systems in office environments on occupant productivity are also a significant value proposition for modern enterprises.

What are the key market drivers leading to the rise in the adoption of Building Automation And Control Systems Industry?

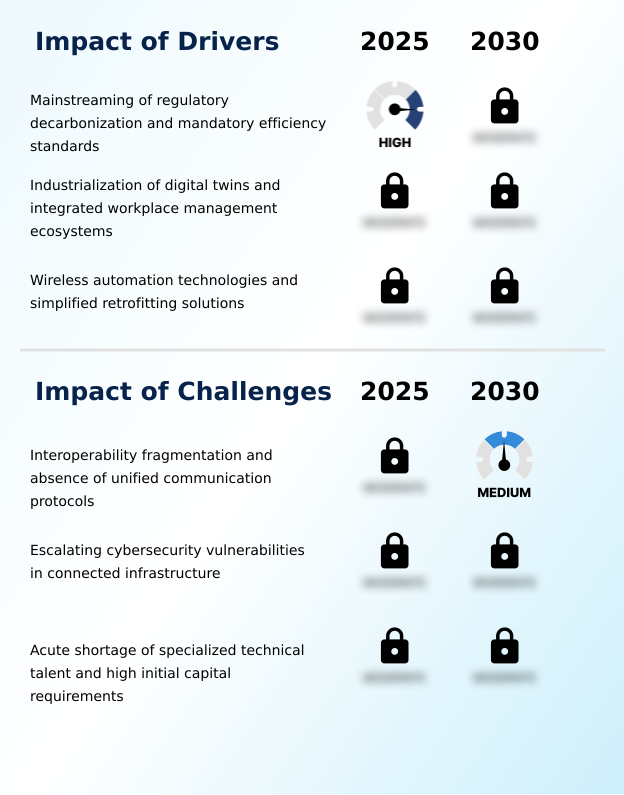
  • The mainstreaming of regulatory decarbonization mandates and mandatory efficiency standards serves as a primary driver propelling market growth.

  • Market growth is significantly driven by the industrialization of digital twin technology and the rise of agentic artificial intelligence, enabling autonomous operational decisions.
  • This OT-IT convergence is creating agentic building management systems that leverage predictive maintenance algorithms and open-protocol solutions for enhanced efficiency.
  • The adoption of edge computing architecture allows for real-time data processing, which is critical for smart grid integration and proactive maintenance scheduling.
  • These systems have demonstrated the ability to optimize energy consumption, reducing operational costs by over 20% in some cases. The use of augmented reality maintenance tools is also shortening repair times significantly.
  • This push for sustainable infrastructure development is leading to a surge in digital retrofit solutions that transform legacy assets into highly efficient, data-rich environments.

What are the market trends shaping the Building Automation And Control Systems Industry?

  • The market is increasingly influenced by the prioritization of occupant health, driving the adoption of advanced solutions such as circadian lighting systems to enhance well-being.

  • Key trends in the building automation and control systems market are increasingly centered on human-centric building design and occupant well-being analytics. The adoption of advanced circadian lighting systems and indoor air quality (IAQ) sensors is becoming standard in premium real estate, improving productivity by over 15% in some office environments.
  • The market is also seeing a surge in demand for wireless automation technologies and biometric access controls, enabling a modular automation approach with non-intrusive monitoring systems. This facilitates remote facility management through a single-pane-of-glass monitoring interface. Thermal imaging sensors provide granular occupancy data, while decentralized control logic ensures real-time responsiveness.
  • This move toward plug-and-play system integration is making sophisticated automation more accessible for both new and existing buildings.

What challenges does the Building Automation And Control Systems Industry face during its growth?

  • Market growth is significantly constrained by challenges surrounding interoperability fragmentation and the prevailing absence of unified communication protocols.

  • A primary challenge constraining the market is the lack of a universal interoperability framework, which complicates brownfield redevelopment projects and hinders the creation of a holistic energy-saving strategy. While standards like the BACnet protocol and KNX protocol exist, proprietary systems create data silos, requiring expensive custom integration.
  • This fragmentation makes it difficult to achieve a future-proof building architecture and optimize asset lifecycle optimization. Furthermore, the proliferation of connected devices using low-power wide-area networking (LPWAN) and the Zigbee protocol has escalated concerns around cyber-physical security. Addressing these vulnerabilities requires implementing robust cybersecurity-by-design principles and a zero-trust architecture, adding complexity and cost.
  • Without a unified approach, the promise of seamless and resilient infrastructure management remains a significant hurdle for widespread adoption.

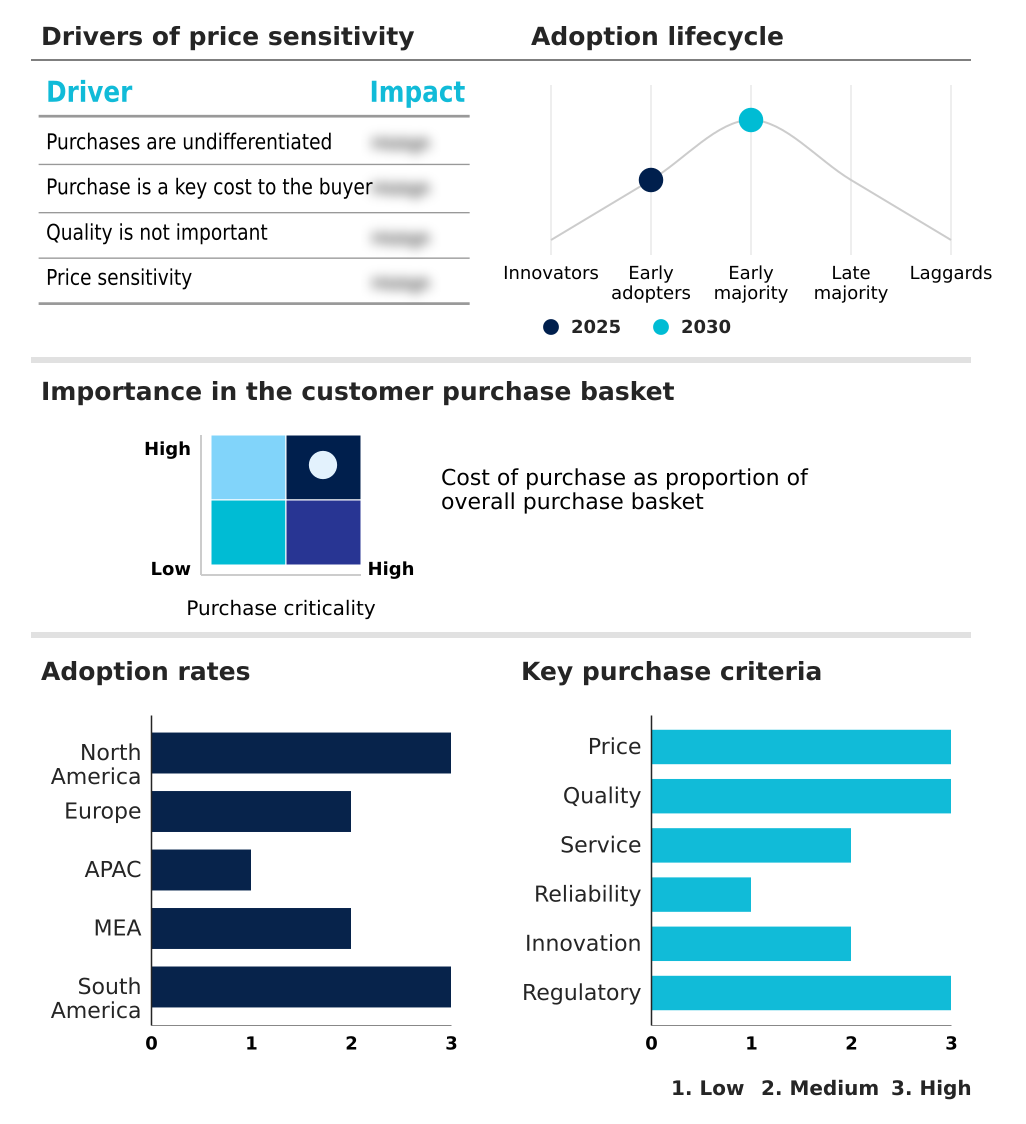
Exclusive Technavio Analysis on Customer Landscape

The building automation and control systems market forecasting report includes the adoption lifecycle of the market, covering from the innovator’s stage to the laggard’s stage. It focuses on adoption rates in different regions based on penetration. Furthermore, the building automation and control systems market report also includes key purchase criteria and drivers of price sensitivity to help companies evaluate and develop their market growth analysis strategies.

Customer Landscape of Building Automation And Control Systems Industry

Competitive Landscape

Companies are implementing various strategies, such as strategic alliances, building automation and control systems market forecast, partnerships, mergers and acquisitions, geographical expansion, and product/service launches, to enhance their presence in the industry.

ABB Ltd. - Delivers integrated IoT and sustainability-focused smart lighting, HVAC, and energy management solutions designed for enhanced building performance and operational efficiency.

The industry research and growth report includes detailed analyses of the competitive landscape of the market and information about key companies, including:

  • ABB Ltd.
  • Bajaj Electricals Ltd.
  • BuildingLogiX
  • Comfort Systems USA Inc.
  • Emerson Electric Co.
  • Forescout Technologies Inc.
  • Honeywell International Inc.
  • IoEnergy Inc.
  • Itron Inc.
  • Johnson Controls International
  • KMC Controls Inc.
  • Legrand SA
  • Lutron Electronics Co. Inc.
  • ModeGreen
  • Optergy
  • PointGrab Inc.
  • Robert Bosch GmbH
  • Rockwell Automation Inc.
  • Schneider Electric SE
  • Siemens AG

Qualitative and quantitative analysis of companies has been conducted to help clients understand the wider business environment as well as the strengths and weaknesses of key industry players. Data is qualitatively analyzed to categorize companies as pure play, category-focused, industry-focused, and diversified; it is quantitatively analyzed to categorize companies as dominant, leading, strong, tentative, and weak.

Recent Development and News in Building automation and control systems market

  • In November, 2024, ABB Ltd. launched its ABB Ability BuildingPro platform, a cybersecure integration environment designed to unify operational data across commercial, education, and healthcare facilities.
  • In February, 2025, Honeywell International Inc. and Tata Consultancy Services announced a strategic partnership to accelerate the deployment of AI-driven autonomous operations for smart buildings and industrial sectors.
  • In February, 2025, Schneider Electric SE unveiled the EcoStruxure Foxboro Software Defined Automation platform, an open, software-defined control system that decouples hardware from control logic to enhance vendor independence.
  • In April, 2025, Siemens AG announced a major collaboration with Microsoft to improve interoperability between its Building X digital platform and Microsoft Azure IoT Operations, enhancing remote service capabilities.

Dive into Technavio’s robust research methodology, blending expert interviews, extensive data synthesis, and validated models for unparalleled Building Automation And Control Systems Market insights. See full methodology.

Market Scope
Page number 309
Base year 2025
Historic period 2020-2024
Forecast period 2026-2030
Growth momentum & CAGR Accelerate at a CAGR of 13.1%
Market growth 2026-2030 USD 88245.4 million
Market structure Fragmented
YoY growth 2025-2026(%) 11.9%
Key countries US, Canada, Mexico, UK, Germany, Italy, France, Russia, Spain, China, Japan, South Korea, India, Australia, Indonesia, Saudi Arabia, UAE, South Africa, Qatar, Egypt, Brazil, Argentina and Colombia
Competitive landscape Leading Companies, Market Positioning of Companies, Competitive Strategies, and Industry Risks

Request Free Sample

Research Analyst Overview

  • The building automation and control systems market is evolving into a sophisticated ecosystem driven by the convergence of operational and information technologies. This shift is centered on creating intelligent, self-optimizing environments through the deployment of advanced solutions like digital twin technology and agentic artificial intelligence.
  • Key components such as HVAC control systems, lighting control systems, and energy management systems are no longer siloed but are integrated via open-protocol solutions and software-defined automation. This integration allows for predictive maintenance algorithms that reduce equipment downtime by up to 30% compared to reactive approaches.
  • The adoption of edge computing architecture and decentralized control logic enhances system responsiveness and security. Technologies like building information modeling (BIM) and augmented reality maintenance are streamlining both new construction and retrofits.
  • The use of wireless automation technologies, including those based on Zigbee and LoRaWAN protocols, is lowering installation barriers, while a focus on cyber-physical security and zero-trust architecture addresses emerging threats in an increasingly connected landscape.

What are the Key Data Covered in this Building Automation And Control Systems Market Research and Growth Report?

  • What is the expected growth of the Building Automation And Control Systems Market between 2026 and 2030?

    • USD 88.25 billion, at a CAGR of 13.1%

  • What segmentation does the market report cover?

    • The report is segmented by End-user (Commercial buildings, Residential buildings, Government buildings, and Others), Type (Integration, and Services), Product (HVAC control systems, Lighting control systems, Security and access control systems, Energy management systems, and Others) and Geography (North America, Europe, APAC, Middle East and Africa, South America)

  • Which regions are analyzed in the report?

    • North America, Europe, APAC, Middle East and Africa and South America

  • What are the key growth drivers and market challenges?

    • Mainstreaming of regulatory decarbonization and mandatory efficiency standards, Interoperability fragmentation and absence of unified communication protocols

  • Who are the major players in the Building Automation And Control Systems Market?

    • ABB Ltd., Bajaj Electricals Ltd., BuildingLogiX, Comfort Systems USA Inc., Emerson Electric Co., Forescout Technologies Inc., Honeywell International Inc., IoEnergy Inc., Itron Inc., Johnson Controls International, KMC Controls Inc., Legrand SA, Lutron Electronics Co. Inc., ModeGreen, Optergy, PointGrab Inc., Robert Bosch GmbH, Rockwell Automation Inc., Schneider Electric SE and Siemens AG

Market Research Insights

  • The building automation and control systems market is defined by a shift toward data-driven facility optimization and holistic energy-saving strategies. Stakeholders are adopting a modular automation approach to modernize assets, with plug-and-play system integration enabling phased upgrades that mitigate high initial capital costs. This transition to enterprise-level BACS facilitates unified security platforms and single-pane-of-glass monitoring, which improves operational oversight.
  • Implementations focusing on asset lifecycle optimization have demonstrated the ability to reduce idle energy consumption by up to 30%. Furthermore, proactive maintenance scheduling, informed by real-time analytics, has been shown to lower repair expenditures by more than 15% compared to traditional reactive models. These advancements are critical for achieving resilient infrastructure management and future-proofing assets against market volatility.

We can help! Our analysts can customize this building automation and control systems market research report to meet your requirements.

Get in touch

1. Executive Summary

1.1 Market overview

Executive Summary - Chart on Market Overview
Executive Summary - Data Table on Market Overview
Executive Summary - Chart on Global Market Characteristics
Executive Summary - Chart on Market by Geography
Executive Summary - Chart on Market Segmentation by End-user
Executive Summary - Chart on Market Segmentation by Type
Executive Summary - Chart on Market Segmentation by Product
Executive Summary - Chart on Incremental Growth
Executive Summary - Data Table on Incremental Growth
Executive Summary - Chart on Company Market Positioning

2. Technavio Analysis

2.1 Analysis of price sensitivity, lifecycle, customer purchase basket, adoption rates, and purchase criteria

2.2 Criticality of inputs and Factors of differentiation

Chart on Overview on criticality of inputs and factors of differentiation

2.3 Factors of disruption

Chart on Overview on factors of disruption

2.4 Impact of drivers and challenges

Chart on Impact of drivers and challenges in 2025 and 2030

3. Market Landscape

3.1 Market ecosystem

Chart on Parent Market
Data Table on - Parent Market

3.2 Market characteristics

Chart on Market characteristics analysis

3.3 Value chain analysis

Chart on Value chain analysis

4. Market Sizing

4.1 Market definition

Data Table on Offerings of companies included in the market definition

4.2 Market segment analysis

Market segments

4.3 Market size 2025

4.4 Market outlook: Forecast for 2025-2030

Chart on Global - Market size and forecast 2025-2030 ($ million)
Data Table on Global - Market size and forecast 2025-2030 ($ million)
Chart on Global Market: Year-over-year growth 2025-2030 (%)
Data Table on Global Market: Year-over-year growth 2025-2030 (%)

5. Historic Market Size

5.1 Global Building Automation And Control Systems Market 2020 - 2024

Historic Market Size - Data Table on Global Building Automation And Control Systems Market 2020 - 2024 ($ million)

5.2 End-user segment analysis 2020 - 2024

Historic Market Size - End-user Segment 2020 - 2024 ($ million)

5.3 Type segment analysis 2020 - 2024

Historic Market Size - Type Segment 2020 - 2024 ($ million)

5.4 Product segment analysis 2020 - 2024

Historic Market Size - Product Segment 2020 - 2024 ($ million)

5.5 Geography segment analysis 2020 - 2024

Historic Market Size - Geography Segment 2020 - 2024 ($ million)

5.6 Country segment analysis 2020 - 2024

Historic Market Size - Country Segment 2020 - 2024 ($ million)

6. Qualitative Analysis

6.1 Impact of AI in global building automation and control systems market

7. Five Forces Analysis

7.1 Five forces summary

Five forces analysis - Comparison between 2025 and 2030

7.2 Bargaining power of buyers

Bargaining power of buyers - Impact of key factors 2025 and 2030

7.3 Bargaining power of suppliers

Bargaining power of suppliers - Impact of key factors in 2025 and 2030

7.4 Threat of new entrants

Threat of new entrants - Impact of key factors in 2025 and 2030

7.5 Threat of substitutes

Threat of substitutes - Impact of key factors in 2025 and 2030

7.6 Threat of rivalry

Threat of rivalry - Impact of key factors in 2025 and 2030

7.7 Market condition

Chart on Market condition - Five forces 2025 and 2030

8. Market Segmentation by End-user

8.1 Market segments

Chart on End-user - Market share 2025-2030 (%)
Data Table on End-user - Market share 2025-2030 (%)

8.2 Comparison by End-user

Chart on Comparison by End-user
Data Table on Comparison by End-user

8.3 Commercial buildings - Market size and forecast 2025-2030

Chart on Commercial buildings - Market size and forecast 2025-2030 ($ million)
Data Table on Commercial buildings - Market size and forecast 2025-2030 ($ million)
Chart on Commercial buildings - Year-over-year growth 2025-2030 (%)
Data Table on Commercial buildings - Year-over-year growth 2025-2030 (%)

8.4 Residential buildings - Market size and forecast 2025-2030

Chart on Residential buildings - Market size and forecast 2025-2030 ($ million)
Data Table on Residential buildings - Market size and forecast 2025-2030 ($ million)
Chart on Residential buildings - Year-over-year growth 2025-2030 (%)
Data Table on Residential buildings - Year-over-year growth 2025-2030 (%)

8.5 Government buildings - Market size and forecast 2025-2030

Chart on Government buildings - Market size and forecast 2025-2030 ($ million)
Data Table on Government buildings - Market size and forecast 2025-2030 ($ million)
Chart on Government buildings - Year-over-year growth 2025-2030 (%)
Data Table on Government buildings - Year-over-year growth 2025-2030 (%)

8.6 Others - Market size and forecast 2025-2030

Chart on Others - Market size and forecast 2025-2030 ($ million)
Data Table on Others - Market size and forecast 2025-2030 ($ million)
Chart on Others - Year-over-year growth 2025-2030 (%)
Data Table on Others - Year-over-year growth 2025-2030 (%)

8.7 Market opportunity by End-user

Market opportunity by End-user ($ million)
Data Table on Market opportunity by End-user ($ million)

9. Market Segmentation by Type

9.1 Market segments

Chart on Type - Market share 2025-2030 (%)
Data Table on Type - Market share 2025-2030 (%)

9.2 Comparison by Type

Chart on Comparison by Type
Data Table on Comparison by Type

9.3 Integration - Market size and forecast 2025-2030

Chart on Integration - Market size and forecast 2025-2030 ($ million)
Data Table on Integration - Market size and forecast 2025-2030 ($ million)
Chart on Integration - Year-over-year growth 2025-2030 (%)
Data Table on Integration - Year-over-year growth 2025-2030 (%)

9.4 Services - Market size and forecast 2025-2030

Chart on Services - Market size and forecast 2025-2030 ($ million)
Data Table on Services - Market size and forecast 2025-2030 ($ million)
Chart on Services - Year-over-year growth 2025-2030 (%)
Data Table on Services - Year-over-year growth 2025-2030 (%)

9.5 Market opportunity by Type

Market opportunity by Type ($ million)
Data Table on Market opportunity by Type ($ million)

10. Market Segmentation by Product

10.1 Market segments

Chart on Product - Market share 2025-2030 (%)
Data Table on Product - Market share 2025-2030 (%)

10.2 Comparison by Product

Chart on Comparison by Product
Data Table on Comparison by Product

10.3 HVAC control systems - Market size and forecast 2025-2030

Chart on HVAC control systems - Market size and forecast 2025-2030 ($ million)
Data Table on HVAC control systems - Market size and forecast 2025-2030 ($ million)
Chart on HVAC control systems - Year-over-year growth 2025-2030 (%)
Data Table on HVAC control systems - Year-over-year growth 2025-2030 (%)

10.4 Lighting control systems - Market size and forecast 2025-2030

Chart on Lighting control systems - Market size and forecast 2025-2030 ($ million)
Data Table on Lighting control systems - Market size and forecast 2025-2030 ($ million)
Chart on Lighting control systems - Year-over-year growth 2025-2030 (%)
Data Table on Lighting control systems - Year-over-year growth 2025-2030 (%)

10.5 Security and access control systems - Market size and forecast 2025-2030

Chart on Security and access control systems - Market size and forecast 2025-2030 ($ million)
Data Table on Security and access control systems - Market size and forecast 2025-2030 ($ million)
Chart on Security and access control systems - Year-over-year growth 2025-2030 (%)
Data Table on Security and access control systems - Year-over-year growth 2025-2030 (%)

10.6 Energy management systems - Market size and forecast 2025-2030

Chart on Energy management systems - Market size and forecast 2025-2030 ($ million)
Data Table on Energy management systems - Market size and forecast 2025-2030 ($ million)
Chart on Energy management systems - Year-over-year growth 2025-2030 (%)
Data Table on Energy management systems - Year-over-year growth 2025-2030 (%)

10.7 Others - Market size and forecast 2025-2030

Chart on Others - Market size and forecast 2025-2030 ($ million)
Data Table on Others - Market size and forecast 2025-2030 ($ million)
Chart on Others - Year-over-year growth 2025-2030 (%)
Data Table on Others - Year-over-year growth 2025-2030 (%)

10.8 Market opportunity by Product

Market opportunity by Product ($ million)
Data Table on Market opportunity by Product ($ million)

11. Customer Landscape

11.1 Customer landscape overview

Analysis of price sensitivity, lifecycle, customer purchase basket, adoption rates, and purchase criteria

12. Geographic Landscape

12.1 Geographic segmentation

Chart on Market share by geography 2025-2030 (%)
Data Table on Market share by geography 2025-2030 (%)

12.2 Geographic comparison

Chart on Geographic comparison
Data Table on Geographic comparison

12.3 North America - Market size and forecast 2025-2030

Chart on North America - Market size and forecast 2025-2030 ($ million)
Data Table on North America - Market size and forecast 2025-2030 ($ million)
Chart on North America - Year-over-year growth 2025-2030 (%)
Data Table on North America - Year-over-year growth 2025-2030 (%)
Chart on Regional Comparison - North America
Data Table on Regional Comparison - North America

12.3.1 US - Market size and forecast 2025-2030

Chart on US - Market size and forecast 2025-2030 ($ million)
Data Table on US - Market size and forecast 2025-2030 ($ million)
Chart on US - Year-over-year growth 2025-2030 (%)
Data Table on US - Year-over-year growth 2025-2030 (%)

12.3.2 Canada - Market size and forecast 2025-2030

Chart on Canada - Market size and forecast 2025-2030 ($ million)
Data Table on Canada - Market size and forecast 2025-2030 ($ million)
Chart on Canada - Year-over-year growth 2025-2030 (%)
Data Table on Canada - Year-over-year growth 2025-2030 (%)

12.3.3 Mexico - Market size and forecast 2025-2030

Chart on Mexico - Market size and forecast 2025-2030 ($ million)
Data Table on Mexico - Market size and forecast 2025-2030 ($ million)
Chart on Mexico - Year-over-year growth 2025-2030 (%)
Data Table on Mexico - Year-over-year growth 2025-2030 (%)

12.4 Europe - Market size and forecast 2025-2030

Chart on Europe - Market size and forecast 2025-2030 ($ million)
Data Table on Europe - Market size and forecast 2025-2030 ($ million)
Chart on Europe - Year-over-year growth 2025-2030 (%)
Data Table on Europe - Year-over-year growth 2025-2030 (%)
Chart on Regional Comparison - Europe
Data Table on Regional Comparison - Europe

12.4.1 UK - Market size and forecast 2025-2030

Chart on UK - Market size and forecast 2025-2030 ($ million)
Data Table on UK - Market size and forecast 2025-2030 ($ million)
Chart on UK - Year-over-year growth 2025-2030 (%)
Data Table on UK - Year-over-year growth 2025-2030 (%)

12.4.2 Germany - Market size and forecast 2025-2030

Chart on Germany - Market size and forecast 2025-2030 ($ million)
Data Table on Germany - Market size and forecast 2025-2030 ($ million)
Chart on Germany - Year-over-year growth 2025-2030 (%)
Data Table on Germany - Year-over-year growth 2025-2030 (%)

12.4.3 Italy - Market size and forecast 2025-2030

Chart on Italy - Market size and forecast 2025-2030 ($ million)
Data Table on Italy - Market size and forecast 2025-2030 ($ million)
Chart on Italy - Year-over-year growth 2025-2030 (%)
Data Table on Italy - Year-over-year growth 2025-2030 (%)

12.4.4 France - Market size and forecast 2025-2030

Chart on France - Market size and forecast 2025-2030 ($ million)
Data Table on France - Market size and forecast 2025-2030 ($ million)
Chart on France - Year-over-year growth 2025-2030 (%)
Data Table on France - Year-over-year growth 2025-2030 (%)

12.4.5 Russia - Market size and forecast 2025-2030

Chart on Russia - Market size and forecast 2025-2030 ($ million)
Data Table on Russia - Market size and forecast 2025-2030 ($ million)
Chart on Russia - Year-over-year growth 2025-2030 (%)
Data Table on Russia - Year-over-year growth 2025-2030 (%)

12.4.6 Spain - Market size and forecast 2025-2030

Chart on Spain - Market size and forecast 2025-2030 ($ million)
Data Table on Spain - Market size and forecast 2025-2030 ($ million)
Chart on Spain - Year-over-year growth 2025-2030 (%)
Data Table on Spain - Year-over-year growth 2025-2030 (%)

12.5 APAC - Market size and forecast 2025-2030

Chart on APAC - Market size and forecast 2025-2030 ($ million)
Data Table on APAC - Market size and forecast 2025-2030 ($ million)
Chart on APAC - Year-over-year growth 2025-2030 (%)
Data Table on APAC - Year-over-year growth 2025-2030 (%)
Chart on Regional Comparison - APAC
Data Table on Regional Comparison - APAC

12.5.1 China - Market size and forecast 2025-2030

Chart on China - Market size and forecast 2025-2030 ($ million)
Data Table on China - Market size and forecast 2025-2030 ($ million)
Chart on China - Year-over-year growth 2025-2030 (%)
Data Table on China - Year-over-year growth 2025-2030 (%)

12.5.2 Japan - Market size and forecast 2025-2030

Chart on Japan - Market size and forecast 2025-2030 ($ million)
Data Table on Japan - Market size and forecast 2025-2030 ($ million)
Chart on Japan - Year-over-year growth 2025-2030 (%)
Data Table on Japan - Year-over-year growth 2025-2030 (%)

12.5.3 South Korea - Market size and forecast 2025-2030

Chart on South Korea - Market size and forecast 2025-2030 ($ million)
Data Table on South Korea - Market size and forecast 2025-2030 ($ million)
Chart on South Korea - Year-over-year growth 2025-2030 (%)
Data Table on South Korea - Year-over-year growth 2025-2030 (%)

12.5.4 India - Market size and forecast 2025-2030

Chart on India - Market size and forecast 2025-2030 ($ million)
Data Table on India - Market size and forecast 2025-2030 ($ million)
Chart on India - Year-over-year growth 2025-2030 (%)
Data Table on India - Year-over-year growth 2025-2030 (%)

12.5.5 Australia - Market size and forecast 2025-2030

Chart on Australia - Market size and forecast 2025-2030 ($ million)
Data Table on Australia - Market size and forecast 2025-2030 ($ million)
Chart on Australia - Year-over-year growth 2025-2030 (%)
Data Table on Australia - Year-over-year growth 2025-2030 (%)

12.5.6 Indonesia - Market size and forecast 2025-2030

Chart on Indonesia - Market size and forecast 2025-2030 ($ million)
Data Table on Indonesia - Market size and forecast 2025-2030 ($ million)
Chart on Indonesia - Year-over-year growth 2025-2030 (%)
Data Table on Indonesia - Year-over-year growth 2025-2030 (%)

12.6 Middle East and Africa - Market size and forecast 2025-2030

Chart on Middle East and Africa - Market size and forecast 2025-2030 ($ million)
Data Table on Middle East and Africa - Market size and forecast 2025-2030 ($ million)
Chart on Middle East and Africa - Year-over-year growth 2025-2030 (%)
Data Table on Middle East and Africa - Year-over-year growth 2025-2030 (%)
Chart on Regional Comparison - Middle East and Africa
Data Table on Regional Comparison - Middle East and Africa

12.6.1 Saudi Arabia - Market size and forecast 2025-2030

Chart on Saudi Arabia - Market size and forecast 2025-2030 ($ million)
Data Table on Saudi Arabia - Market size and forecast 2025-2030 ($ million)
Chart on Saudi Arabia - Year-over-year growth 2025-2030 (%)
Data Table on Saudi Arabia - Year-over-year growth 2025-2030 (%)

12.6.2 UAE - Market size and forecast 2025-2030

Chart on UAE - Market size and forecast 2025-2030 ($ million)
Data Table on UAE - Market size and forecast 2025-2030 ($ million)
Chart on UAE - Year-over-year growth 2025-2030 (%)
Data Table on UAE - Year-over-year growth 2025-2030 (%)

12.6.3 South Africa - Market size and forecast 2025-2030

Chart on South Africa - Market size and forecast 2025-2030 ($ million)
Data Table on South Africa - Market size and forecast 2025-2030 ($ million)
Chart on South Africa - Year-over-year growth 2025-2030 (%)
Data Table on South Africa - Year-over-year growth 2025-2030 (%)

12.6.4 Qatar - Market size and forecast 2025-2030

Chart on Qatar - Market size and forecast 2025-2030 ($ million)
Data Table on Qatar - Market size and forecast 2025-2030 ($ million)
Chart on Qatar - Year-over-year growth 2025-2030 (%)
Data Table on Qatar - Year-over-year growth 2025-2030 (%)

12.6.5 Egypt - Market size and forecast 2025-2030

Chart on Egypt - Market size and forecast 2025-2030 ($ million)
Data Table on Egypt - Market size and forecast 2025-2030 ($ million)
Chart on Egypt - Year-over-year growth 2025-2030 (%)
Data Table on Egypt - Year-over-year growth 2025-2030 (%)

12.7 South America - Market size and forecast 2025-2030

Chart on South America - Market size and forecast 2025-2030 ($ million)
Data Table on South America - Market size and forecast 2025-2030 ($ million)
Chart on South America - Year-over-year growth 2025-2030 (%)
Data Table on South America - Year-over-year growth 2025-2030 (%)
Chart on Regional Comparison - South America
Data Table on Regional Comparison - South America

12.7.1 Brazil - Market size and forecast 2025-2030

Chart on Brazil - Market size and forecast 2025-2030 ($ million)
Data Table on Brazil - Market size and forecast 2025-2030 ($ million)
Chart on Brazil - Year-over-year growth 2025-2030 (%)
Data Table on Brazil - Year-over-year growth 2025-2030 (%)

12.7.2 Argentina - Market size and forecast 2025-2030

Chart on Argentina - Market size and forecast 2025-2030 ($ million)
Data Table on Argentina - Market size and forecast 2025-2030 ($ million)
Chart on Argentina - Year-over-year growth 2025-2030 (%)
Data Table on Argentina - Year-over-year growth 2025-2030 (%)

12.7.3 Colombia - Market size and forecast 2025-2030

Chart on Colombia - Market size and forecast 2025-2030 ($ million)
Data Table on Colombia - Market size and forecast 2025-2030 ($ million)
Chart on Colombia - Year-over-year growth 2025-2030 (%)
Data Table on Colombia - Year-over-year growth 2025-2030 (%)

12.8 Market opportunity by geography

Market opportunity by geography ($ million)
Data Tables on Market opportunity by geography ($ million)

13. Drivers, Challenges, and Opportunity

13.1 Market drivers

Mainstreaming of regulatory decarbonization and mandatory efficiency standards
Industrialization of digital twins and integrated workplace management ecosystems
Wireless automation technologies and simplified retrofitting solutions

13.2 Market challenges

Interoperability fragmentation and absence of unified communication protocols
Escalating cybersecurity vulnerabilities in connected infrastructure
Acute shortage of specialized technical talent and high initial capital requirements

13.3 Impact of drivers and challenges

Impact of drivers and challenges in 2025 and 2030

13.4 Market opportunities

Prioritization of occupant health and circadian lighting systems
Integration of decentralized edge computing for real-time operational resilience
High-fidelity occupancy-centric control and demand-side load shaping

14. Competitive Landscape

14.1 Overview

14.2

Overview on criticality of inputs and factors of differentiation

14.3 Landscape disruption

Overview on factors of disruption

14.4 Industry risks

Impact of key risks on business

15. Competitive Analysis

15.1 Companies profiled

Companies covered

15.2 Company ranking index

15.3 Market positioning of companies

Matrix on companies position and classification

15.4 ABB Ltd.

ABB Ltd. - Overview
ABB Ltd. - Business segments
ABB Ltd. - Key news
ABB Ltd. - Key offerings
ABB Ltd. - Segment focus
SWOT

15.5 Bajaj Electricals Ltd.

Bajaj Electricals Ltd. - Overview
Bajaj Electricals Ltd. - Business segments
Bajaj Electricals Ltd. - Key offerings
Bajaj Electricals Ltd. - Segment focus
SWOT

15.6 BuildingLogiX

BuildingLogiX - Overview
BuildingLogiX - Product / Service
BuildingLogiX - Key offerings
SWOT

15.7 Comfort Systems USA Inc.

Comfort Systems USA Inc. - Overview
Comfort Systems USA Inc. - Business segments
Comfort Systems USA Inc. - Key offerings
Comfort Systems USA Inc. - Segment focus
SWOT

15.8 Emerson Electric Co.

Emerson Electric Co. - Overview
Emerson Electric Co. - Business segments
Emerson Electric Co. - Key news
Emerson Electric Co. - Key offerings
Emerson Electric Co. - Segment focus
SWOT

15.9 Honeywell International Inc.

Honeywell International Inc. - Overview
Honeywell International Inc. - Business segments
Honeywell International Inc. - Key news
Honeywell International Inc. - Key offerings
Honeywell International Inc. - Segment focus
SWOT

15.10 Itron Inc.

Itron Inc. - Overview
Itron Inc. - Business segments
Itron Inc. - Key news
Itron Inc. - Key offerings
Itron Inc. - Segment focus
SWOT

15.11 Johnson Controls International

Johnson Controls International - Overview
Johnson Controls International - Business segments
Johnson Controls International - Key news
Johnson Controls International - Key offerings
Johnson Controls International - Segment focus
SWOT

15.12 KMC Controls Inc.

KMC Controls Inc. - Overview
KMC Controls Inc. - Product / Service
KMC Controls Inc. - Key offerings
SWOT

15.13 Legrand SA

Legrand SA - Overview
Legrand SA - Business segments
Legrand SA - Key news
Legrand SA - Key offerings
Legrand SA - Segment focus
SWOT

15.14 Lutron Electronics Co. Inc.

Lutron Electronics Co. Inc. - Overview
Lutron Electronics Co. Inc. - Product / Service
Lutron Electronics Co. Inc. - Key offerings
SWOT

15.15 Robert Bosch GmbH

Robert Bosch GmbH - Overview
Robert Bosch GmbH - Product / Service
Robert Bosch GmbH - Key news
Robert Bosch GmbH - Key offerings
SWOT

15.16 Rockwell Automation Inc.

Rockwell Automation Inc. - Overview
Rockwell Automation Inc. - Business segments
Rockwell Automation Inc. - Key news
Rockwell Automation Inc. - Key offerings
Rockwell Automation Inc. - Segment focus
SWOT

15.17 Schneider Electric SE

Schneider Electric SE - Overview
Schneider Electric SE - Business segments
Schneider Electric SE - Key news
Schneider Electric SE - Key offerings
Schneider Electric SE - Segment focus
SWOT

15.18 Siemens AG

Siemens AG - Overview
Siemens AG - Business segments
Siemens AG - Key news
Siemens AG - Key offerings
Siemens AG - Segment focus
SWOT

16. Appendix

16.1 Scope of the report

Market definition
Objectives
Notes and caveats

16.2 Inclusions and exclusions checklist

Inclusions checklist
Exclusions checklist

16.3 Currency conversion rates for US$

16.4 Research methodology

16.5 Data procurement

Information sources

16.6 Data validation

16.7 Validation techniques employed for market sizing

16.8 Data synthesis

16.9 360 degree market analysis

16.10 List of abbreviations

Research Methodology

Technavio presents a detailed picture of the market by way of study, synthesis, and summation of data from multiple sources. The analysts have presented the various facets of the market with a particular focus on identifying the key industry influencers. The data thus presented is comprehensive, reliable, and the result of extensive research, both primary and secondary.

INFORMATION SOURCES

Primary sources

  • Manufacturers and suppliers
  • Channel partners
  • Industry experts
  • Strategic decision makers

Secondary sources

  • Industry journals and periodicals
  • Government data
  • Financial reports of key industry players
  • Historical data
  • Press releases

DATA ANALYSIS

Data Synthesis

  • Collation of data
  • Estimation of key figures
  • Analysis of derived insights

Data Validation

  • Triangulation with data models
  • Reference against proprietary databases
  • Corroboration with industry experts

REPORT WRITING

Qualitative

  • Market drivers
  • Market challenges
  • Market trends
  • Five forces analysis

Quantitative

  • Market size and forecast
  • Market segmentation
  • Geographical insights
  • Competitive landscape

Interested in this report?

Get your sample now to see our research methodology and insights!

Download Now

Frequently Asked Questions

Building Automation And Control Systems market growth will increase by USD 88245.4 million during 2026-2030.

The Building Automation And Control Systems market is expected to grow at a CAGR of 13.1% during 2026-2030.

Building Automation And Control Systems market is segmented by End-user (Commercial buildings, Residential buildings, Government buildings, Others) Type (Integration, Services) Product (HVAC control systems, Lighting control systems, Security and access control systems, Energy management systems, Others)

ABB Ltd., Bajaj Electricals Ltd., BuildingLogiX, Comfort Systems USA Inc., Emerson Electric Co., Forescout Technologies Inc., Honeywell International Inc., IoEnergy Inc., Itron Inc., Johnson Controls International, KMC Controls Inc., Legrand SA, Lutron Electronics Co. Inc., ModeGreen, Optergy, PointGrab Inc., Robert Bosch GmbH, Rockwell Automation Inc., Schneider Electric SE, Siemens AG are a few of the key vendors in the Building Automation And Control Systems market.

North America will register the highest growth rate of 34.1% among the other regions. Therefore, the Building Automation And Control Systems market in North America is expected to garner significant business opportunities for the vendors during the forecast period.

US, Canada, Mexico, UK, Germany, Italy, France, Russia, Spain, China, Japan, South Korea, India, Australia, Indonesia, Saudi Arabia, UAE, South Africa, Qatar, Egypt, Brazil, Argentina, Colombia

  • Mainstreaming of regulatory decarbonization and mandatory efficiency standards is the driving factor this market.

The Building Automation And Control Systems market vendors should focus on grabbing business opportunities from the End-user segment as it accounted for the largest market share in the base year.
RIA - Research AI Assistant
Ask RIA