
Business Capability Mapping Software Market Size and Growth Forecast 2026-2030
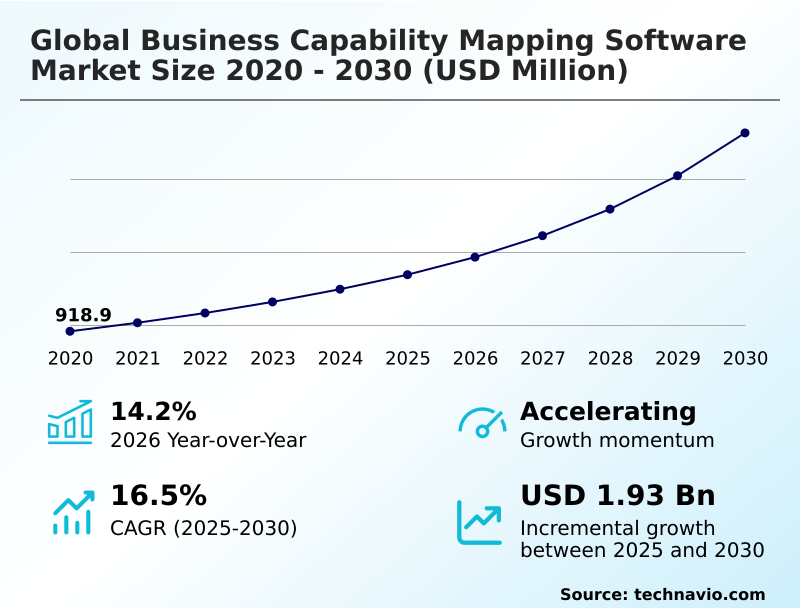
The Business Capability Mapping Software Market size was valued at USD 1.69 billion in 2025 growing at a CAGR of 16.5% during the forecast period 2026-2030.
North America accounts for 42.5% of incremental growth during the forecast period. The Cloud based segment by Deployment was valued at USD 1.03 billion in 2024, while the CGA and road mapping segment holds the largest revenue share by Application.
The market is projected to grow by USD 2.71 billion from 2020 to 2030, with USD 1.93 billion of the growth expected during the forecast period of 2025 to 2030.
Get Key Insights on Market Forecast (PDF) Request Free Sample
Business Capability Mapping Software Market Overview
The Business Capability Mapping Software Market is shaped by the imperative for enterprises to achieve strategic agility and resource optimization. In North America, which accounts for over 42% of the market's incremental growth, organizations are embedding these tools into their core operational planning. For instance, a global financial services firm, responding to mandates like the Digital Operational Resilience Act (DORA), uses business capability modeling to map its critical business functions to its underlying application portfolio management systems. This process of creating a data-driven architecture enables the firm to identify single points of failure, rationalize redundant applications, and demonstrate a clear line of sight from regulatory requirements to technology assets. This enterprise architecture alignment not only strengthens its operational resilience framework but also provides a quantifiable basis for prioritizing IT investment and managing technology lifecycle management, turning compliance from a cost center into a strategic advantage.
Drivers, Trends, and Challenges in the Business Capability Mapping Software Market
Enterprises are increasingly leveraging business capability mapping for digital transformation, moving beyond static diagrams to dynamic strategic assets. Using software for enterprise architecture visualization is now standard for organizations looking to gain a competitive edge. This involves aligning IT investment with business capabilities to ensure every dollar spent supports a strategic goal, a process critical for effective technology roadmap development.
A key application is creating a digital twin of an organization, which allows for sophisticated what-if analyses and strategic modeling. For example, an automotive manufacturer implementing a capability-based planning model uses its digital twin to simulate supply chain disruptions, a crucial step in building a robust operational resilience framework.
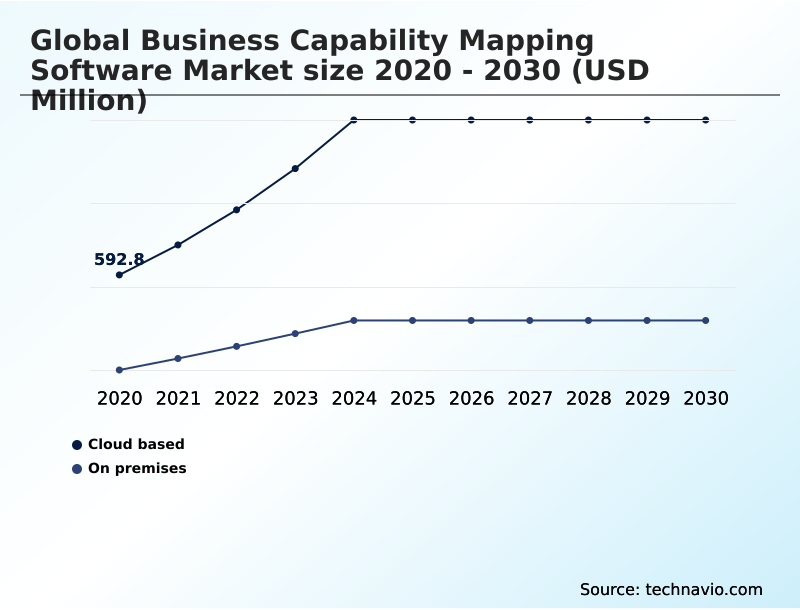
The firm is also measuring business capability maturity across its value chain to identify areas for automation. The growth of the cloud-based segment is significantly outpacing the on-premises segment, reflecting a broader shift. This is particularly relevant in capability mapping in financial services, where compliance with regulations like the Digital Operational Resilience Act (DORA) necessitates agile, data-driven architecture.
Strategic planning with capability models enables these firms to demonstrate compliance effectively. As a result, when conducting a business capability mapping tools comparison, firms now prioritize features that support dynamic, real-time analysis over simple documentation, a clear indicator of the market's evolving sophistication.
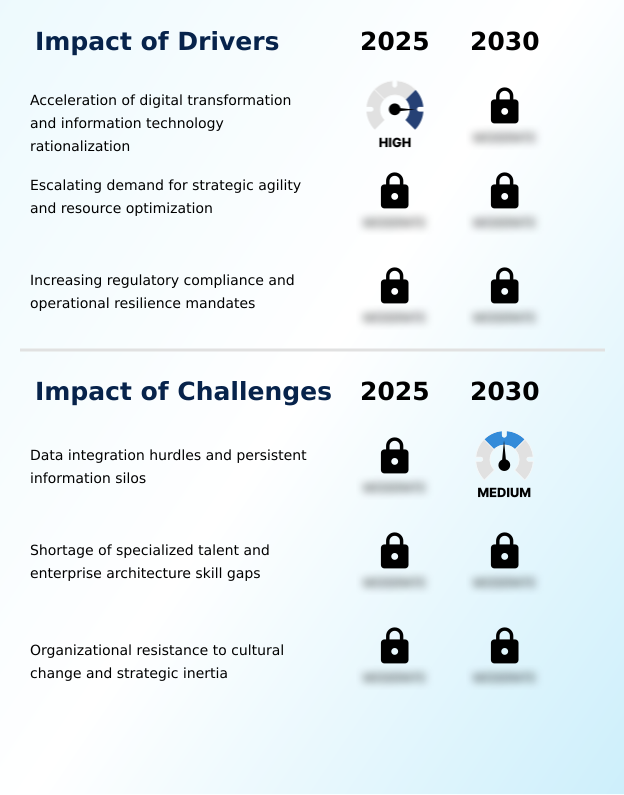
Primary Growth Driver: The acceleration of digital transformation initiatives and the corresponding need for information technology rationalization are the principal drivers for the market.
The urgent need for digital transformation and information technology rationalization is fueling the market's robust 14.2% year-over-year growth.
Enterprises are adopting these software solutions to create a clear digital transformation blueprint that enables effective business outcome management and IT investment alignment.
By mapping applications to specific functions, organizations can identify redundancies and optimize their IT landscape management, directly impacting their bottom line.
This structured approach to resource optimization is essential for companies navigating complex mergers and acquisitions, as it provides the clarity needed for a smooth integration of disparate technology ecosystems, ensuring that strategic goals are met efficiently.
Emerging Market Trend: A primary trend is the integration of artificial intelligence and machine learning to automate the discovery and mapping of organizational capabilities, shifting from manual documentation to data-driven insights.
The market is increasingly defined by the integration of AI and machine learning for automated mapping, a trend that is accelerating the adoption of cloud-based platforms. These SaaS solutions, which constitute a significant and fast-growing portion of the market, are becoming the standard for enterprises seeking to implement a dynamic, data-driven architecture.
This transition facilitates advanced strategic modeling and allows for a more effective business outcome management strategy. As organizations prioritize strategic agility, the ability of these platforms to offer real-time insights into the IT landscape and support complex organizational design is becoming a critical differentiator. This trend is central to the evolution from static documentation to living architectural models.
Key Industry Challenge: Persistent data integration hurdles and fragmented information silos create significant barriers to deploying software effectively and achieving a unified functional view of the enterprise.
A significant challenge restraining market growth is the persistent issue of fragmented data silos and the lack of a standardized enterprise architecture repository. This fragmentation complicates the process of building an accurate and reliable business architecture, often requiring significant manual effort to cleanse and integrate data before it can be used for strategic modeling.
Furthermore, a shortage of skilled professionals capable of performing sophisticated organizational design and value stream mapping creates a bottleneck for many organizations. This is particularly acute in high-growth regions like APAC, where a 17.8% CAGR indicates rapid adoption, but the available talent pool may struggle to keep pace with the demand for advanced architectural expertise.
Explore Full Market Dynamics Analysis Request Free Sample
Business Capability Mapping Software Market Segmentation
The business capability mapping software industry research report provides comprehensive data including region-wise segment analysis, with forecasts and analysis for the period 2026-2030, as well as historical data from 2020-2024 for the following segments.
Deployment Segment Analysis
The cloud based segment is estimated to witness significant growth during the forecast period.
Cloud-based deployment models are defining the Business Capability Mapping Software Market, driven by enterprise demand for scalable and agile solutions.
This segment's expansion is fueled by the need for effective cloud migration planning and streamlined IT landscape management without the high upfront capital expenditure of on-premises hardware.
As organizations prioritize data-driven architecture, SaaS platforms provide a centralized enterprise architecture repository accessible to distributed teams, facilitating real-time collaboration on strategic modeling.
This approach supports a more dynamic form of capability-based planning, allowing firms to adjust their digital transformation blueprint in response to market shifts, ensuring that organizational design remains aligned with strategic objectives.
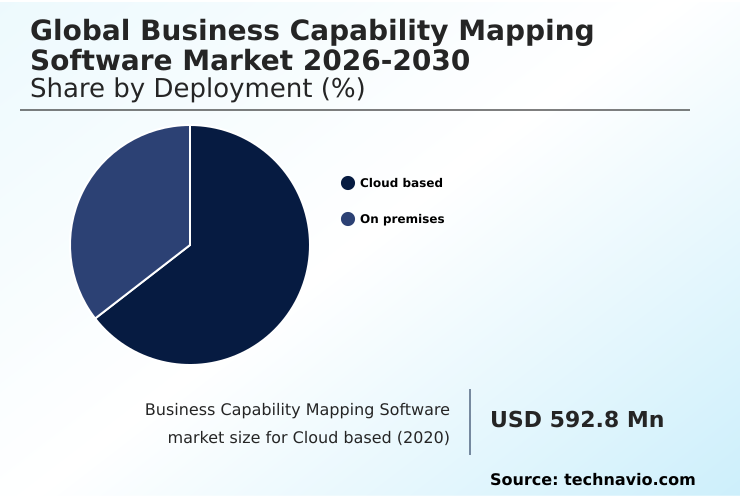
The Cloud based segment was valued at USD 1.03 billion in 2024 and showed a gradual increase during the forecast period.
Business Capability Mapping Software Market by Region: North America Leads with 42.5% Growth Share
North America is estimated to contribute 42.5% to the growth of the global market during the forecast period.
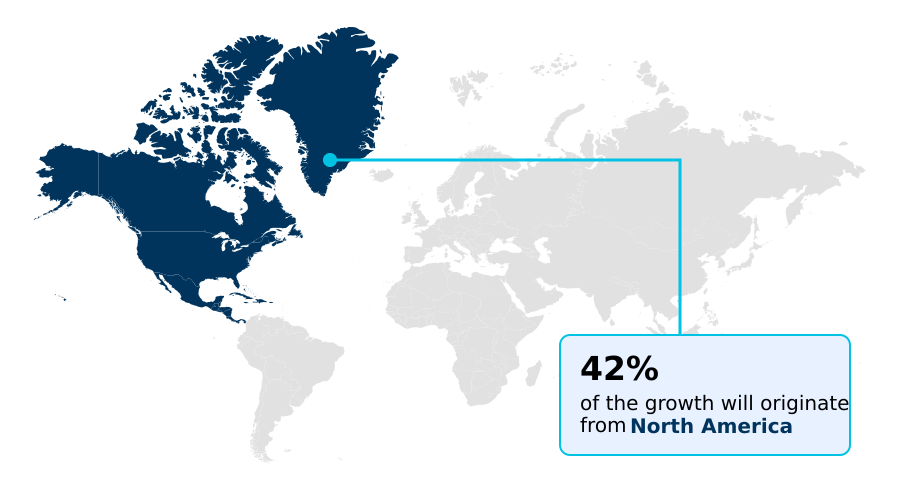
The geographic landscape of the Business Capability Mapping Software Market is led by North America, which accounts for approximately 42.5% of the global opportunity, driven by mature enterprises focused on IT rationalization and digital transformation blueprints.
In this region, a strong emphasis is placed on technology roadmap development and achieving a comprehensive digital twin of an organization.
Europe follows, contributing around 23.5%, with its market heavily influenced by regulatory compliance mapping to meet standards like the Digital Operational Resilience Act (DORA). The APAC region, representing about 25.2% of the opportunity, is the fastest-growing market.
Its expansion is fueled by widespread digital adoption and the need for scalable business architecture to manage rapid growth, particularly in sectors undergoing extensive cloud migration planning.
Customer Landscape Analysis for the Business Capability Mapping Software Market
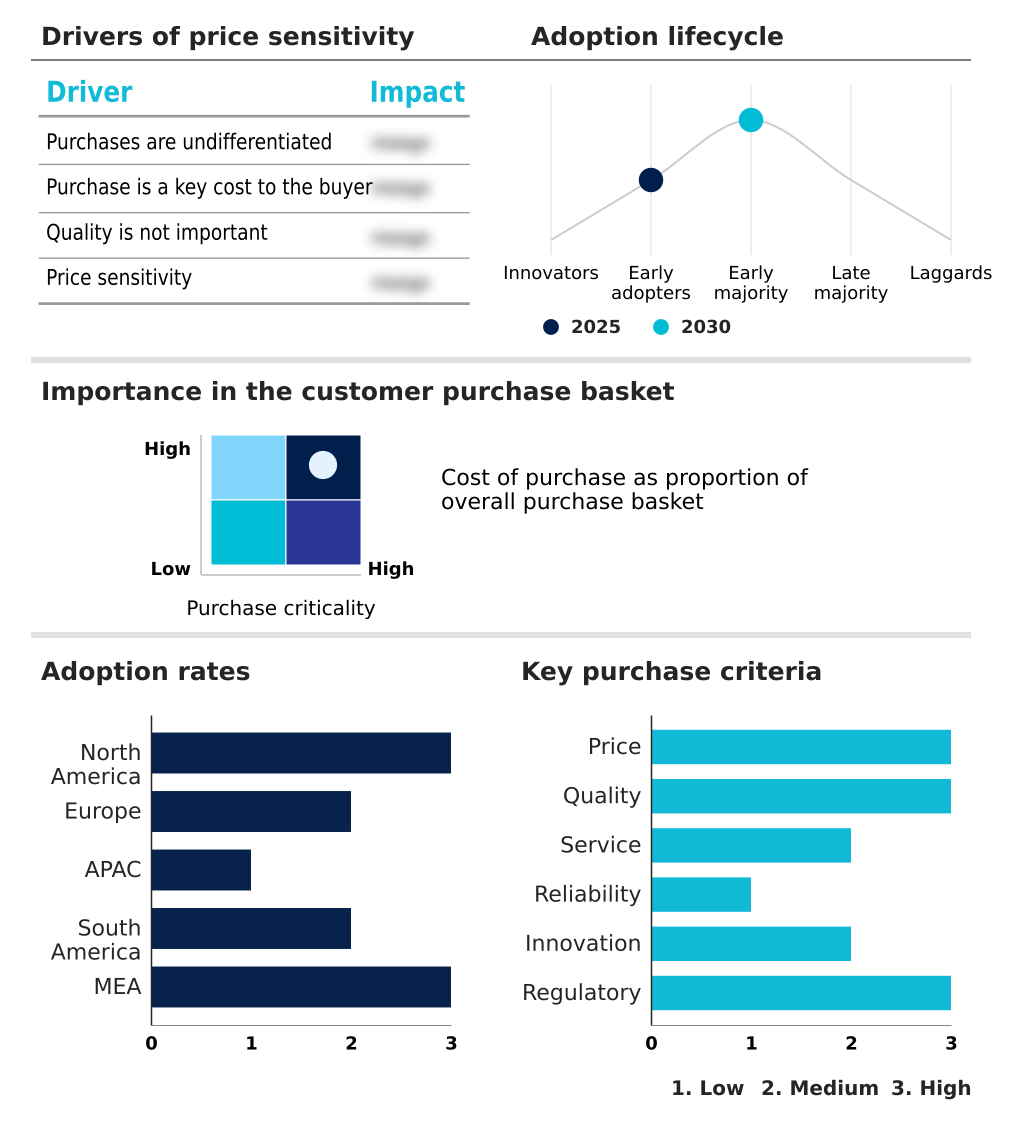
The business capability mapping software market forecasting report includes the adoption lifecycle of the market, covering from the innovator’s stage to the laggard’s stage. It focuses on adoption rates in different regions based on penetration. Furthermore, the business capability mapping software market report also includes key purchase criteria and drivers of price sensitivity to help companies evaluate and develop their market growth analysis strategies.
Competitive Landscape of the Business Capability Mapping Software Market
Companies are implementing various strategies, such as strategic alliances, partnerships, mergers and acquisitions, geographical expansion, and product/service launches, to enhance their presence in the business capability mapping software market industry.
Ardoq AS - Offerings center on data-driven enterprise architecture platforms, providing dynamic capability maps and automated insights for strategic planning, transformation, and governance risk compliance.
The industry research and growth report includes detailed analyses of the competitive landscape of the market and information about key companies, including:
- Ardoq AS
- Avolution Pty Ltd.
- Bizzdesign.
- IBM Corp.
- Mavim BV
- Microsoft Corp.
- Modeliosoft Information.
- Orbus Software Sp. z o.o
- Planview Inc.
- QualiWare ApS
- Quest Software Inc.
- SAP SE
- ServiceNow Inc.
- Software GmbH
- Sparx Systems Pty Ltd.
- Systems and Proposal Engineering
- Trisotech.
- UNICOM Systems Inc.
- ValueBlue B.V.
- Visual Paradigm.
Qualitative and quantitative analysis of companies has been conducted to help clients understand the wider business environment as well as the strengths and weaknesses of key industry players. Data is qualitatively analyzed to categorize companies as pure play, category-focused, industry-focused, and diversified; it is quantitatively analyzed to categorize companies as dominant, leading, strong, tentative, and weak.
Recent Developments in the Business Capability Mapping Software Market
- In August 2025, LeanIX launched a specialized strategic modeling feature that allows organizations to simulate the functional impact of potential mergers and acquisitions before a deal is finalized, enhancing due diligence processes.
- In November 2025, Orbus Software expanded its governance and compliance library to include automated templates for climate-related financial disclosures and ESG reporting, embedding sustainability into business capability frameworks.
- In February 2025, Ardoq announced the launch of an integrated AI strategy assistant that uses large language models to provide real-time suggestions for capability enhancements and automated application categorization.
- In March 2025, ServiceNow introduced an enhanced generative AI module within its Strategic Portfolio Management suite that automatically generates business capability maps by analyzing system usage patterns and metadata.
Research Analyst Overview: Business Capability Mapping Software Market
The market is evolving from a focus on static documentation to dynamic, data-driven architecture. The core function is now business capability modeling, used to enable strategic agility and proactive resource optimization. This shift is catalyzed by regulations like the Digital Operational Resilience Act (DORA), which forces boardroom-level decisions on technology investment to be directly linked to an operational resilience framework.
Consequently, tools that support enterprise architecture alignment and value stream mapping have become indispensable for governance, risk, and compliance. Modern platforms facilitate a comprehensive capability gap analysis and provide a clear technology roadmap for IT rationalization. The integration of generative AI is transforming application portfolio management, allowing for the automated creation of a digital twin of an organization.
This provides unparalleled insight, making capability-based planning not just a theoretical exercise but a practical tool for managing the entire business.
Dive into Technavio’s robust research methodology, blending expert interviews, extensive data synthesis, and validated models for unparalleled Business Capability Mapping Software Market insights. See full methodology.
| Market Scope | |
|---|---|
| Page number | 303 |
| Base year | 2025 |
| Historic period | 2020-2024 |
| Forecast period | 2026-2030 |
| Growth momentum & CAGR | Accelerate at a CAGR of 16.5% |
| Market growth 2026-2030 | USD 1933.5 million |
| Market structure | Fragmented |
| YoY growth 2025-2026(%) | 14.2% |
| Key countries | US, Canada, Mexico, Germany, UK, France, Italy, The Netherlands, Spain, China, India, Japan, South Korea, Australia, Indonesia, Brazil, Argentina, Colombia, Saudi Arabia, UAE, South Africa, Israel and Turkey |
| Competitive landscape | Leading Companies, Market Positioning of Companies, Competitive Strategies, and Industry Risks |
Business Capability Mapping Software Market: Key Questions Answered in This Report
-
What is the expected growth of the Business Capability Mapping Software Market between 2026 and 2030?
-
The Business Capability Mapping Software Market is expected to grow by USD 1.93 billion during 2026-2030, registering a CAGR of 16.5%. Year-over-year growth in 2026 is estimated at 14.2%%. This acceleration is shaped by acceleration of digital transformation and information technology rationalization, which is intensifying demand across multiple end-use verticals covered in the report.
-
-
What segmentation does the market report cover?
-
The report is segmented by Deployment (Cloud based, and On premises), Application (CGA and road mapping, SP and portfolio management, DT and IT rationalization, MAI and due diligence, and Others), Business Segment (Large enterprises, and Small and medium enterprises) and Geography (North America, Europe, APAC, South America, Middle East and Africa). Among these, the Cloud based segment is estimated to witness significant growth during the forecast period, driven by rising adoption across key application areas. Each segment includes detailed qualitative and quantitative analysis, along with historical data from 2020-2024 and forecasts through 2030 with year-over-year growth rates.
-
-
Which regions are analyzed in the report?
-
The report covers North America, Europe, APAC, South America and Middle East and Africa. North America is estimated to contribute 42.5% to market growth during the forecast period. Country-level analysis includes US, Canada, Mexico, Germany, UK, France, Italy, The Netherlands, Spain, China, India, Japan, South Korea, Australia, Indonesia, Brazil, Argentina, Colombia, Saudi Arabia, UAE, South Africa, Israel and Turkey, with dedicated market size tables and year-over-year growth for each.
-
-
What are the key growth drivers and market challenges?
-
The primary driver is acceleration of digital transformation and information technology rationalization, which is accelerating investment and industry demand. The main challenge is data integration hurdles and persistent information silos, creating operational barriers for key market participants. The report quantifies the impact of each driver and challenge across 2026 and 2030 with comparative analysis.
-
-
Who are the major players in the Business Capability Mapping Software Market?
-
Key vendors include Ardoq AS, Avolution Pty Ltd., Bizzdesign., IBM Corp., Mavim BV, Microsoft Corp., Modeliosoft Information., Orbus Software Sp. z o.o, Planview Inc., QualiWare ApS, Quest Software Inc., SAP SE, ServiceNow Inc., Software GmbH, Sparx Systems Pty Ltd., Systems and Proposal Engineering, Trisotech., UNICOM Systems Inc., ValueBlue B.V. and Visual Paradigm.. The report provides qualitative and quantitative analysis categorizing companies as dominant, leading, strong, tentative, and weak based on their market positioning. Company profiles include business segment analysis, SWOT assessment, key offerings, and recent strategic developments.
-
Business Capability Mapping Software Market Research Insights
Market dynamics are increasingly influenced by the dual pressures of achieving strategic agility and meeting stringent regulatory demands. As organizations adopt capability-based planning to navigate volatility, the need for robust strategic modeling and business architecture tools becomes critical. The market's 14.2% year-over-year growth underscores this urgency.
This momentum is particularly visible in North America, which is projected to contribute 42.5% of the market's growth, driven by early adoption and complex digital estates. Compliance mandates, such as the Digital Operational Resilience Act (DORA) in Europe, compel firms to implement a comprehensive business outcome management framework, ensuring that their IT landscape management practices can withstand operational disruptions.
This regulatory push elevates the software from a planning tool to a mandatory component of governance, risk, and compliance.
We can help! Our analysts can customize this business capability mapping software market research report to meet your requirements.
 RIA -
RIA - 
