
Butyraldehyde Market Size 2026-2030
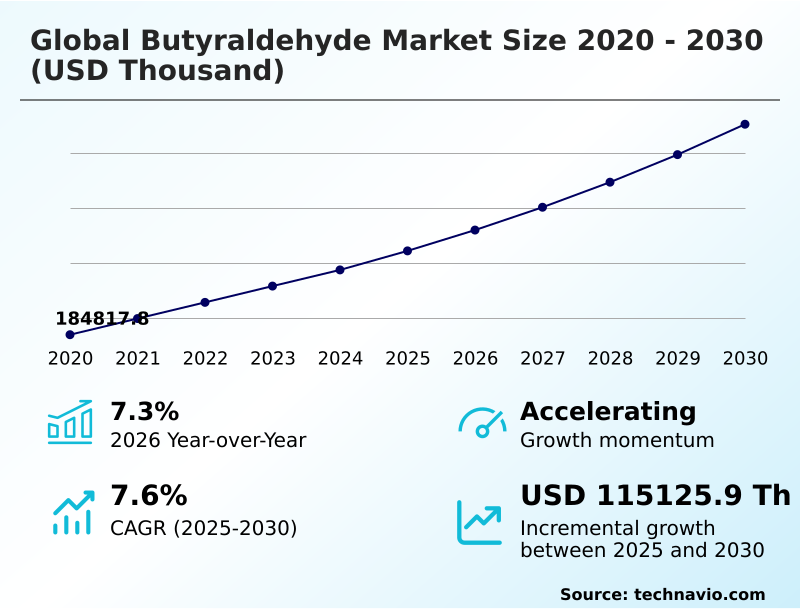
The butyraldehyde market size is valued to increase by USD 115.13 million, at a CAGR of 7.6% from 2025 to 2030. Institutionalization of advanced plasticizer synthesis for construction will drive the butyraldehyde market.
Major Market Trends & Insights
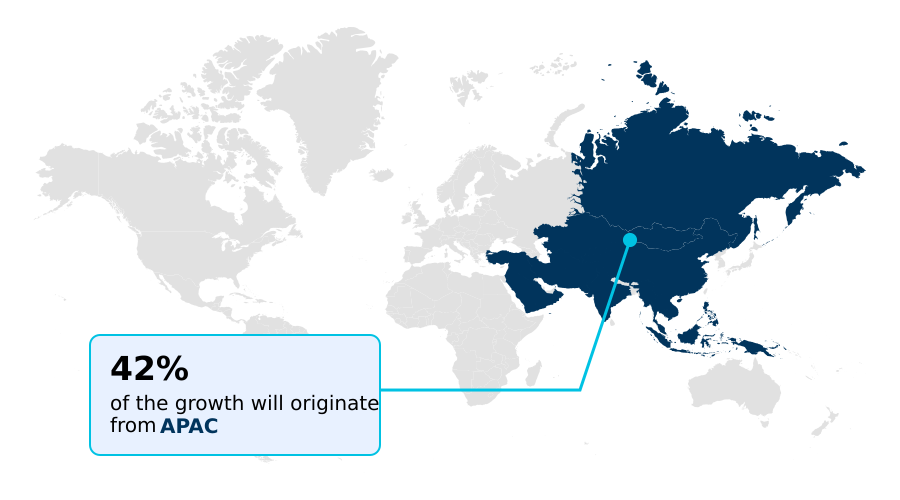
- APAC dominated the market and accounted for a 41.8% growth during the forecast period.
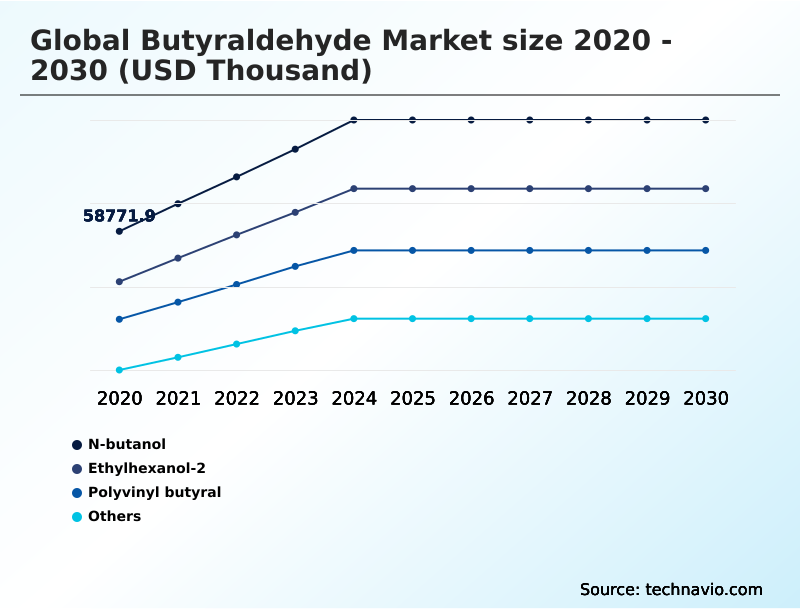
- By Type - N-butanol segment was valued at USD 78.97 million in 2024
- By Application - Chemical intermediate segment accounted for the largest market revenue share in 2024
Market Size & Forecast
- Market Opportunities:
- Market Future Opportunities: USD 115.13 million
- CAGR from 2025 to 2030 : 7.6%
Market Summary
- The butyraldehyde market is defined by the industrial-scale hydroformylation of propylene into n-butyraldehyde and isobutyraldehyde, which serve as foundational aliphatic aldehydes. These chemical intermediates are critical for producing derivatives such as n-butanol, 2-ethylhexanol, and polyvinyl butyral.
- Market dynamics are heavily influenced by demand from the construction and automotive sectors, which rely on these derivatives for high-performance plasticizers, including phthalate-free variants, and durable low-VOC coatings. A significant trend involves the strategic shift toward high-purity grades for pharmaceutical and agrochemical synthesis, alongside the adoption of sustainable production pathways to reduce environmental impact.
- For instance, a manufacturer must balance the production of commodity-grade aldehydes for polymer applications against high-margin specialty chemicals, all while mitigating supply chain risks associated with volatile propylene feedstock costs.
- This complex interplay between industrial demand, regulatory pressures, and technological innovation shapes the competitive landscape, pushing firms toward greater operational efficiency and a diversified product portfolio that includes advanced butyrated resins and eco-labeled polymer formulations to meet evolving end-user requirements.
What will be the Size of the Butyraldehyde Market during the forecast period?
Get Key Insights on Market Forecast (PDF) Get Free Sample
How is the Butyraldehyde Market Segmented?
The butyraldehyde industry research report provides comprehensive data (region-wise segment analysis), with forecasts and estimates in "USD thousand" for the period 2026-2030, as well as historical data from 2020-2024 for the following segments.
- Type
- N-butanol
- Ethylhexanol-2
- Polyvinyl butyral
- Others
- Application
- Chemical intermediate
- Rubber accelerator
- Synthetic resins
- Others
- End-user
- Paints and coatings
- Pharmaceuticals
- Agrochemicals
- Polymers
- Others
- Geography
- APAC
- China
- India
- Japan
- North America
- US
- Canada
- Mexico
- Europe
- Germany
- France
- UK
- South America
- Brazil
- Argentina
- Middle East and Africa
- Saudi Arabia
- UAE
- Turkey
- Rest of World (ROW)
- APAC
By Type Insights
The n-butanol segment is estimated to witness significant growth during the forecast period.
The n-butanol segment, a cornerstone of the oxo-alcohol value chain, is driven by its role as a versatile chemical intermediate and industrial solvent.
This aliphatic aldehyde derivative, produced via catalytic hydroformylation, is fundamental to the synthesis of butyl acrylate for high-performance coatings and adhesives. Demand is also robust for producing plasticizers like dioctyl terephthalate, which are critical in polymer applications.
As industrial solvent applications evolve, a shift toward bio-based n-butanol is gaining momentum, aligning with sustainability goals to reduce the carbon footprint reduction in chemicals across the chemical synthesis value chain.
This transition occurs as manufacturers navigate significant price pressures, with some key feedstocks experiencing double-digit percentage price increases, impacting the profitability of industrial-scale production and influencing procurement strategies.
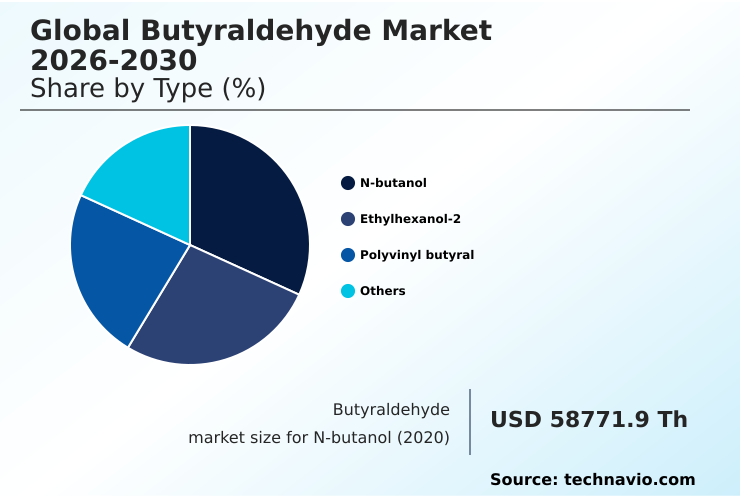
The N-butanol segment was valued at USD 78.97 million in 2024 and showed a gradual increase during the forecast period.
Regional Analysis
APAC is estimated to contribute 41.8% to the growth of the global market during the forecast period.Technavio’s analysts have elaborately explained the regional trends and drivers that shape the market during the forecast period.
See How Butyraldehyde Market Demand is Rising in APAC Get Free Sample
The geographic landscape of the butyraldehyde market is led by APAC, which accounts for over 41% of the incremental growth, driven by its expansive construction and automotive industries.
The high demand for polyvinyl butyral in the region for architectural safety glass and electric vehicles solidifies its dominant position. North America, contributing over 26% of market growth, focuses on high-purity chemical grades and specialty chemical precursors for advanced applications.
In this region, the adoption of digital twin technologies in chemical manufacturing is improving oxo-alcohol production efficiency by over 10%. European markets are distinguished by their adherence to circular economy principles and the development of water-borne coatings.
This regional diversification underscores the global need for a resilient supply chain and specialized products like rubber accelerators and butyrated resins to meet distinct industrial standards.
Market Dynamics
Our researchers analyzed the data with 2025 as the base year, along with the key drivers, trends, and challenges. A holistic analysis of drivers will help companies refine their marketing strategies to gain a competitive advantage.
- The evolution of the global butyraldehyde market 2026-2030 is increasingly shaped by specialized applications and advanced manufacturing protocols. A key focus is on carbon-efficient hydroformylation process development, which is critical for sustainable industrial-scale production. This trend supports the manufacturing of high-performance polyvinyl butyral resins, a cornerstone for laminated safety glass production.
- Downstream, the synthesis of n-butanol from n-butyraldehyde and the synthesis of 2-ethylhexanol from n-butyraldehyde remain high-volume activities, directly feeding into the production of butyraldehyde derivatives for phthalate-free plasticizers. The market dynamics of n-butyraldehyde versus isobutyraldehyde are also shifting, with specialized isobutyraldehyde chemical synthesis routes gaining prominence for butyraldehyde for neopentyl glycol production.
- Applications are diversifying, with strong demand for butyraldehyde for high-performance coatings and a growing role for butyraldehyde in automotive surface finishes. Furthermore, butyraldehyde use in pharmaceutical synthesis and as a butyraldehyde as a crop protection agent highlights a move toward high-value sectors.
- This pivot is a strategic response to challenges like the impact of propylene feedstock volatility on butyraldehyde and stringent regulatory compliance for butyraldehyde VOC emissions.
- Specializing in high-margin applications, such as butyraldehyde applications in synthetic lubricants or as a butyraldehyde as a rubber accelerator precursor, can yield margins up to 15 percentage points higher than commodity grades, fundamentally reshaping long-term operational and investment planning for manufacturers navigating this complex environment.
What are the key market drivers leading to the rise in the adoption of Butyraldehyde Industry?
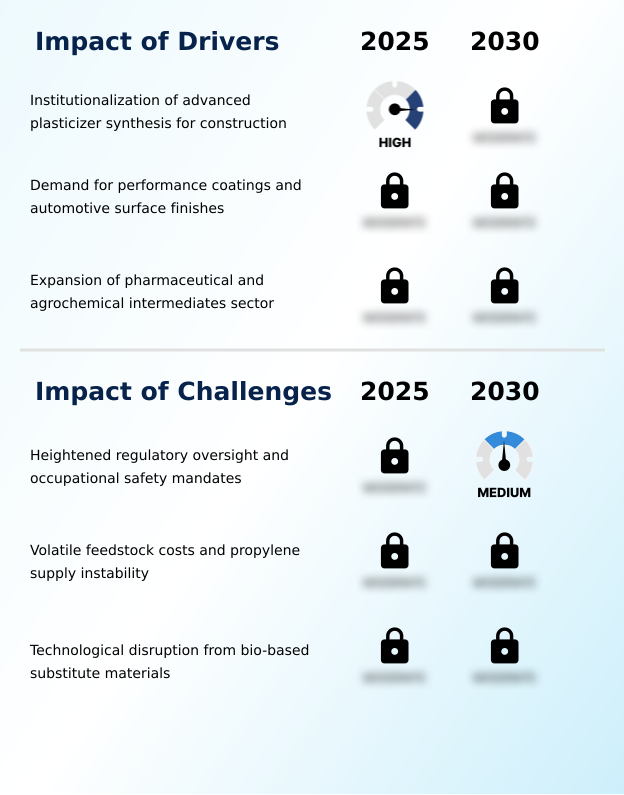
- The institutionalization of advanced plasticizer synthesis for the construction industry is a key driver for market growth.
- Market growth is significantly propelled by the institutionalization of advanced plasticizer synthesis for construction and infrastructure. Demand for high-performance plasticizers, particularly phthalate-free plasticizer variants derived from 2-ethylhexanol, has seen a consistent double-digit annual increase in key urbanizing regions.
- Concurrently, the automotive sector's need for durable automotive surface finishes fuels the consumption of n-butanol for resins and coatings formulation. Beyond these industrial mainstays, the expansion of high-value sectors provides substantial momentum.
- The use of butyraldehyde as one of the key pharmaceutical synthesis intermediates and for creating agrochemical active ingredients is growing rapidly, with these segments registering growth rates 3-5 percentage points higher than traditional industrial chemical intermediates, underscoring a strategic shift toward high-margin applications.
What are the market trends shaping the Butyraldehyde Industry?
- A key market trend is the industrialization of carbon-efficient hydroformylation processes. This shift aligns with international decarbonization mandates and the need to reduce greenhouse gas emissions.
- A defining trend is the pivot toward sustainable chemical derivatives and eco-labeled polymer formulations, driven by the adoption of green catalytic processes. Manufacturers are industrializing carbon-efficient hydroformylation of n-butyraldehyde, with new rhodium-based catalyst systems reducing energy intensity by up to 20% compared to legacy methods. This shift is coupled with a focus on molecular precision synthesis for specialty oxo-derivatives.
- For instance, the demand for isobutyraldehyde is surging for its use in neopentyl glycol, a precursor for high-performance powder coatings and synthetic lubricants. Advanced purification techniques are improving final product purity by 5-8%, meeting the stringent requirements of high-value applications. This move toward low-carbon hydrogen feedstocks reflects a broader industry commitment to environmental stewardship while enhancing profitability in niche segments.
What challenges does the Butyraldehyde Industry face during its growth?
- Heightened regulatory oversight and occupational safety mandates present a key challenge affecting industry growth.
- A primary market challenge is the persistent feedstock cost volatility, particularly the instability of the propylene feedstock supply chain. A recent twenty-two percent spike in regional olefin prices severely compressed margins for producers of butyrated resins, demonstrating the market's vulnerability.
- This is compounded by heightened regulatory pressures and occupational safety mandates concerning volatile organic compound emissions, which require capital-intensive upgrades to the oxo process infrastructure. The threat from bio-based propylene alternatives and advanced polymer formulations also pressures legacy producers.
- Firms relying on traditional hydrocarbon cracking and aldehyde hydrogenation face increasing competition from innovators who can offer low-VOC coatings and other green products, forcing a strategic re-evaluation of long-term investments in conventional synthesis gas technologies.
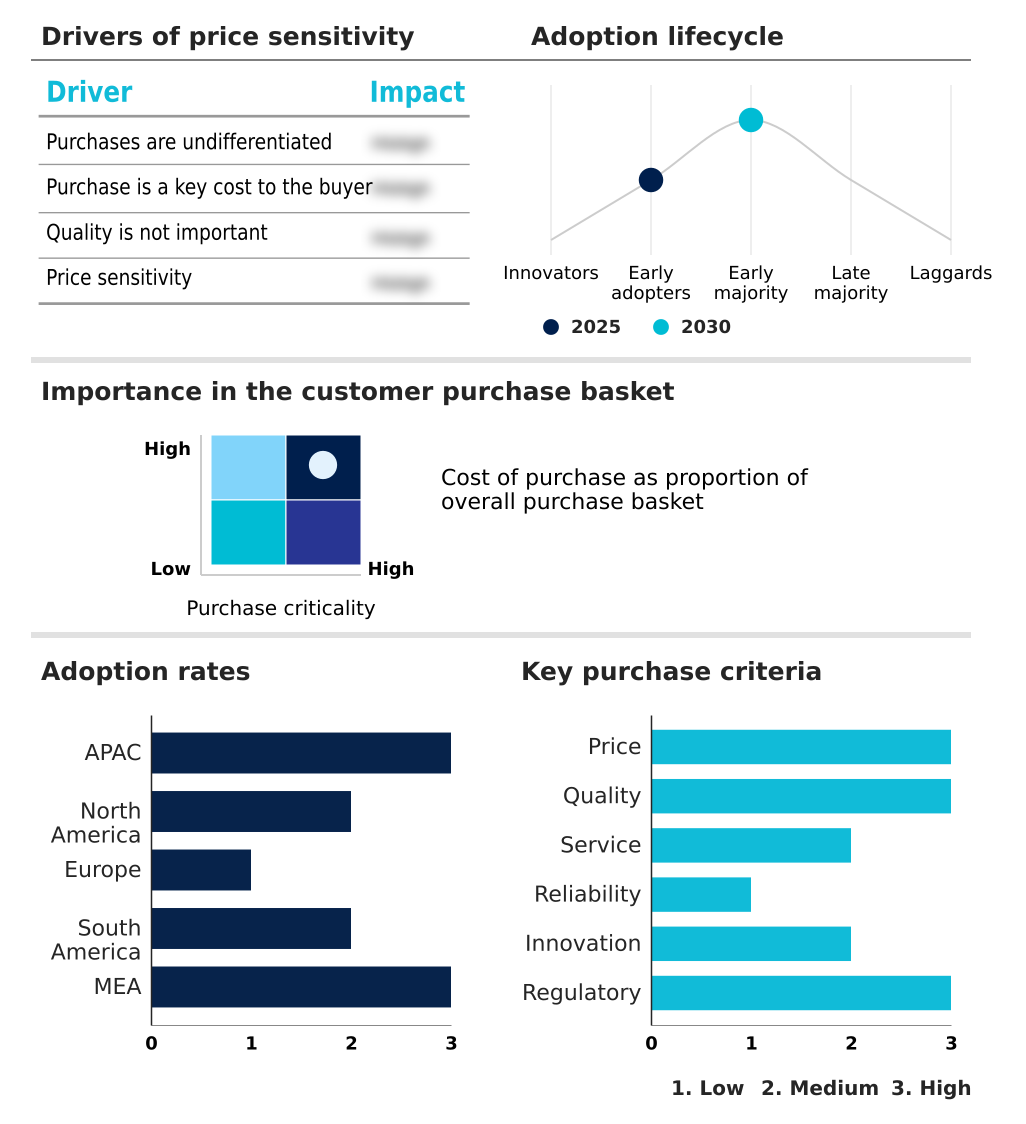
Exclusive Technavio Analysis on Customer Landscape
The butyraldehyde market forecasting report includes the adoption lifecycle of the market, covering from the innovator’s stage to the laggard’s stage. It focuses on adoption rates in different regions based on penetration. Furthermore, the butyraldehyde market report also includes key purchase criteria and drivers of price sensitivity to help companies evaluate and develop their market growth analysis strategies.
Customer Landscape of Butyraldehyde Industry
Competitive Landscape
Companies are implementing various strategies, such as strategic alliances, butyraldehyde market forecast, partnerships, mergers and acquisitions, geographical expansion, and product/service launches, to enhance their presence in the industry.
Aurochemicals - Offers n-butyraldehyde and isobutyraldehyde as foundational oxo intermediates for plastics, coatings, and chemical synthesis, enabling diverse industrial applications.
The industry research and growth report includes detailed analyses of the competitive landscape of the market and information about key companies, including:
- Aurochemicals
- BASF SE
- ChemSrc
- Dow Chemical Co.
- KH Neochem Co. Ltd.
- Eastman Chemical Co.
- LGC Ltd.
- Loba Chemie Pvt. Ltd.
- Merck KGaA
- Mitsubishi Chemical Corp.
- National Analytical Corp.
- Otto Chemie Pvt. Ltd.
- OXEA GmbH
- Perstorp Holding AB
- Santa Cruz Biotechnology Inc.
- Solstice Advanced Materials
- Spectrum Chemical Mfg. Corp.
- Thermo Fisher Scientific Inc.
- Tokyo Chemical Industry Co.
- Xiamen Hisunny Chemical Co Ltd.
Qualitative and quantitative analysis of companies has been conducted to help clients understand the wider business environment as well as the strengths and weaknesses of key industry players. Data is qualitatively analyzed to categorize companies as pure play, category-focused, industry-focused, and diversified; it is quantitatively analyzed to categorize companies as dominant, leading, strong, tentative, and weak.
Recent Development and News in Butyraldehyde market
- In March 2025, OQ SAOC implemented strategic price increases for its oxo intermediates, including n-butyraldehyde and isobutyraldehyde, to account for shifting market dynamics and elevated operating costs.
- In February 2025, BASF SE released its comprehensive performance report, detailing a strategic pivot toward a green transformation and targeted measures to reduce carbon emissions across its chemical segments.
- In January 2025, Eastman Chemical Co. reported significant progress in its cost-reduction initiatives, successfully optimizing domestic manufacturing assets to maintain competitive pricing for n-butyraldehyde and isobutyraldehyde.
- In November 2024, The European Chemicals Agency approved the formal renewal of the registration for butyraldehyde, ensuring its continued production and legal utilization within the European industrial landscape.
Dive into Technavio’s robust research methodology, blending expert interviews, extensive data synthesis, and validated models for unparalleled Butyraldehyde Market insights. See full methodology.
| Market Scope | |
|---|---|
| Page number | 314 |
| Base year | 2025 |
| Historic period | 2020-2024 |
| Forecast period | 2026-2030 |
| Growth momentum & CAGR | Accelerate at a CAGR of 7.6% |
| Market growth 2026-2030 | USD 115125.9 thousand |
| Market structure | Fragmented |
| YoY growth 2025-2026(%) | 7.3% |
| Key countries | China, India, Japan, South Korea, Indonesia, Australia, US, Canada, Mexico, Germany, France, UK, Italy, The Netherlands, Spain, Brazil, Argentina, Chile, Saudi Arabia, UAE, Turkey, South Africa and Israel |
| Competitive landscape | Leading Companies, Market Positioning of Companies, Competitive Strategies, and Industry Risks |
Research Analyst Overview
- The butyraldehyde market is fundamentally shaped by the oxo process, involving the catalytic hydroformylation of propylene feedstock with synthesis gas. This process, often utilizing advanced rhodium-based catalyst systems, yields n-butyraldehyde and its isomer, isobutyraldehyde. As a critical aliphatic aldehyde and chemical intermediate, its derivatives define numerous downstream industries.
- Aldehyde hydrogenation leads to n-butanol and 2-ethylhexanol, which are vital for plasticizer synthesis to create products like dioctyl phthalate and its phthalate-free plasticizer alternatives such as dioctyl terephthalate. Other derivatives include polyvinyl butyral for laminated safety glass, neopentyl glycol for powder coatings, and trimethylolpropane for synthetic lubricants.
- The market is also seeing growth in butyrated resins, glycol ethers, and butyl acrylate for low-VOC coatings and water-borne coatings. Boardroom decisions are increasingly focused on balancing the production of these chemicals—from unsaturated polyester resins to compounds for vulcanization process—with sustainability mandates.
- Investment in greener hydrocarbon cracking technologies is escalating, driven by the potential for nine-figure operational savings and the need to create advanced materials like those used in crop protection agents and active pharmaceutical ingredients.
What are the Key Data Covered in this Butyraldehyde Market Research and Growth Report?
-
What is the expected growth of the Butyraldehyde Market between 2026 and 2030?
-
USD 115.13 million, at a CAGR of 7.6%
-
-
What segmentation does the market report cover?
-
The report is segmented by Type (N-butanol, Ethylhexanol-2, Polyvinyl butyral, and Others), Application (Chemical intermediate, Rubber accelerator, Synthetic resins, and Others), End-user (Paints and coatings, Pharmaceuticals, Agrochemicals, Polymers, and Others) and Geography (APAC, North America, Europe, South America, Middle East and Africa)
-
-
Which regions are analyzed in the report?
-
APAC, North America, Europe, South America and Middle East and Africa
-
-
What are the key growth drivers and market challenges?
-
Institutionalization of advanced plasticizer synthesis for construction, Heightened regulatory oversight and occupational safety mandates
-
-
Who are the major players in the Butyraldehyde Market?
-
Aurochemicals, BASF SE, ChemSrc, Dow Chemical Co., KH Neochem Co. Ltd., Eastman Chemical Co., LGC Ltd., Loba Chemie Pvt. Ltd., Merck KGaA, Mitsubishi Chemical Corp., National Analytical Corp., Otto Chemie Pvt. Ltd., OXEA GmbH, Perstorp Holding AB, Santa Cruz Biotechnology Inc., Solstice Advanced Materials, Spectrum Chemical Mfg. Corp., Thermo Fisher Scientific Inc., Tokyo Chemical Industry Co. and Xiamen Hisunny Chemical Co Ltd.
-
Market Research Insights
- The butyraldehyde market operates within a dynamic oxo-alcohol value chain, where aliphatic aldehyde synthesis is fundamental to producing industrial chemical intermediates. These precursors are vital for high-demand products like laminated safety glass and automotive surface finishes.
- However, the sector faces significant financial pressures; for example, a recent twenty-two percent spike in regional olefin prices directly impacted margins for downstream high-performance plasticizers. In response, firms are innovating to enhance supply chain resilience. The adoption of advanced catalyst systems has enabled some producers to achieve a 10-15% reduction in energy intensity during synthesis.
- This efficiency gain helps offset feedstock cost volatility and supports the industry's alignment with circular economy principles and sustainable chemical derivatives, reinforcing the market's long-term stability.
We can help! Our analysts can customize this butyraldehyde market research report to meet your requirements.
 RIA -
RIA - 
