Cable Ties Market - 2021-2025
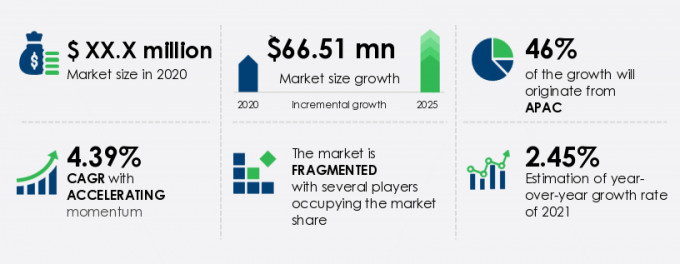
The cable ties market size is expected to grow by USD 66.51 million during 2020-2025 at a CAGR of 4.39%. This research study helps in a deep understanding of the underlying forces driving the market growth and current and potential target customers across segmentations. According to our comprehensive survey, factors such as increased incorporation of heat stabilized materials with cable ties are projected to significantly support market growth during the forecast period.

To Unlock the Cable Ties Market Size for 2021 and Other Important Statistics Wait no Longer!
Complete the Payment and Get this Report Within a Minute!
Cable Ties Market Segments
Navigate through market segmentation by end-user (electrical and electronics, retail goods, construction, food and beverages, and others), material (nylon, metal, and others), and geography (APAC, North America, Europe, South America, and MEA) in this cable ties market report to pursue growth opportunities.
Get actionable insights on the cable ties market segments to generate successful ROIs and focus your business strategy efforts where they are most likely to be effective. Also, our market research experts have evaluated the impact of COVID-19 across market segments for our clients to understand the long-term business implications and foresee opportunities for subsequent recovery. Want a thorough qualitative and quantitative analysis on the post-pandemic cable ties market predictions on-demand changes for 2021-2025?
Cable Ties Market Vendors and Competitive Analysis
|
The cable ties market is fragmented and the vendors are deploying growth strategies such as acquiring small vendors to gain a competitive advantage. The unprecedented outbreak of COVID-19 last year impacted market segments that has had a ripple effect on various stakeholders. To make the most of the opportunities and recover from post COVID-19 impact, the market vendors should focus more on the growth prospects in the fast-growing segments, while maintaining their positions in the slow-growing segments. |
 Cable Ties Market - Region Opportunities 2021-2025
46% of the cable ties market growth will originate from APAC during the forecast period. China and Japan are the key markets for cable ties in APAC.
APAC has been exhibiting a significant growth rate for cable ties market vendors. Factors such as increasing demand from the construction, food and beverages, and electrical and electronics industries are accelerating the cable ties market growth in APAC. The cable ties market share growth in APAC will be faster than the growth of the market in other regions.
 Cable Ties Market Insights by End-user
To gain further insights on the market contribution of various segments Request for a FREE Sample!
The cable ties market share growth by the electrical and electronics segment will be significant during the forecast period. The growth of the 5G network, which is the latest mobile wireless technology and an upgraded version of the previous 4G network, will support the development of the global cable ties market by the electrical and electronics segment. This report provides an accurate prediction of the contribution of all the segments to the growth of the cable ties market size.
From the cable ties market segmentation insights, players can achieve maximum market response by understanding the target consumers. The analytical data on the segmentation will allow vendors to position their services and products among the right audiences and gain significant exposure and growth.
Cable Ties Market Drivers & Trends
While it is crucial to have a solid understanding of the drivers and trends, it is also imperative that the market challenges are recognized to improvize business planning and sustain market competition. One of the key factors impeding cable ties market growth is volatility in raw material prices.
|
Increased incorporation of heat stabilized materials with cable ties is a key driver augmenting the cable ties market growth. The cable ties with heat stabilized materials are used in applications wherein resistance to higher temperatures is required. These ties are cost-effective and durable and are specially designed for use in harsh environmental conditions. Cable ties made of materials such as nylon, when combined with heat stabilizing materials, offer better resistance to heat both in high temperatures and outdoor areas. The material also provides fasteners with a low-profile and smooth look. Additionally, they are capable of providing a better tensioning range to the cable ties. The nylon ties are also considered as alternatives to metal ties because the nylon ties cost lower and have less installation time. This is encouraging vendors to offer cable ties with heat-stabilized materials. Hence, cable ties made with heat stabilized materials will see an increased demand during the forecast period. |
This cable ties market analysis report provides detailed information on key trends, drivers, and challenges that is the essence of business planning and strengthening marketing strategies across regions and segmentations.
Need a Customized Report? Get in touch
Cable Ties Market Report Outlook
- CAGR of the market during the forecast period 2021-2025
- Detailed information on factors that will drive cable ties market growth during the next five years
- Precise estimation of the cable ties market size and its contribution to the parent market
- Accurate predictions on upcoming trends and changes in consumer behavior
- The growth of the cable ties market across APAC, North America, Europe, South America, and MEA
- A thorough analysis of the market’s competitive landscape and detailed information on vendors
- Comprehensive details of factors that will challenge the growth of cable ties market vendors
Buy the Cable Ties Market report now to reimage your business strategies!
|
Cable Ties Market Scope |
|
|
Report Coverage |
Details |
|
Page number |
120 |
|
Base year |
2020 |
|
Forecast period |
2021-2025 |
|
Growth momentum & CAGR |
Accelerate at a CAGR of 4% |
|
Market growth 2021-2025 |
USD 66.51 million |
|
Market structure |
Fragmented |
|
YoY growth (%) |
2.45 |
|
Regional analysis |
APAC, North America, Europe, South America, and MEA |
|
Performing market contribution |
APAC at 46% |
|
Key consumer countries |
US, China, Germany, Japan, and UK |
|
Competitive landscape |
Leading companies, competitive strategies, consumer engagement scope |
|
Companies profiled |
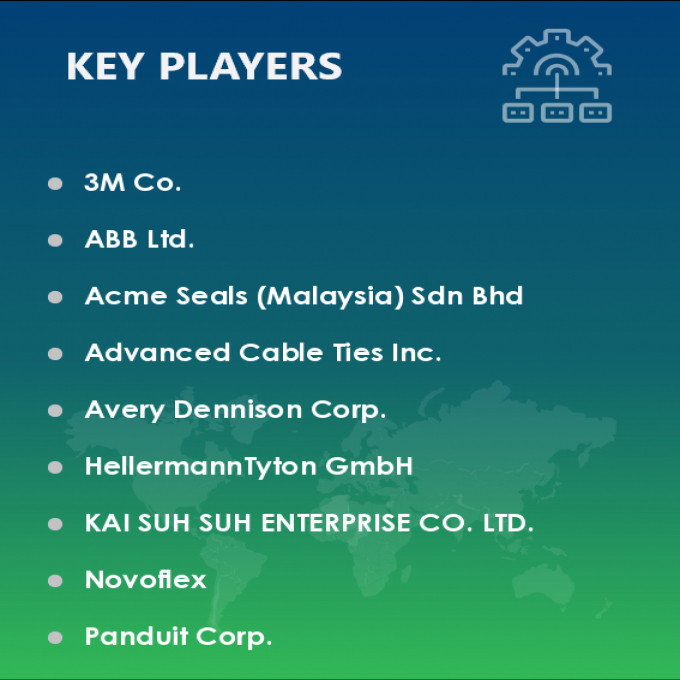
3M Co., ABB Ltd., Acme Seals (Malaysia) Sdn Bhd, Advanced Cable Ties Inc., Avery Dennison Corp., HellermannTyton GmbH, KAI SUH SUH ENTERPRISE CO. LTD., Novoflex, Panduit Corp., and Partex Marking Systems UK Ltd. |
|
Market Dynamics |
Parent market analysis, Market growth inducers and obstacles, Fast-growing and slow-growing segment analysis, COVID 19 impact and future consumer dynamics, market condition analysis for forecast period, |
|
Customization purview |
If our report has not included the data that you are looking for, you can reach out to our analysts and get segments customized. |


