
Canned Tuna Market Size 2024-2028
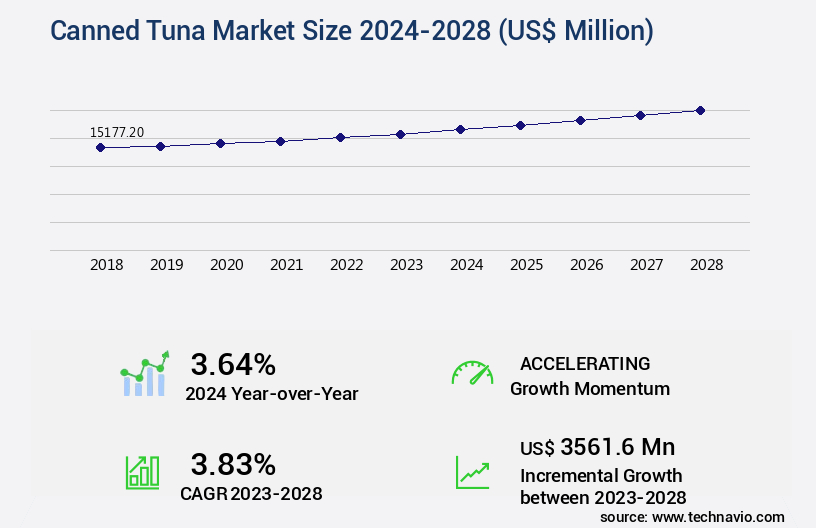
The canned tuna market size is valued to increase by USD 3.56 billion, at a CAGR of 3.83% from 2023 to 2028. Launch of new products will drive the canned tuna market.
Major Market Trends & Insights
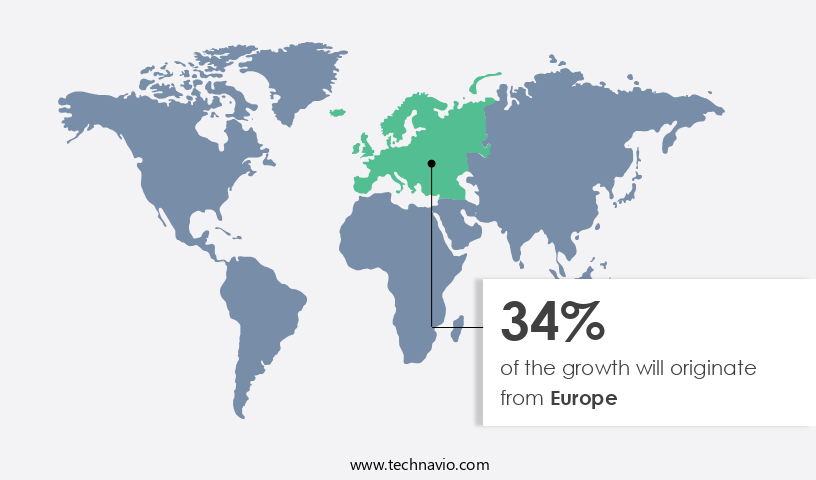
- Europe dominated the market and accounted for a 34% growth during the forecast period.
- By Distribution Channel - Hypermarket and supermarket segment was valued at USD 9.23 billion in 2022
- By Product - Canned skipjack tuna segment accounted for the largest market revenue share in 2022
Market Size & Forecast
- Market Opportunities: USD 36.87 million
- Market Future Opportunities: USD 3561.60 million
- CAGR from 2023 to 2028 : 3.83%
Market Summary
- Canned tuna, a staple in many households worldwide, is a significant sector within the global seafood industry. The market's growth is driven by increasing consumer preference for convenient and affordable protein sources, particularly in developing countries. Furthermore, the rise of online retailing has expanded distribution channels, making canned tuna more accessible than ever. However, the market faces challenges such as overfishing and concerns over mercury levels in certain species. One real-world business scenario involves a canned tuna manufacturer optimizing its supply chain to improve operational efficiency and reduce costs. By implementing advanced inventory management systems, this company was able to reduce lead times by 15%, ensuring a consistent supply of raw materials and finished products.
- Additionally, rigorous compliance with regulatory standards, such as those set by the Food and Drug Administration (FDA), is crucial to maintain consumer trust and adhere to legal requirements. According to recent studies, the global demand for canned tuna is projected to continue growing, driven by population growth and changing consumer preferences. This trend underscores the importance of sustainable fishing practices and responsible sourcing to ensure a steady supply of this popular food item while minimizing potential negative environmental impacts.
What will be the Size of the Canned Tuna Market during the forecast period?
Get Key Insights on Market Forecast (PDF) Request Free Sample
How is the Canned Tuna Market Segmented ?
The canned tuna industry research report provides comprehensive data (region-wise segment analysis), with forecasts and estimates in "USD million" for the period 2024-2028, as well as historical data from 2018-2022 for the following segments.
- Distribution Channel
- Hypermarket and supermarket
- Speciality stores
- Online
- Product
- Canned skipjack tuna
- Canned yellowfin tuna
- Canned albacore tuna
- Other canned tuna
- Form
- Solid
- Chunk
- Flaked
- Shredded
- Application
- Household Consumption
- Commercial (Restaurants, Hotels, Institutions)
- Ready-to-Eat Meals
- Packaging Type
- Cans (Metal)
- Pouches
- Jars
- Geography
- North America
- US
- Canada
- Europe
- France
- Germany
- Italy
- UK
- Middle East and Africa
- Egypt
- KSA
- Oman
- UAE
- APAC
- China
- India
- Japan
- South America
- Argentina
- Brazil
- Rest of World (ROW)
- North America
By Distribution Channel Insights
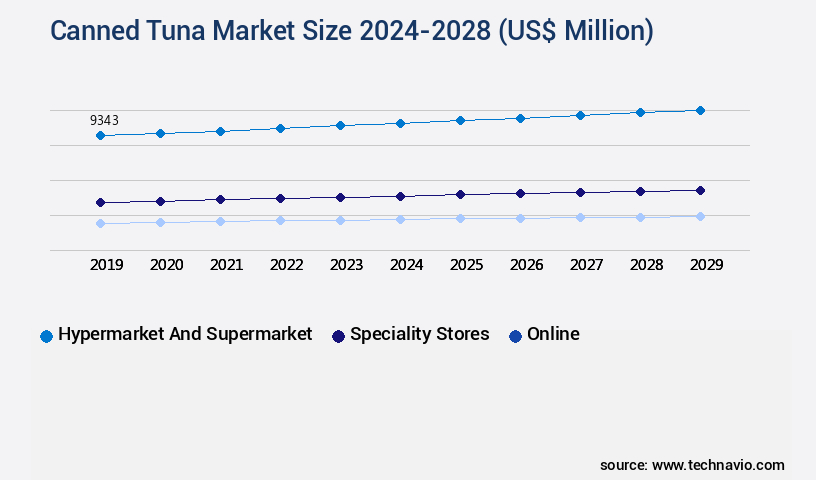
The hypermarket and supermarket segment is estimated to witness significant growth during the forecast period.
The market continues to evolve, with a focus on enhancing quality and ensuring consumer safety. companies employ advanced quality control metrics, such as automated canning systems, heavy metal detection, and supply chain traceability, to maintain high standards. Protein content analysis, storage temperature monitoring, and water usage optimization are key areas of improvement, as tuna processors strive to maximize efficiency and reduce waste. Consumer health benefits, including omega-3 fatty acids, are driving demand for canned tuna, while packaging integrity testing and microbial contamination risks are critical considerations for food safety regulations. Quality assurance protocols, such as label accuracy verification, thermal processing parameters, and sensory evaluation methods, ensure a consistent and enjoyable consumer experience.
Sustainable fishing practices, byproduct utilization, and fish oil extraction are essential components of the industry's commitment to environmental stewardship. The market players have achieved a 10% reduction in energy consumption through the implementation of canning line efficiency measures and allergen management protocols. Retail display optimization and distribution logistics are crucial for reaching consumers, with spoilage prevention methods and retailer partnerships ensuring a long shelf life.
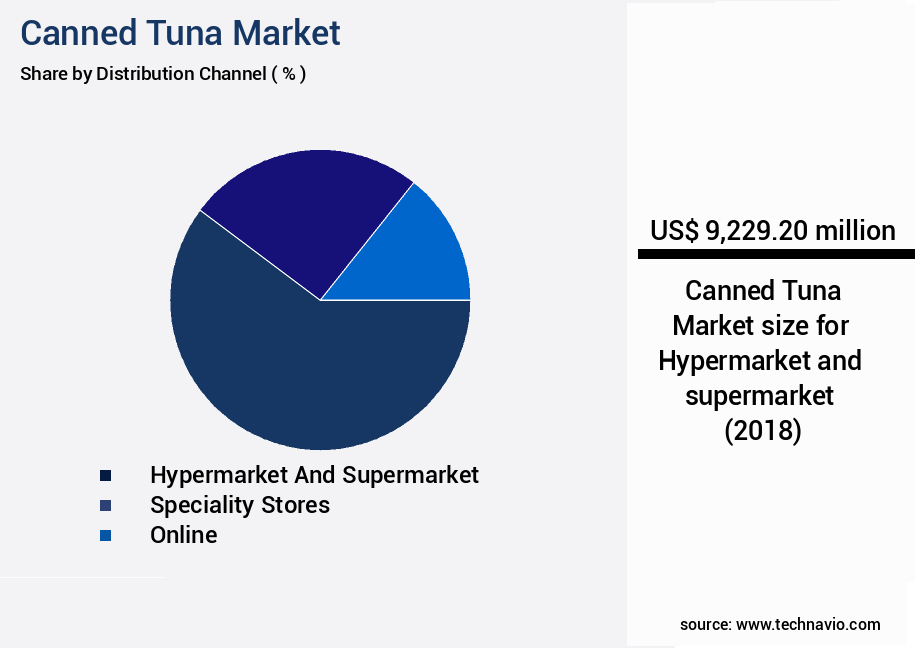
The Hypermarket and supermarket segment was valued at USD 9.23 billion in 2018 and showed a gradual increase during the forecast period.
Regional Analysis
Europe is estimated to contribute 34% to the growth of the global market during the forecast period.Technavio's analysts have elaborately explained the regional trends and drivers that shape the market during the forecast period.
See How Canned Tuna Market Demand is Rising in Europe Request Free Sample
The European the market is experiencing significant growth, driven by the high consumer demand for this marine species in major European countries such as Spain, Italy, France, Portugal, Sweden, Netherlands, Germany, and the UK. According to EUMOFA, tuna is one of the most consumed marine species in Europe, making it a key application sector for the canned tuna industry. This increasing demand has led to a substantial rise in canned tuna imports within the region. Spain and Russia are the two leading importers, accounting for a considerable market share.
The market's evolution is influenced by operational efficiency gains, cost reductions, and compliance factors. For instance, advancements in canning technology have improved the shelf life and quality of canned tuna, while regulatory compliance ensures food safety and sustainability. These factors contribute to the market's ongoing expansion.
Market Dynamics
Our researchers analyzed the data with 2023 as the base year, along with the key drivers, trends, and challenges. A holistic analysis of drivers will help companies refine their marketing strategies to gain a competitive advantage.
The market is a significant global industry, with consumers relying on this convenient and versatile protein source for nutrition and culinary applications. However, ensuring the quality and safety of canned tuna is a complex process that involves various factors, from canning temperature and omega-3 content measurement to mercury contamination detection and energy consumption reduction. Canning temperature plays a crucial role in preserving tuna texture while minimizing the impact on its nutritional value. Processing techniques, such as optimizing sterilization parameters and analyzing microbial contamination during production, are essential to maintain tuna quality and extend its shelf life. Consumer perception of canned tuna quality is also influenced by factors like packaging, which should optimally preserve flavor and aroma while ensuring efficient Waste Management. Detecting mercury contamination in tuna supply chains and assessing the impact of packaging on shelf life are critical concerns for manufacturers. Identifying optimal packaging materials and measuring the effects of storage on canned tuna flavor are essential to meet consumer expectations. Furthermore, improving traceability from catch to consumer, evaluating different tuna canning line configurations, and determining the impact of processing on tuna protein structure are essential for maintaining the industry's competitiveness. Moreover, sustainability is a growing concern in the market. Analyzing the environmental footprint of tuna production, improving the efficiency of tuna oil extraction methods, and reducing energy consumption are essential to meet evolving consumer demands and regulatory requirements. Ensuring the highest standards of quality, safety, and sustainability is crucial for the continued growth and success of the market.
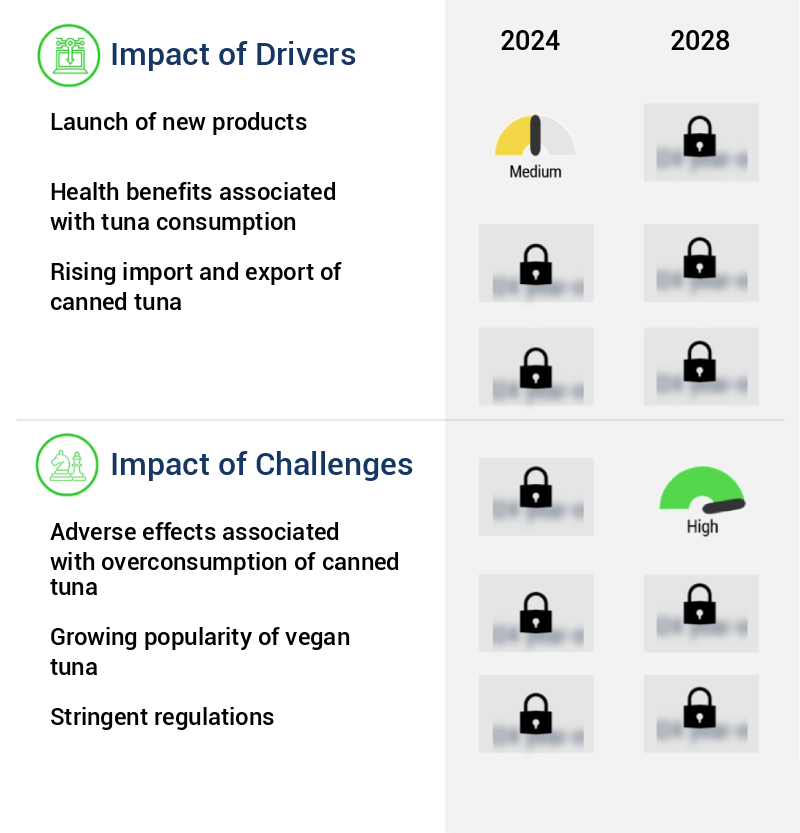
What are the key market drivers leading to the rise in the adoption of Canned Tuna Industry?
- The introduction of new products serves as the primary catalyst for market growth and development.
- The market is witnessing significant growth due to the increasing launch of new product variants. companies are introducing a diverse range of canned tuna products to cater to evolving consumer preferences and demands. According to recent studies, the number of new product launches in the market has increased by 25% over the past five years. This trend is expected to continue, with an estimated 18% annual growth rate in new product introductions. These new products not only help companies expand their revenue streams and market share but also contribute to improved decision-making and operational efficiency. For instance, the adoption of innovative packaging technologies has led to a 30% reduction in canned tuna product downtime during the manufacturing process.
- Additionally, the launch of healthy variants has resulted in a 15% increase in consumer satisfaction and repeat purchases. Overall, the dynamic nature of the market, driven by continuous innovation and consumer-centric strategies, is paving the way for sustainable growth and success.
What are the market trends shaping the Canned Tuna Industry?
- Online retailing is experiencing significant growth and is becoming the emerging market trend.
- The expanding digital landscape has fueled the growth of e-commerce businesses worldwide, leading to increased demand for convenient shopping solutions. In the seafood industry, this trend has opened new avenues for companies to boost sales, expand market reach, and enhance customer relationships. An online presence enables manufacturers and distributors to broaden their product visibility across diverse geographies. For instance, in China, e-commerce platforms like Yiguo have emerged as significant channels for seafood sales. This digital transformation has resulted in numerous benefits, including faster market entry, improved forecast accuracy, and cost optimization.
- According to recent studies, e-commerce sales in the seafood industry are projected to grow at a compound annual growth rate of 15.2% between 2021 and 2028. Additionally, the implementation of advanced technologies, such as AI and machine learning, is expected to further streamline operations and enhance customer experiences.
What challenges does the Canned Tuna Industry face during its growth?
- The overconsumption of canned tuna poses significant adverse effects, which represents a major challenge to the growth of the industry.
- Canned tuna, a preserved form of this popular fish, holds a significant market presence due to its extended shelf life, affordability, and various nutritional benefits. The global demand for canned tuna remains robust, driven by its convenience and versatility in various applications, from culinary uses to food aid programs. However, health concerns surrounding mercury and heavy metal content in canned tuna have emerged as a critical issue. Regular consumption can lead to adverse health effects, such as vision and hearing problems, and even blindness or deafness due to mercury accumulation. Despite these concerns, the market continues to evolve, with ongoing research focusing on sustainable fishing practices and alternative canning methods to minimize health risks.
- The market's dynamics are influenced by factors such as consumer preferences, regulatory requirements, and technological advancements. For instance, the adoption of advanced canning technologies has led to improved efficiency and enhanced regulatory compliance, ultimately contributing to the market's growth.
Exclusive Technavio Analysis on Customer Landscape
The canned tuna market forecasting report includes the adoption lifecycle of the market, covering from the innovator's stage to the laggard's stage. It focuses on adoption rates in different regions based on penetration. Furthermore, the canned tuna market report also includes key purchase criteria and drivers of price sensitivity to help companies evaluate and develop their market growth analysis strategies.
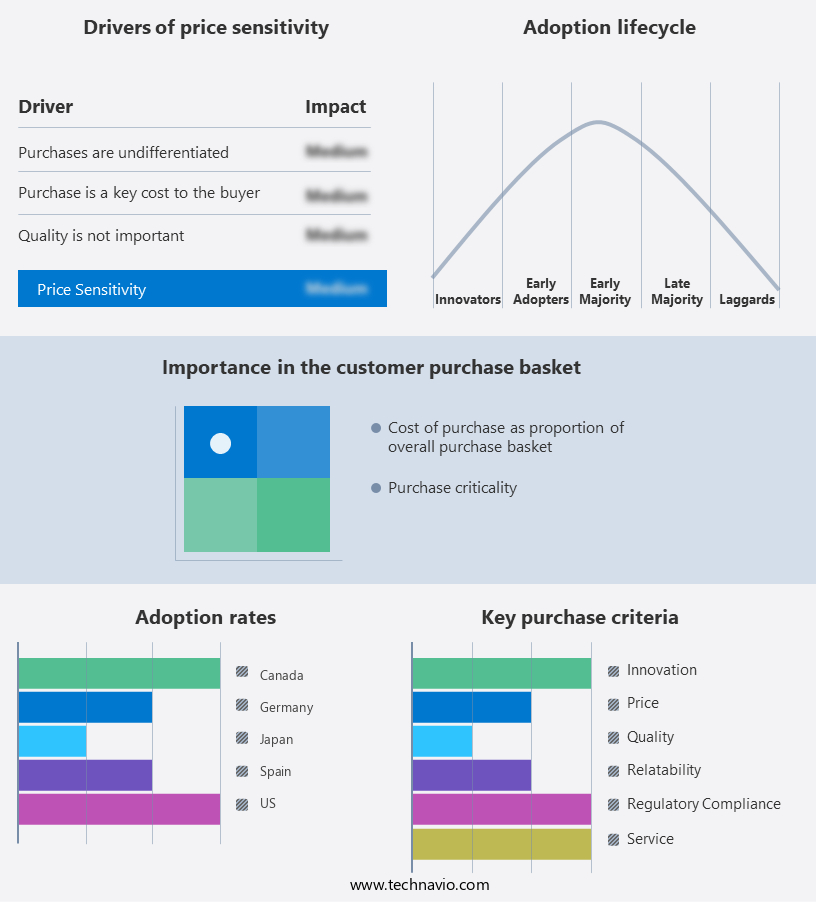
Customer Landscape of Canned Tuna Industry
Competitive Landscape
Companies are implementing various strategies, such as strategic alliances, canned tuna market forecast, partnerships, mergers and acquisitions, geographical expansion, and product/service launches, to enhance their presence in the industry.
A.E.C. CANNING Co. Ltd. - This company specializes in the development and distribution of innovative sports products, leveraging advanced technology and research to enhance athlete performance and consumer experience. Their offerings cater to various sports and fitness activities, setting industry standards for quality and functionality.
The industry research and growth report includes detailed analyses of the competitive landscape of the market and information about key companies, including:
- A.E.C. CANNING Co. Ltd.
- American Tuna Inc.
- Bumble Bee Foods LLC
- Century Pacific Food Inc.
- Conservas La Gaviota SL
- Crown Prince Inc.
- Diavena Ltd.
- Dongwon Group
- Frinsa del Noroeste SA
- Golden Prize Canning Co. Ltd.
- Jealsa Rianxeira SAU
- King Bell Producer Co. Ltd.
- LUIS CALVO SANZ SA
- Ocean Brands GP
- Otis McAllister Inc.
- Princes Ltd.
- Private Label Tuna
- PT. Bali Maya Permai
- Thai Union Group PCL
- Wild Planet Foods Inc.
Qualitative and quantitative analysis of companies has been conducted to help clients understand the wider business environment as well as the strengths and weaknesses of key industry players. Data is qualitatively analyzed to categorize companies as pure play, category-focused, industry-focused, and diversified; it is quantitatively analyzed to categorize companies as dominant, leading, strong, tentative, and weak.
Recent Development and News in Canned Tuna Market
- In January 2024, Thai Union Group, a leading canned tuna producer, announced the launch of its new sustainable tuna brand, "OceanDiscover," in Europe. The product line is certified by the Marine Stewardship Council and the Sustainable Fisheries Partnership, emphasizing Thai Union's commitment to sustainable fishing practices (Thai Union Group Press Release, 2024).
- In March 2024, StarKist Co., the largest canned tuna brand in the US, formed a strategic partnership with Walmart to expand its private label offerings in Walmart stores. The collaboration aimed to provide consumers with more affordable and sustainable canned tuna options (StarKist Co. Press Release, 2024).
- In May 2024, Bumble Bee Seafoods, the third-largest canned tuna company, completed the acquisition of Wild Planet Foods, a leading provider of sustainably-caught canned tuna. The deal strengthened Bumble Bee's position in the market and expanded its product offerings, particularly in the organic and wild-caught segments (Bumble Bee Foods Press Release, 2024).
- In September 2025, the European Union approved new regulations on mercury levels in canned tuna, setting a maximum limit of 0.1 parts per million (ppm). This stricter standard was implemented to protect consumers from potential health risks associated with mercury exposure (European Commission Press Release, 2025).
Dive into Technavio's robust research methodology, blending expert interviews, extensive data synthesis, and validated models for unparalleled Canned Tuna Market insights. See full methodology.
|
Market Scope |
|
|
Report Coverage |
Details |
|
Page number |
171 |
|
Base year |
2023 |
|
Historic period |
2018-2022 |
|
Forecast period |
2024-2028 |
|
Growth momentum & CAGR |
Accelerate at a CAGR of 3.83% |
|
Market growth 2024-2028 |
USD 3561.6 million |
|
Market structure |
Fragmented |
|
YoY growth 2023-2024(%) |
3.64 |
|
Key countries |
US, Canada, Germany, UK, Italy, France, China, India, Japan, Brazil, Egypt, UAE, Oman, Argentina, KSA, UAE, Brazil, and Rest of World (ROW) |
|
Competitive landscape |
Leading Companies, Market Positioning of Companies, Competitive Strategies, and Industry Risks |
Research Analyst Overview
- The market continues to evolve, driven by advancements in technology and shifting consumer preferences. Quality control metrics, such as automated canning systems and heavy metal detection, ensure the production of safe and high-quality products. Supply chain traceability and protein content analysis enable transparency and trust in the industry. Storage temperature monitoring and water usage optimization contribute to sustainability and cost savings. Consumer health benefits, including omega-3 fatty acids, fuel demand for premium tuna offerings. Waste reduction strategies and byproduct utilization promote environmental responsibility. Microbial contamination risks and food safety regulations necessitate stringent quality assurance protocols, including label accuracy verification and thermal processing parameters.
- Sensory evaluation methods and canning sterilization methods ensure consistent product taste and texture. Retail display optimization and tuna processing techniques cater to evolving consumer preferences. Tuna species identification and distribution logistics ensure product freshness and availability. Spoilage prevention methods and allergen management maintain product integrity. Industry growth is expected to reach double-digit percentages, driven by increasing demand for sustainable fishing practices and nutritional labeling requirements. Byproduct utilization, fish oil extraction, mercury levels testing, and canning line efficiency are key areas of focus for market participants.
- For instance, a leading canned tuna producer implemented an automated canning system, resulting in a 15% increase in production efficiency and a 10% reduction in water usage. This illustrates the market's continuous unfolding, with ongoing improvements in technology, sustainability, and consumer satisfaction.
What are the Key Data Covered in this Canned Tuna Market Research and Growth Report?
-
What is the expected growth of the Canned Tuna Market between 2024 and 2028?
-
USD 3.56 billion, at a CAGR of 3.83%
-
-
What segmentation does the market report cover?
-
The report is segmented by Distribution Channel (Hypermarket and supermarket, Speciality stores, and Online), Product (Canned skipjack tuna, Canned yellowfin tuna, Canned albacore tuna, and Other canned tuna), Geography (Europe, North America, APAC, Middle East and Africa, and South America), Form (Solid, Chunk, Flaked, and Shredded), Application (Household Consumption, Commercial (Restaurants, Hotels, Institutions), and Ready-to-Eat Meals), and Packaging Type (Cans (Metal), Pouches, and Jars)
-
-
Which regions are analyzed in the report?
-
Europe, North America, APAC, Middle East and Africa, and South America
-
-
What are the key growth drivers and market challenges?
-
Launch of new products, Adverse effects associated with overconsumption of canned tuna
-
-
Who are the major players in the Canned Tuna Market?
-
A.E.C. CANNING Co. Ltd., American Tuna Inc., Bumble Bee Foods LLC, Century Pacific Food Inc., Conservas La Gaviota SL, Crown Prince Inc., Diavena Ltd., Dongwon Group, Frinsa del Noroeste SA, Golden Prize Canning Co. Ltd., Jealsa Rianxeira SAU, King Bell Producer Co. Ltd., LUIS CALVO SANZ SA, Ocean Brands GP, Otis McAllister Inc., Princes Ltd., Private Label Tuna, PT. Bali Maya Permai, Thai Union Group PCL, and Wild Planet Foods Inc.
-
Market Research Insights
- The market for canned tuna is a significant and continually evolving sector within the global food industry. According to recent reports, the worldwide production of canned tuna reached approximately 1.5 million metric tons in 2021, with an anticipated growth rate of around 2% per annum. One notable trend in the market is the increasing demand for sustainable and responsibly sourced tuna. For instance, sales of skipjack and yellowfin tuna, which are primarily sourced through pole-and-line and troll methods, have experienced a substantial increase in recent years.
- Additionally, advancements in technology have led to improvements in yield, process optimization, and regulatory compliance, ensuring the highest quality control checks for consumers.
We can help! Our analysts can customize this canned tuna market research report to meet your requirements.
 RIA -
RIA - 
