Canned Vegetables Market Analysis Europe, North America, APAC, South America, Middle East and Africa - US, Germany, Canada, China, France, UK, Italy, Japan, Spain, Australia - Size and Forecast 2024-2028

Canned Vegetables Market Analysis Europe, North America, APAC, South America, Middle East and Africa - US, Germany, Canada, China, France, UK, Italy, Japan, Spain, Australia - Size and Forecast 2024-2028

Published: Oct 2024 209 Pages SKU: IRTNTR80243

Market Overview at a Glance

$8.05 B
Market Opportunity
4.4%
CAGR
4.1
YoY growth 2023-2024(%)

Canned Vegetables Market Size 2024-2028 

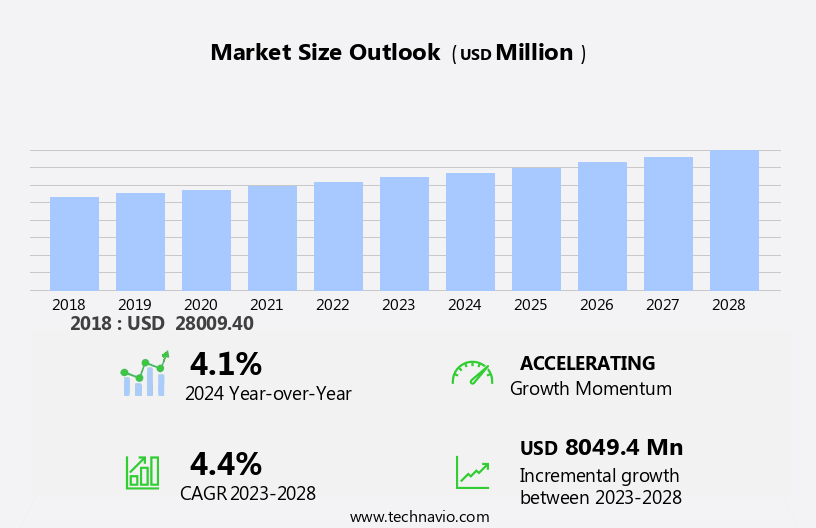
The canned vegetables market size is forecast to increase by USD 8.05 billion at a CAGR of 4.4% between 2023 and 2028. The market exhibits significant growth due to several factors. Increasing disposable income enables consumers to spend more on nutritious food options, leading to a rise in demand for canned vegetables. Additionally, there is a growing trend towards plant-based diets, making canned vegetables an attractive choice for those seeking protein sources. However, challenges persist in the form of food decomposition and environmental factors. Canned vegetables may lose some nutrients during the preservation process, which could impact their appeal. The market is poised for growth, driven by these trends and the increasing demand for natural and convenient food options. Furthermore, concerns regarding the impact of canned food production on the environment may deter some consumers. Despite these challenges, the market for canned vegetables continues to expand, driven by consumer preferences for convenience and affordability.

What will the size of the market be during the forecast period?

Canned Vegetables Market Size

 Request Free Sample

The market is witnessing significant growth due to several factors. With the increasing preference for convenient and nutritious meal options, canned vegetables have gained popularity among the working population in the US. The fast-paced lifestyle of consumers has led to an increased demand for ready-to-eat and easy-to-prepare food items. Canned vegetables offer several advantages over fresh vegetables. They are processed using advanced techniques such as peeling, chopping, and cooking, ensuring consumers get consistent quality and taste. The use of air-tight tins and aluminum cans maintains the nutritional qualities of the vegetables, preserving their nutrients, protein, fiber, vitamins, and omega-3 fatty acids. Moreover, the trend towards organic food, clean-label foods, and chemical-free food products has also positively impacted the market. Consumers are increasingly seeking label knowledge and understanding the nutritional benefits of the food they consume. Canned vegetables provide a convenient solution for those looking for nutritious options without compromising on taste or convenience.

Further, the canning process ensures that vegetables retain their natural color, texture, and flavor, making them a popular choice for consumers. Canned fruits also follow the same trend, offering consumers a wide range of options for their daily nutritional needs. The global production of canned vegetables is expected to grow due to the increasing demand for protein-rich and fiber-rich food items. Consumers are becoming more health-conscious and are looking for food options that provide essential nutrients for a balanced diet. Canned vegetables offer a cost-effective and convenient solution for meeting these dietary requirements. In conclusion, the market is experiencing growth due to the changing consumer preferences towards convenient, nutritious, and chemical-free food options. The trend towards organic and clean-label foods, coupled with the convenience and long shelf life of canned vegetables, is expected to drive the growth of this market in the coming years.

Market Segmentation

The market research report provides comprehensive data (region-wise segment analysis), with forecasts and estimates in "USD million" for the period 2024-2028, as well as historical data from 2018-2022 for the following segments.

  • Product
    • Canned tomatoes
    • Canned beans
    • Canned peas
    • Canned corn
    • Others
  • Type
    • Conventional
    • Organic
  • Geography
    • Europe
      • Germany
      • UK
      • France
      • Italy
      • Spain
    • North America
      • Canada
      • US
    • APAC
      • China
      • Japan
    • South America
    • Middle East and Africa

By Product Insights

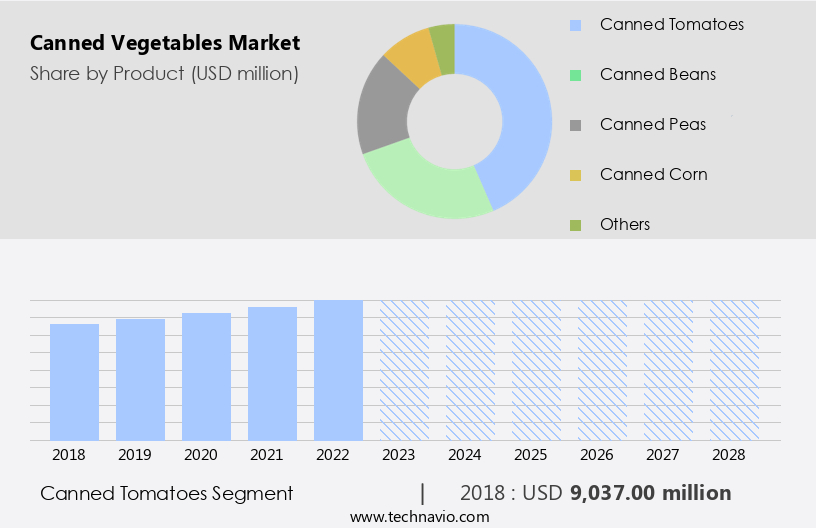
The canned tomatoes segment is estimated to witness significant growth during the forecast period. Canned vegetables, including tomatoes, play a significant role in the global market due to their convenience and nutritional value. Canned tomatoes, in particular, are widely used in various dishes such as sauces, soups, stews, and casseroles, adding depth of flavor and rich color. These vegetables are a valuable source of essential vitamins, including vitamin C and vitamin K, and the antioxidant lycopene. Canned fruits also fall under this category and offer similar benefits.

Moreover, product labels provide consumers with important information regarding fiber, vitamins, and other nutrients present in these canned goods. Organic vegetables are increasingly popular, reflecting a growing trend towards healthier food choices. The global production of canned vegetables continues to expand, catering to the demand for convenient meals that do not compromise nutrition.

Canned Vegetables Market Size

Get a glance at the market share of various segments Request Free Sample

The canned tomatoes segment accounted for USD 9.04 billion in 2018 and showed a gradual increase during the forecast period.

Regional Insights

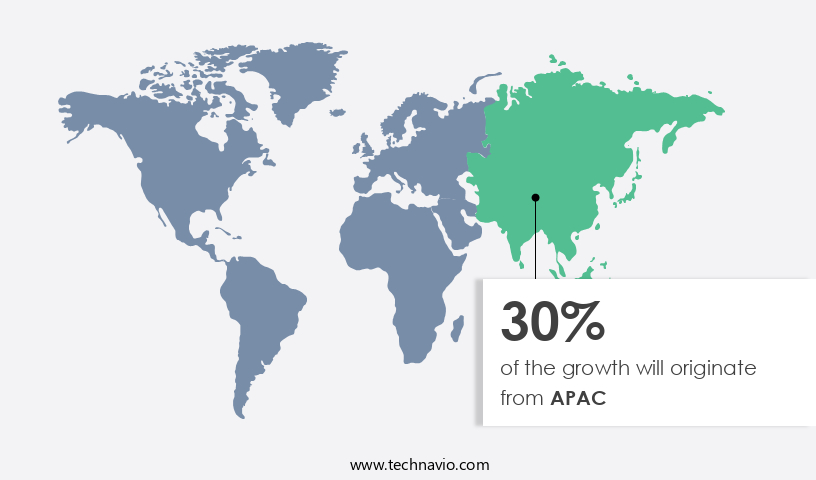
APAC is estimated to contribute 30% to the growth of the global market during the forecast period. Technavio's analysts have elaborately explained the regional trends and drivers that shape the market during the forecast period.

Canned Vegetables Market Share by Geography

For more insights on the market share of various regions Request Free Sample

The European market is a notable segment within the global industry, characterized by substantial consumption of packaged food products, including canned vegetables and beverages. Germany, France, and Spain are major contributors to this market, each bringing unique aspects to the overall dynamics. Germany is the leading importer of canned vegetables in Europe, with approximately 1.8 million tons imported in 2022. Although there was a slight decrease in 2021, the import volume has consistently increased with an average growth rate of 2.4%. In terms of value, German imports have risen by an average of 9% annually, reaching USD 3 billion. Processing techniques, such as peeling, chopping, and cooking, are essential in the production of canned vegetables, ensuring convenience for consumers.

Our researchers analyzed the data with 2023 as the base year, along with the key drivers, trends, and challenges. A holistic analysis of drivers will help companies refine their marketing strategies to gain a competitive advantage.

Market Driver

A rise in disposable income is the key driver of the market. The market in the US is witnessing notable expansion due to the escalating fast-paced lifestyle and increasing working population. This trend is fueled by the growing preference for convenient and nutritious food alternatives, such as canned vegetables. For instance, according to the US Census Bureau, the median household income in the US was reported at USD 68,703 in 2023, marking a 3.5% increase compared to 2022 and a 6.4% increase compared to 2019. This income growth is empowering consumers to invest more in healthier food options, including canned vegetables, which are not only convenient but also offer numerous health benefits.

Moreover, the rising demand for organic food and clean-label foods is further propelling the market growth. These food choices are free from chemicals and preservatives, making canned vegetables an attractive option for health-conscious consumers. The market is expected to continue its upward trajectory, driven by these consumer trends and preferences.

Market Trends

Rising interest in plant-based diets is the upcoming trend in the market. The market in North America is experiencing notable growth due to the rising preference for nutritious and plant-based food options. Environmental factors, such as the increasing awareness of the health benefits of consuming vegetables and the shift towards sustainable agriculture, are also contributing to this trend. In the United States, the number of vegetarians and vegans is estimated to be around 10.7 million in 2023, representing approximately 5%-8% of the population.

Further, this demographic shift is driving demand for canned vegetables, which offer convenience and a rich source of essential nutrients, including protein, fiber, and vitamins. Similarly, in Canada, the vegan population was reported to be around 2 million in 2022. The market is expected to continue growing as more consumers seek convenient and nutritious alternatives to meat-based food products.

Market Challenge

Growing cases of product recalls is a key challenge affecting the market growth. Canned vegetables have become a staple in American households due to their extended shelf life and nutritional qualities. However, the market for these natural food products faces challenges, particularly in ensuring product safety and maintaining consumer trust. Instances of product recalls, such as the one involving Princes Group's canned bean products in December 2023, can lead to significant financial and reputational damage for manufacturers. These recalls underscore the importance of rigorous quality control measures during the canning and preserving process to prevent contamination and maintain product safety.

For example, in May 2024, Goya Foods had to recall certain lots of Red Kidney Beans due to potential contamination. As consumers increasingly demand transparency in food labeling, manufacturers must prioritize safety and quality to meet these expectations and maintain a strong market position. Ensuring product safety not only protects consumers but also safeguards the long-term success of businesses in the market.

Exclusive Customer Landscape

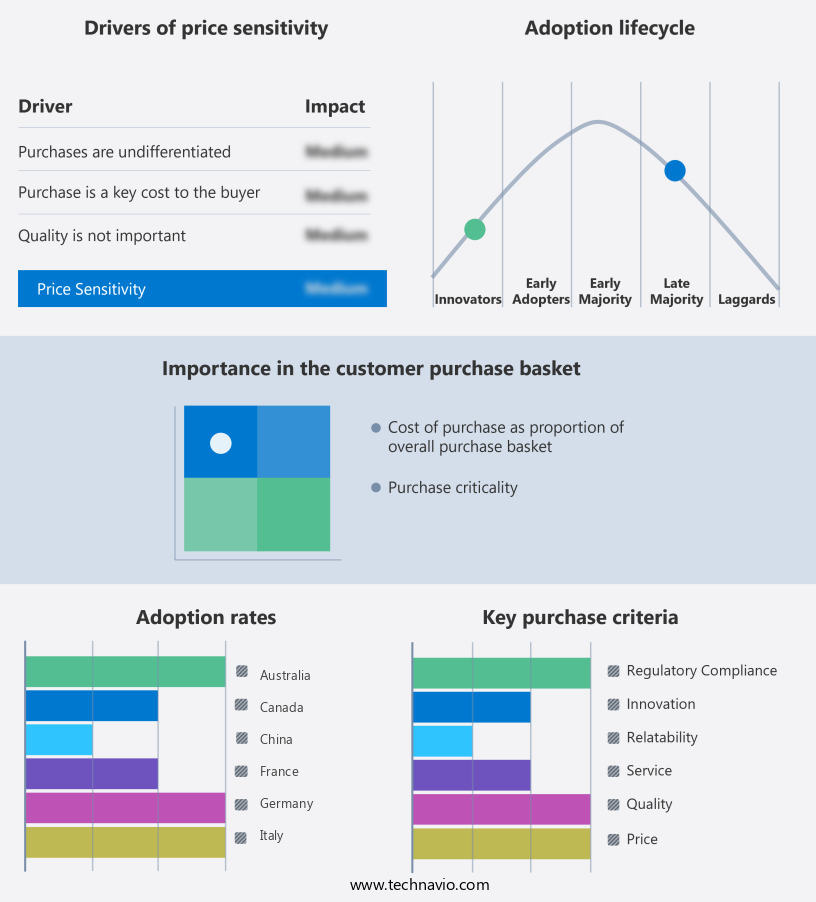
The market forecasting report includes the adoption lifecycle of the market, covering from the innovator's stage to the laggard's stage. It focuses on adoption rates in different regions based on penetration. Furthermore, the report also includes key purchase criteria and drivers of price sensitivity to help companies evaluate and develop their market growth analysis strategies.

Canned Vegetables Market Share by Geography

 Customer Landscape

Key Companies & Market Insights

Companies are implementing various strategies, such as strategic alliances, partnerships, mergers and acquisitions, geographical expansion, and product/service launches, to enhance their presence in the market.

Aditi Foods (India) Pvt. Ltd. - The company offers a wide variety of canned vegetables such as baby corn, sweetcorn, baked beans, tomato, and others.

The market research and growth report includes detailed analyses of the competitive landscape of the market and information about key companies, including:

  • Acroyali Holdings Qingdao Co Ltd.
  • Ayam Sarl
  • B and G Foods Inc.
  • Baxters Food Group Ltd.
  • BONDUELLE SA
  • Conagra Brands Inc.
  • Del Monte Foods Inc.
  • Dole plc
  • General Mills Inc.
  • Goya Foods Inc.
  • Greenyard NV
  • Hirzel Canning Company and Farms, Inc
  • J Sainsbury plc
  • KYKNOS S.A
  • LA DORIA S.P.A.
  • Princes Ltd.
  • SATKO
  • Seneca Foods Corp.
  • Tesco Plc
  • The Kraft Heinz Co.
  • Waitrose and Partners

Qualitative and quantitative analysis of companies has been conducted to help clients understand the wider business environment as well as the strengths and weaknesses of key market players. Data is qualitatively analyzed to categorize companies as pure play, category-focused, industry-focused, and diversified; it is quantitatively analyzed to categorize companies as dominant, leading, strong, tentative, and weak.

Research Analyst Overview

The market is witnessing significant growth due to the increasing demand for packaged food products, beverages, and convenience food items in the fast-paced lifestyle of the working population. Canning is an essential preservation technique used to extend the shelf life of food products, preventing food decomposition caused by environmental factors. The market for canned vegetables caters to health-conscious consumers who prefer organic food, clean-label foods, and chemical-free, natural food products. The canning process involves peeling, chopping, and cooking vegetables before packing them in air-tight tins or aluminum can. This preservation method maintains the nutritional qualities of the vegetables, including essential nutrients like protein, fiber, vitamins, omega-3 fatty acids, and antioxidants.

Canned fruits, vegetables, meats, and seafood, such as tuna, salmon, sardines, and anchovies, offer nutritional profiles that contribute to heart health, blood pressure regulation, and overall well-being. Consumers are increasingly seeking convenient meals and healthier alternatives, making the canned food market a lucrative business opportunity. The global production of canned fruits and vegetables is expected to grow, driven by the increasing demand for nutritious options that cater to the changing dietary preferences and lifestyles of consumers. Product labels play a crucial role in the market, with consumers seeking information on the nutritional profile, organic certification, and production methods of canned food items.

Market Scope

Report Coverage

Details

Page number

209

Base year

2023

Historic period

2018-2022

Forecast period

2024-2028

Growth momentum & CAGR

Accelerate at a CAGR of 4.4%

Market growth 2024-2028

USD 8.05 billion

Market structure

Fragmented

YoY growth 2023-2024(%)

4.1

Regional analysis

Europe, North America, APAC, South America, and Middle East and Africa

Performing market contribution

APAC at 30%

Key countries

US, Germany, Canada, China, France, UK, Italy, Japan, Spain, and Australia

Competitive landscape

Leading Companies, Market Positioning of Companies, Competitive Strategies, and Industry Risks

Key companies profiled

Acroyali Holdings Qingdao Co Ltd., Aditi Foods (India) Pvt. Ltd., Ayam Sarl, B and G Foods Inc., Baxters Food Group Ltd., BONDUELLE SA, Conagra Brands Inc., Del Monte Foods Inc., Dole plc, General Mills Inc., Goya Foods Inc., Greenyard NV, Hirzel Canning Company and Farms, Inc, J Sainsbury plc, KYKNOS S.A, LA DORIA S.P.A., Princes Ltd., SATKO, Seneca Foods Corp., Tesco Plc, The Kraft Heinz Co., and Waitrose and Partners

Market dynamics

Parent market analysis, market growth inducers and obstacles, market forecast, fast-growing and slow-growing segment analysis, COVID-19 impact and recovery analysis and future consumer dynamics, market condition analysis for the forecast period

Customization purview

If our market report has not included the data that you are looking for, you can reach out to our analysts and get segments customized.

Request Free Sample

What are the Key Data Covered in this Market Research and Growth Report?

  • CAGR of the market during the forecast period
  • Detailed information on factors that will drive the market growth and forecasting between 2024 and 2028
  • Precise estimation of the size of the market  and its contribution of the market in focus to the parent market
  • Accurate predictions about upcoming market growth and trends and changes in consumer behaviour
  • Growth of the market across Europe, North America, APAC, South America, and Middle East and Africa
  • Thorough analysis of the market's competitive landscape and detailed information about companies
  • Comprehensive analysis of factors that will challenge the growth of market companies

We can help! Our analysts can customize this market research report to meet your requirements. Get in touch

1 Executive Summary

  • 1.1 Market overview
    • Executive Summary - Chart on Market Overview
    • Executive Summary - Data Table on Market Overview
    • Executive Summary - Chart on Global Market Characteristics
    • Executive Summary - Chart on Market by Geography
    • Executive Summary - Chart on Market Segmentation by Product
    • Executive Summary - Chart on Market Segmentation by Type
    • Executive Summary - Chart on Incremental Growth
    • Executive Summary - Data Table on Incremental Growth
    • Executive Summary - Chart on Company Market Positioning

2 Technavio Analysis

  • 2.1 Analysis of price sensitivity, lifecycle, customer purchase basket, adoption rates, and purchase criteria
    • Analysis of price sensitivity, lifecycle, customer purchase basket, adoption rates, and purchase criteria
  • 2.2 Criticality of inputs and Factors of differentiation
    • Overview on criticality of inputs and factors of differentiation
  • 2.3 Factors of disruption
    • Overview on factors of disruption
  • 2.4 Impact of drivers and challenges
    • Impact of drivers and challenges in 2023 and 2028

3 Market Landscape

  • 3.1 Market ecosystem
    • Parent Market
    • Data Table on - Parent Market
  • 3.2 Market characteristics
    • Market characteristics analysis
  • 3.3 Value chain analysis
    • Value Chain Analysis

4 Market Sizing

  • 4.1 Market definition
    • Offerings of companies included in the market definition
  • 4.2 Market segment analysis
    • Market segments
  • 4.3 Market size 2023
    • 4.4 Market outlook: Forecast for 2023-2028
      • Chart on Global - Market size and forecast 2023-2028 ($ million)
      • Data Table on Global - Market size and forecast 2023-2028 ($ million)
      • Chart on Global Market: Year-over-year growth 2023-2028 (%)
      • Data Table on Global Market: Year-over-year growth 2023-2028 (%)

    5 Historic Market Size

    • 5.1 Global Canned Vegetables Market 2018 - 2022
      • Historic Market Size - Data Table on Global Canned Vegetables Market 2018 - 2022 ($ million)
    • 5.2 Product segment analysis 2018 - 2022
      • Historic Market Size - Product Segment 2018 - 2022 ($ million)
    • 5.3 Type segment analysis 2018 - 2022
      • Historic Market Size - Type Segment 2018 - 2022 ($ million)
    • 5.4 Geography segment analysis 2018 - 2022
      • Historic Market Size - Geography Segment 2018 - 2022 ($ million)
    • 5.5 Country segment analysis 2018 - 2022
      • Historic Market Size - Country Segment 2018 - 2022 ($ million)

    6 Qualitative Analysis

    • 6.1 Impact of AI on the Global Canned Vegetables Market

      7 Five Forces Analysis

      • 7.1 Five forces summary
        • Five forces analysis - Comparison between 2023 and 2028
      • 7.2 Bargaining power of buyers
        • Bargaining power of buyers - Impact of key factors 2023 and 2028
      • 7.3 Bargaining power of suppliers
        • Bargaining power of suppliers - Impact of key factors in 2023 and 2028
      • 7.4 Threat of new entrants
        • Threat of new entrants - Impact of key factors in 2023 and 2028
      • 7.5 Threat of substitutes
        • Threat of substitutes - Impact of key factors in 2023 and 2028
      • 7.6 Threat of rivalry
        • Threat of rivalry - Impact of key factors in 2023 and 2028
      • 7.7 Market condition
        • Chart on Market condition - Five forces 2023 and 2028

      8 Market Segmentation by Product

      • 8.1 Market segments
        • Chart on Product - Market share 2023-2028 (%)
        • Data Table on Product - Market share 2023-2028 (%)
      • 8.2 Comparison by Product
        • Chart on Comparison by Product
        • Data Table on Comparison by Product
      • 8.3 Canned tomatoes - Market size and forecast 2023-2028
        • Chart on Canned tomatoes - Market size and forecast 2023-2028 ($ million)
        • Data Table on Canned tomatoes - Market size and forecast 2023-2028 ($ million)
        • Chart on Canned tomatoes - Year-over-year growth 2023-2028 (%)
        • Data Table on Canned tomatoes - Year-over-year growth 2023-2028 (%)
      • 8.4 Canned beans - Market size and forecast 2023-2028
        • Chart on Canned beans - Market size and forecast 2023-2028 ($ million)
        • Data Table on Canned beans - Market size and forecast 2023-2028 ($ million)
        • Chart on Canned beans - Year-over-year growth 2023-2028 (%)
        • Data Table on Canned beans - Year-over-year growth 2023-2028 (%)
      • 8.5 Canned peas - Market size and forecast 2023-2028
        • Chart on Canned peas - Market size and forecast 2023-2028 ($ million)
        • Data Table on Canned peas - Market size and forecast 2023-2028 ($ million)
        • Chart on Canned peas - Year-over-year growth 2023-2028 (%)
        • Data Table on Canned peas - Year-over-year growth 2023-2028 (%)
      • 8.6 Canned corn - Market size and forecast 2023-2028
        • Chart on Canned corn - Market size and forecast 2023-2028 ($ million)
        • Data Table on Canned corn - Market size and forecast 2023-2028 ($ million)
        • Chart on Canned corn - Year-over-year growth 2023-2028 (%)
        • Data Table on Canned corn - Year-over-year growth 2023-2028 (%)
      • 8.7 Others - Market size and forecast 2023-2028
        • Chart on Others - Market size and forecast 2023-2028 ($ million)
        • Data Table on Others - Market size and forecast 2023-2028 ($ million)
        • Chart on Others - Year-over-year growth 2023-2028 (%)
        • Data Table on Others - Year-over-year growth 2023-2028 (%)
      • 8.8 Market opportunity by Product
        • Market opportunity by Product ($ million)
        • Data Table on Market opportunity by Product ($ million)

      9 Market Segmentation by Type

      • 9.1 Market segments
        • Chart on Type - Market share 2023-2028 (%)
        • Data Table on Type - Market share 2023-2028 (%)
      • 9.2 Comparison by Type
        • Chart on Comparison by Type
        • Data Table on Comparison by Type
      • 9.3 Conventional - Market size and forecast 2023-2028
        • Chart on Conventional - Market size and forecast 2023-2028 ($ million)
        • Data Table on Conventional - Market size and forecast 2023-2028 ($ million)
        • Chart on Conventional - Year-over-year growth 2023-2028 (%)
        • Data Table on Conventional - Year-over-year growth 2023-2028 (%)
      • 9.4 Organic - Market size and forecast 2023-2028
        • Chart on Organic - Market size and forecast 2023-2028 ($ million)
        • Data Table on Organic - Market size and forecast 2023-2028 ($ million)
        • Chart on Organic - Year-over-year growth 2023-2028 (%)
        • Data Table on Organic - Year-over-year growth 2023-2028 (%)
      • 9.5 Market opportunity by Type
        • Market opportunity by Type ($ million)
        • Data Table on Market opportunity by Type ($ million)

      10 Customer Landscape

      • 10.1 Customer landscape overview
        • Analysis of price sensitivity, lifecycle, customer purchase basket, adoption rates, and purchase criteria

      11 Geographic Landscape

      • 11.1 Geographic segmentation
        • Chart on Market share by geography 2023-2028 (%)
        • Data Table on Market share by geography 2023-2028 (%)
      • 11.2 Geographic comparison
        • Chart on Geographic comparison
        • Data Table on Geographic comparison
      • 11.3 Europe - Market size and forecast 2023-2028
        • Chart on Europe - Market size and forecast 2023-2028 ($ million)
        • Data Table on Europe - Market size and forecast 2023-2028 ($ million)
        • Chart on Europe - Year-over-year growth 2023-2028 (%)
        • Data Table on Europe - Year-over-year growth 2023-2028 (%)
      • 11.4 North America - Market size and forecast 2023-2028
        • Chart on North America - Market size and forecast 2023-2028 ($ million)
        • Data Table on North America - Market size and forecast 2023-2028 ($ million)
        • Chart on North America - Year-over-year growth 2023-2028 (%)
        • Data Table on North America - Year-over-year growth 2023-2028 (%)
      • 11.5 APAC - Market size and forecast 2023-2028
        • Chart on APAC - Market size and forecast 2023-2028 ($ million)
        • Data Table on APAC - Market size and forecast 2023-2028 ($ million)
        • Chart on APAC - Year-over-year growth 2023-2028 (%)
        • Data Table on APAC - Year-over-year growth 2023-2028 (%)
      • 11.6 South America - Market size and forecast 2023-2028
        • Chart on South America - Market size and forecast 2023-2028 ($ million)
        • Data Table on South America - Market size and forecast 2023-2028 ($ million)
        • Chart on South America - Year-over-year growth 2023-2028 (%)
        • Data Table on South America - Year-over-year growth 2023-2028 (%)
      • 11.7 Middle East and Africa - Market size and forecast 2023-2028
        • Chart on Middle East and Africa - Market size and forecast 2023-2028 ($ million)
        • Data Table on Middle East and Africa - Market size and forecast 2023-2028 ($ million)
        • Chart on Middle East and Africa - Year-over-year growth 2023-2028 (%)
        • Data Table on Middle East and Africa - Year-over-year growth 2023-2028 (%)
      • 11.8 US - Market size and forecast 2023-2028
        • Chart on US - Market size and forecast 2023-2028 ($ million)
        • Data Table on US - Market size and forecast 2023-2028 ($ million)
        • Chart on US - Year-over-year growth 2023-2028 (%)
        • Data Table on US - Year-over-year growth 2023-2028 (%)
      • 11.9 Germany - Market size and forecast 2023-2028
        • Chart on Germany - Market size and forecast 2023-2028 ($ million)
        • Data Table on Germany - Market size and forecast 2023-2028 ($ million)
        • Chart on Germany - Year-over-year growth 2023-2028 (%)
        • Data Table on Germany - Year-over-year growth 2023-2028 (%)
      • 11.10 China - Market size and forecast 2023-2028
        • Chart on China - Market size and forecast 2023-2028 ($ million)
        • Data Table on China - Market size and forecast 2023-2028 ($ million)
        • Chart on China - Year-over-year growth 2023-2028 (%)
        • Data Table on China - Year-over-year growth 2023-2028 (%)
      • 11.11 Canada - Market size and forecast 2023-2028
        • Chart on Canada - Market size and forecast 2023-2028 ($ million)
        • Data Table on Canada - Market size and forecast 2023-2028 ($ million)
        • Chart on Canada - Year-over-year growth 2023-2028 (%)
        • Data Table on Canada - Year-over-year growth 2023-2028 (%)
      • 11.12 France - Market size and forecast 2023-2028
        • Chart on France - Market size and forecast 2023-2028 ($ million)
        • Data Table on France - Market size and forecast 2023-2028 ($ million)
        • Chart on France - Year-over-year growth 2023-2028 (%)
        • Data Table on France - Year-over-year growth 2023-2028 (%)
      • 11.13 UK - Market size and forecast 2023-2028
        • Chart on UK - Market size and forecast 2023-2028 ($ million)
        • Data Table on UK - Market size and forecast 2023-2028 ($ million)
        • Chart on UK - Year-over-year growth 2023-2028 (%)
        • Data Table on UK - Year-over-year growth 2023-2028 (%)
      • 11.14 Japan - Market size and forecast 2023-2028
        • Chart on Japan - Market size and forecast 2023-2028 ($ million)
        • Data Table on Japan - Market size and forecast 2023-2028 ($ million)
        • Chart on Japan - Year-over-year growth 2023-2028 (%)
        • Data Table on Japan - Year-over-year growth 2023-2028 (%)
      • 11.15 Italy - Market size and forecast 2023-2028
        • Chart on Italy - Market size and forecast 2023-2028 ($ million)
        • Data Table on Italy - Market size and forecast 2023-2028 ($ million)
        • Chart on Italy - Year-over-year growth 2023-2028 (%)
        • Data Table on Italy - Year-over-year growth 2023-2028 (%)
      • 11.16 Spain - Market size and forecast 2023-2028
        • Chart on Spain - Market size and forecast 2023-2028 ($ million)
        • Data Table on Spain - Market size and forecast 2023-2028 ($ million)
        • Chart on Spain - Year-over-year growth 2023-2028 (%)
        • Data Table on Spain - Year-over-year growth 2023-2028 (%)
      • 11.17 Australia - Market size and forecast 2023-2028
        • Chart on Australia - Market size and forecast 2023-2028 ($ million)
        • Data Table on Australia - Market size and forecast 2023-2028 ($ million)
        • Chart on Australia - Year-over-year growth 2023-2028 (%)
        • Data Table on Australia - Year-over-year growth 2023-2028 (%)
      • 11.18 Market opportunity by geography
        • Market opportunity by geography ($ million)
        • Data Tables on Market opportunity by geography ($ million)

      12 Drivers, Challenges, and Opportunity/Restraints

      • 12.1 Market drivers
        • 12.2 Market challenges
          • 12.3 Impact of drivers and challenges
            • Impact of drivers and challenges in 2023 and 2028
          • 12.4 Market opportunities/restraints

            13 Competitive Landscape

            • 13.1 Overview
              • 13.2 Competitive Landscape
                • Overview on criticality of inputs and factors of differentiation
              • 13.3 Landscape disruption
                • Overview on factors of disruption
              • 13.4 Industry risks
                • Impact of key risks on business

              14 Competitive Analysis

              • 14.1 Companies profiled
                • Companies covered
              • 14.2 Company ranking index
                • Company ranking index
              • 14.3 Market positioning of companies
                • Matrix on companies position and classification
              • 14.4 Aditi Foods (India) Pvt. Ltd.
                • Aditi Foods (India) Pvt. Ltd. - Overview
                • Aditi Foods (India) Pvt. Ltd. - Product / Service
                • Aditi Foods (India) Pvt. Ltd. - Key offerings
                • SWOT
              • 14.5 Ayam Sarl
                • Ayam Sarl - Overview
                • Ayam Sarl - Product / Service
                • Ayam Sarl - Key offerings
                • SWOT
              • 14.6 B and G Foods Inc.
                • B and G Foods Inc. - Overview
                • B and G Foods Inc. - Product / Service
                • B and G Foods Inc. - Key offerings
                • SWOT
              • 14.7 Baxters Food Group Ltd.
                • Baxters Food Group Ltd. - Overview
                • Baxters Food Group Ltd. - Product / Service
                • Baxters Food Group Ltd. - Key offerings
                • SWOT
              • 14.8 BONDUELLE SA
                • BONDUELLE SA - Overview
                • BONDUELLE SA - Business segments
                • BONDUELLE SA - Key offerings
                • BONDUELLE SA - Segment focus
                • SWOT
              • 14.9 Conagra Brands Inc.
                • Conagra Brands Inc. - Overview
                • Conagra Brands Inc. - Business segments
                • Conagra Brands Inc. - Key news
                • Conagra Brands Inc. - Key offerings
                • Conagra Brands Inc. - Segment focus
                • SWOT
              • 14.10 Del Monte Foods Inc.
                • Del Monte Foods Inc. - Overview
                • Del Monte Foods Inc. - Product / Service
                • Del Monte Foods Inc. - Key offerings
                • SWOT
              • 14.11 Dole plc
                • Dole plc - Overview
                • Dole plc - Business segments
                • Dole plc - Key offerings
                • Dole plc - Segment focus
                • SWOT
              • 14.12 General Mills Inc.
                • General Mills Inc. - Overview
                • General Mills Inc. - Business segments
                • General Mills Inc. - Key news
                • General Mills Inc. - Key offerings
                • General Mills Inc. - Segment focus
                • SWOT
              • 14.13 Greenyard NV
                • Greenyard NV - Overview
                • Greenyard NV - Business segments
                • Greenyard NV - Key offerings
                • Greenyard NV - Segment focus
                • SWOT
              • 14.14 J Sainsbury plc
                • J Sainsbury plc - Overview
                • J Sainsbury plc - Product / Service
                • J Sainsbury plc - Key news
                • J Sainsbury plc - Key offerings
                • SWOT
              • 14.15 LA DORIA S.P.A.
                • LA DORIA S.P.A. - Overview
                • LA DORIA S.P.A. - Product / Service
                • LA DORIA S.P.A. - Key offerings
                • SWOT
              • 14.16 Seneca Foods Corp.
                • Seneca Foods Corp. - Overview
                • Seneca Foods Corp. - Product / Service
                • Seneca Foods Corp. - Key offerings
                • SWOT
              • 14.17 The Kraft Heinz Co.
                • The Kraft Heinz Co. - Overview
                • The Kraft Heinz Co. - Business segments
                • The Kraft Heinz Co. - Key news
                • The Kraft Heinz Co. - Key offerings
                • The Kraft Heinz Co. - Segment focus
                • SWOT
              • 14.18 Waitrose and Partners
                • Waitrose and Partners - Overview
                • Waitrose and Partners - Product / Service
                • Waitrose and Partners - Key offerings
                • SWOT

              15 Appendix

              • 15.1 Scope of the report
                • 15.2 Inclusions and exclusions checklist
                  • Inclusions checklist
                  • Exclusions checklist
                • 15.3 Currency conversion rates for US$
                  • Currency conversion rates for US$
                • 15.4 Research methodology
                  • Research methodology
                • 15.5 Data procurement
                  • Information sources
                • 15.6 Data validation
                  • Data validation
                • 15.7 Validation techniques employed for market sizing
                  • Validation techniques employed for market sizing
                • 15.8 Data synthesis
                  • Data synthesis
                • 15.9 360 degree market analysis
                  • 360 degree market analysis
                • 15.10 List of abbreviations
                  • List of abbreviations

                Research Methodology

                Technavio presents a detailed picture of the market by way of study, synthesis, and summation of data from multiple sources. The analysts have presented the various facets of the market with a particular focus on identifying the key industry influencers. The data thus presented is comprehensive, reliable, and the result of extensive research, both primary and secondary.

                INFORMATION SOURCES

                Primary sources

                • Manufacturers and suppliers
                • Channel partners
                • Industry experts
                • Strategic decision makers

                Secondary sources

                • Industry journals and periodicals
                • Government data
                • Financial reports of key industry players
                • Historical data
                • Press releases

                DATA ANALYSIS

                Data Synthesis

                • Collation of data
                • Estimation of key figures
                • Analysis of derived insights

                Data Validation

                • Triangulation with data models
                • Reference against proprietary databases
                • Corroboration with industry experts

                REPORT WRITING

                Qualitative

                • Market drivers
                • Market challenges
                • Market trends
                • Five forces analysis

                Quantitative

                • Market size and forecast
                • Market segmentation
                • Geographical insights
                • Competitive landscape

                Interested in this report?

                Get your sample now to see our research methodology and insights!

                Download Now

                Frequently Asked Questions

                Canned Vegetables market growth will increase by $ 8049.4 mn during 2024-2028.

                The Canned Vegetables market is expected to grow at a CAGR of 4.4% during 2024-2028.

                Canned Vegetables market is segmented by Product( Canned tomatoes, Canned beans, Canned peas, Canned corn, Others) Type( Conventional, Organic)

                Acroyali Holdings Qingdao Co Ltd., Aditi Foods (India) Pvt. Ltd., Ayam Sarl, B and G Foods Inc., Baxters Food Group Ltd., BONDUELLE SA, Conagra Brands Inc., Del Monte Foods Inc., Dole plc, General Mills Inc., Goya Foods Inc., Greenyard NV, Hirzel Canning Company and Farms, Inc, J Sainsbury plc, KYKNOS S.A, LA DORIA S.P.A., Princes Ltd., SATKO, Seneca Foods Corp., Tesco Plc, The Kraft Heinz Co., Waitrose and Partners are a few of the key vendors in the Canned Vegetables market.

                APAC will register the highest growth rate of 30% among the other regions. Therefore, the Canned Vegetables market in APAC is expected to garner significant business opportunities for the vendors during the forecast period.

                US, Germany, Canada, China, France, UK, Italy, Japan, Spain, Australia

                • Rise in disposable incomeThe global canned vegetables market is experiencing significant growth is the driving factor this market.
                • driven by the rise in disposable income across various regions. This increase in income levels is enabling consumers to spend more on convenient and nutritious food options is the driving factor this market.
                • including canned vegetables. For instance is the driving factor this market.
                • in Brazil is the driving factor this market.
                • the average real monthly income for employed individuals aged 14 years and above was observed at $548 in 2023. This represents a 7.2% increase compared to that in 2022 and a 1.8% increase compared to that in 2019. The rise in income levels is enhancing the purchasing power of Brazilian consumers is the driving factor this market.
                • allowing them to allocate more of their budget toward healthier food choices such as canned vegetables. This trend is contributing to the growth of the canned vegetables market in Brazil. China has also seen a significant increase in disposable personal income is the driving factor this market.
                • which reached approximately $7 is the driving factor this market.
                • 390 in 2023 is the driving factor this market.
                • up from $7 is the driving factor this market.
                • 028 in 2022. This marks a substantial rise from the average disposable income of $2 is the driving factor this market.
                • 014 recorded from 1978 to 2023. The increase in disposable income is driving consumer spending on premium and convenient food products is the driving factor this market.
                • including canned vegetables. As Chinese consumers become more affluent is the driving factor this market.
                • their preference for high-quality and nutritious food options is expected to boost the demand for canned vegetables. In India is the driving factor this market.
                • per capita disposable income is projected to reach around $2 is the driving factor this market.
                • 549 in the fiscal year 2023-24. This follows an 8% growth in disposable income in fiscal year 2024 and a 13.3% increase in 2023. The rising income levels are enabling more Indian consumers to afford convenient and nutritious food options is the driving factor this market.
                • such as canned vegetables. This trend is expected to drive the growth of the canned vegetables market in India is the driving factor this market.
                • as consumers seek to balance their busy lifestyles with healthy eating habits. Germany has also experienced an increase in average monthly salaries is the driving factor this market.
                • which were around $4 is the driving factor this market.
                • 685 in 2023. Earnings from employment constitute the main source of income for German households is the driving factor this market.
                • accounting for 63% of total income. The rise in disposable income is allowing German consumers to spend more on high-quality and convenient food products is the driving factor this market.
                • including canned vegetables. This trend is contributing to the growth of the global canned vegetables market. is the driving factor this market.

                The Canned Vegetables market vendors should focus on grabbing business opportunities from the Canned tomatoes segment as it accounted for the largest market share in the base year.