
Carbon Management Software Market Size 2025-2029
The carbon management software market size is forecast to increase by USD 15.62 billion, at a CAGR of 17.7% between 2024 and 2029.
- The market is experiencing significant growth, driven by the increasing number of new launches and the ongoing mergers and acquisitions among companies. This market dynamic reflects the increasing importance of carbon management solutions in addressing the global shift towards sustainability and reducing carbon emissions. Renewable energy certificates and carbon credits facilitate the transition to clean technology and decarbonization strategies. However, the implementation of these software solutions faces a notable challenge: the lack of adequate training for users. As organizations adopt these tools to manage their carbon footprint, ensuring their workforce is proficient in utilizing the software is essential for maximizing its potential benefits.
- Companies seeking to capitalize on this market opportunity must prioritize user training and support to ensure the successful integration and utilization of carbon management software. Navigating this challenge effectively will be crucial for organizations to effectively manage their carbon emissions and contribute to a more sustainable future. The integration of AI, cloud-based deployment, and data analytics enhances the capabilities of carbon management software.
What will be the Size of the Carbon Management Software Market during the forecast period?
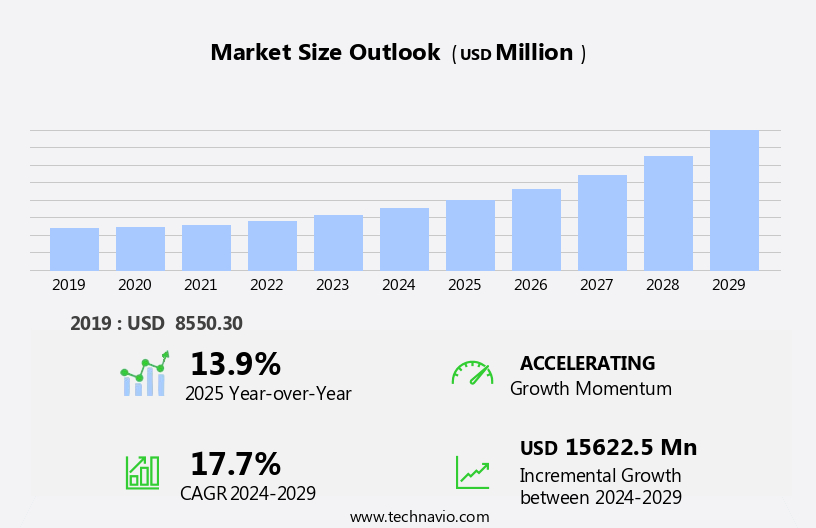
Explore in-depth regional segment analysis with market size data - historical 2019-2023 and forecasts 2025-2029 - in the full report.
Request Free Sample
The market continues to evolve, driven by various factors including regulatory mandates, emissions trading, climate action plans, and the push for net zero emissions. These initiatives span across sectors, from energy and utilities to urban planning and sustainable agriculture. Carbon emissions tracking is a critical component, with real-time analytics and machine learning enabling process optimization and emissions reduction targets. Sustainability reporting and carbon accounting are essential for corporate social responsibility and ESG investing. Climate risk assessment and environmental impact monitoring are integral to climate change mitigation and adaptation.
Circular economy principles, such as resource efficiency and waste management, are increasingly adopted for sustainability practices. Cap and trade systems and carbon taxes encourage emissions reduction, while green bonds and climate bonds finance renewable energy projects and sustainable development. Carbon sequestration, biodiversity conservation, and LEED certification contribute to environmental management systems. Smart cities, public transportation, and building automation promote energy efficiency improvements and water conservation. The ongoing unfolding of market activities reflects the continuous dynamism of the carbon management landscape. This includes the emergence of industry-specific solutions, sustainability standards, and climate regulations.
The integration of green technology and clean technology further strengthens the role of carbon management software in addressing climate change and promoting a more sustainable future.
How is this Carbon Management Software Industry segmented?
The carbon management software industry research report provides comprehensive data (region-wise segment analysis), with forecasts and estimates in "USD million" for the period 2025-2029, as well as historical data from 2019-2023 for the following segments.
- Solution
- Software
- Services
- End-user
- Large enterprises
- SMEs
- Deployment
- Cloud-based
- On-premises
- Geography
- North America
- US
- Canada
- Europe
- France
- Germany
- Italy
- UK
- APAC
- China
- India
- Japan
- South Korea
- Rest of World (ROW)
- North America
By Solution Insights
The software segment is estimated to witness significant growth during the forecast period. Carbon management software has gained significant traction among large organizations due to its customizable and solution-focused approach. Many software providers offer cloud-based systems, allowing clients to avoid the need for on-premise deployment and additional hardware purchases. The manufacturing sector is a notable adopter of carbon management software, using it to monitor emissions from production processes and supply chains. This software identifies energy inefficiencies and offers opportunities for emissions reductions, enabling companies to optimize operations and adhere to environmental regulations. The circular economy and sustainability practices are also driving the adoption of carbon management software in various industries.
Green finance, carbon sequestration, and climate risk assessment are integral components of these solutions, helping organizations make informed decisions and reduce their carbon footprint. Additionally, real-time analytics, machine learning, and data analytics facilitate efficient carbon tracking and reporting. Urban planning, renewable energy integration, and smart cities are other areas where carbon management software plays a crucial role in promoting sustainability and decarbonization strategies.
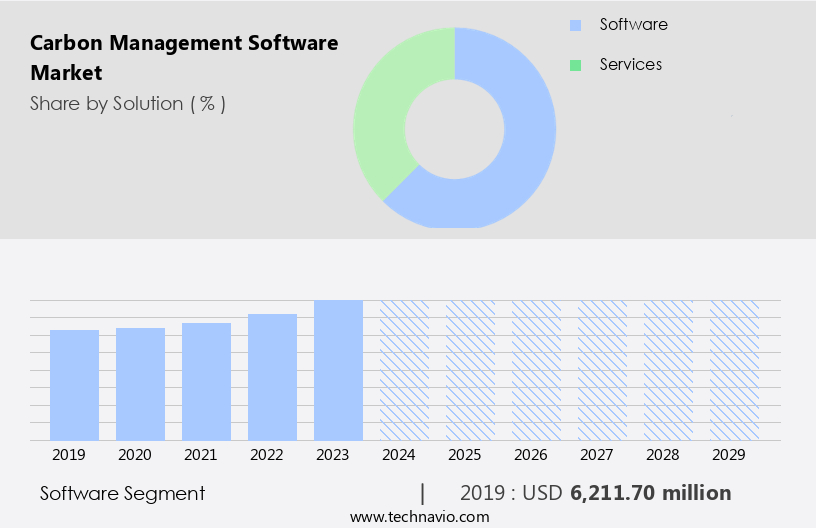
The Software segment was valued at USD 6.21 billion in 2019 and showed a gradual increase during the forecast period.
The Carbon Management Software Market is gaining momentum as industries seek robust solutions for carbon footprint reduction and compliance with evolving environmental policies. With the integration of artificial intelligence, companies now conduct precise life cycle analysis to assess environmental impact across product chains. Governments' emphasis on carbon tax is driving businesses to adopt tools that support resilience planning and environmental risk management. These platforms facilitate land use management, transportation electrification, and green building initiatives to lower greenhouse gas emissions effectively. Moreover, vendors are developing industry-specific solutions tailored to diverse sectors like manufacturing, logistics, and energy, enabling targeted decarbonization strategies.
The Carbon Management Software Market is becoming essential for organizations committed to sustainability and transparency. Frameworks like the Global Reporting Initiative and the Sustainable Development Goals are guiding businesses in aligning their strategies with global benchmarks. These platforms integrate climate change projections, aiding long-term planning through AI-driven solutions and advanced artificial intelligence analytics. Companies are adopting mechanisms such as cap-and-trade systems and innovations like direct air capture and green hydrogen to decarbonize operations. Emphasis on product stewardship, recycling and reuse, and compliance with green building certifications ensures accountability across the value chain.
Regional Analysis
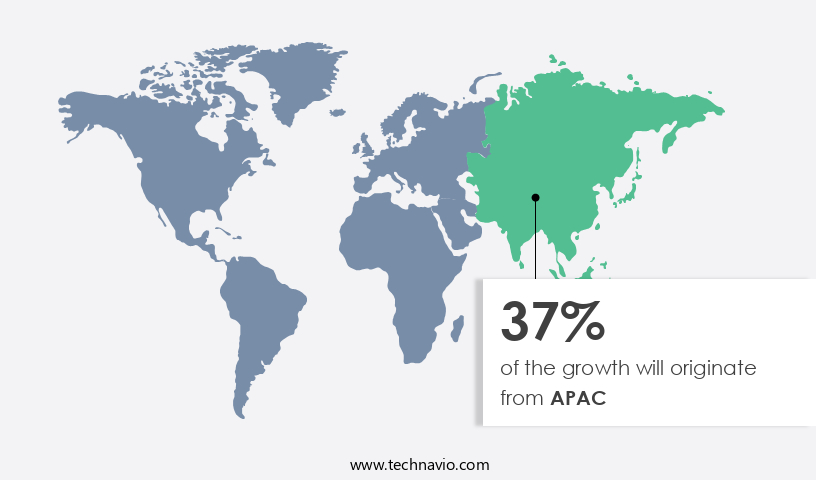
APAC is estimated to contribute 37% to the growth of the global market during the forecast period. Technavio's analysts have elaborately explained the regional trends and drivers that shape the market during the forecast period.
The market in North America is experiencing significant growth due to heightened environmental consciousness, stringent regulations, and corporate sustainability objectives. Companies are investing in advanced solutions to accurately measure, monitor, and minimize their carbon footprints. Carbon management software plays a pivotal role in this process by facilitating data collection, analysis, and reporting on emissions reduction progress. With increasing emphasis on sustainability and climate action from governments and investors, the demand for comprehensive carbon management tools is escalating. North American businesses are particularly motivated to adopt these solutions to remain competitive in a global marketplace where sustainability is a key consideration.
The software enables process optimization, energy efficiency improvements, sustainable agriculture, and renewable energy integration, among other features. Additionally, it supports climate risk assessment, emissions trading, carbon neutrality, and net zero targets. Urban planning, circular economy, biodiversity conservation, and waste management are also addressed through carbon management software. Machine learning and real-time analytics enhance the software's capabilities, providing valuable insights for continuous improvement. Green technology, carbon accounting, and environmental impact assessment are integral components of these solutions, ensuring organizations can effectively manage their carbon footprint and contribute to a more sustainable future.
Market Dynamics
Our researchers analyzed the data with 2024 as the base year, along with the key drivers, trends, and challenges. A holistic analysis of drivers will help companies refine their marketing strategies to gain a competitive advantage.
What are the key market drivers leading to the rise in the adoption of Carbon Management Software Industry?
- The continuous introduction of innovative carbon management software and solutions is the primary growth catalyst for the market. Carbon management software is witnessing significant growth as businesses increasingly focus on climate regulations, emissions reduction targets, and corporate sustainability. New software solutions are being launched to help companies track and manage their carbon emissions, with a focus on real-time analytics, decarbonization strategies, and green technology. These platforms offer improved integration with existing business systems, driving adoption rates. Energy-intensive industries, such as oil and gas, are particularly benefiting from new solutions, with advanced offerings like Iconic Air's Emissions Intelligence platform enabling monthly automated carbon emissions tracking, benchmarking, and cost management. Other sectors, including manufacturing, energy, and retail, are also seeing growth as software providers tailor their solutions to meet unique industry needs.
- Biodiversity conservation, LEED certification, and environmental management systems are becoming increasingly important, with companies seeking to set net-zero targets and demonstrate their commitment to sustainability practices. Waste management and carbon offsetting are also key areas of focus, as businesses look for ways to reduce their carbon footprint and contribute to biodiversity conservation. Innovation is being driven by tech startups entering the market, offering novel solutions and increasing competition. New technologies, such as cap and trade systems and emissions trading, are being incorporated into software platforms to provide more accurate and transparent data. Public transportation and real-time analytics are also gaining attention, as companies seek to optimize their operations and reduce emissions.
What are the market trends shaping the Carbon Management Software Industry?
- The trend in the business world is marked by an escalating number of mergers and acquisitions among companies. This phenomenon reflects the dynamic nature of modern markets and the continuous pursuit of growth and competitiveness. The market is experiencing significant growth due to the increasing emphasis on climate change mitigation and reducing carbon footprints. Mergers and acquisitions among market players are a driving force behind this expansion, as larger companies seek to strengthen their positions by combining technologies, expertise, and customer bases. These consolidated entities can invest more in research and development, leading to innovative and advanced carbon management solutions. Moreover, acquisitions enable companies to enter new markets and industries, broadening their reach and customer base. Key market trends include the integration of machine learning for data analytics, energy audits, building automation, and smart metering.
- Carbon credits, water conservation, and supply chain emissions reduction are also significant areas of focus. Sustainable investing and sustainable development are increasingly important, with clean technology and greenhouse gas emissions reduction being key priorities. Smart cities and smart grids are also emerging trends, as the need for efficient energy usage and resource conservation grows. Overall, the market is poised for continued growth as businesses and governments seek to minimize their carbon footprint and contribute to a more sustainable future.
What challenges does the Carbon Management Software Industry face during its growth?
- The absence of proficiency in utilizing carbon management software poses a significant obstacle to industry expansion. The market is experiencing significant growth due to increasing regulatory mandates, emissions trading, and climate action plans. These factors are driving the need for organizations to effectively manage and reduce their greenhouse gas emissions. However, a major challenge hindering market expansion is the lack of proper training and support for users. Carbon management software solutions require accurate data collection and analysis to optimize emissions reduction strategies. This can result in ineffective carbon accounting, missed opportunities for emissions reductions, and increased environmental risk.
- Other market dynamics include environmental impact monitoring, climate change adaptation, sustainable supply chains, and the use of cloud-based deployment, generative AI, and green bonds. Organizations must prioritize investing in proper training and support to ensure they can effectively utilize carbon management software and drive meaningful sustainability initiatives. The market is experiencing significant growth as businesses prioritize sustainability practices and climate regulations. New software solutions are being launched to address the unique needs of various industries, with a focus on real-time analytics, decarbonization strategies, and green technology. These platforms are helping companies set and achieve net-zero targets, reduce waste, and contribute to biodiversity conservation.
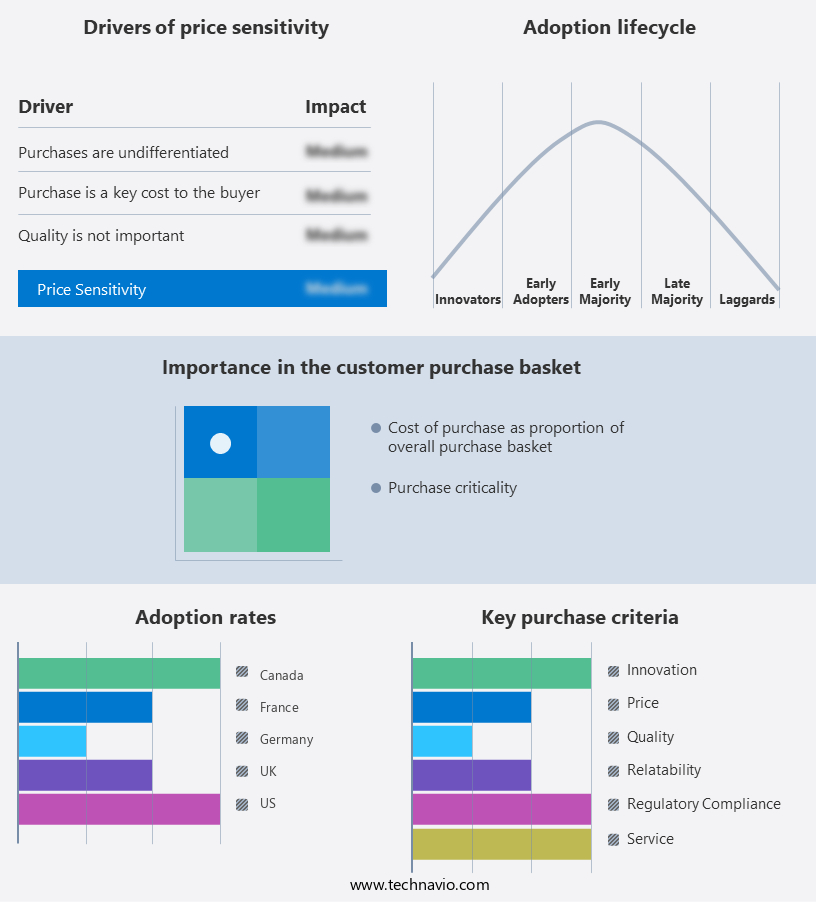
Exclusive Customer Landscape
The carbon management software market forecasting report includes the adoption lifecycle of the market, covering from the innovator's stage to the laggard's stage. It focuses on adoption rates in different regions based on penetration. Furthermore, the carbon management software market report also includes key purchase criteria and drivers of price sensitivity to help companies evaluate and develop their market growth analysis strategies.
Customer Landscape
Key Companies & Market Insights
Companies are implementing various strategies, such as strategic alliances, carbon management software market forecast, partnerships, mergers and acquisitions, geographical expansion, and product/service launches, to enhance their presence in the industry.
Carbon Direct Inc. - The company specializes in carbon management software solutions, including The Carbon Direct Platform.
The industry research and growth report includes detailed analyses of the competitive landscape of the market and information about key companies, including:
- Carbon Direct Inc.
- CarbonetiX
- Cority Software Inc.
- Cozero GmbH
- Emex Software Ltd.
- ENGIE SA
- Iconic Air Inc.
- International Business Machines Corp.
- Microsoft Corp.
- Newco Emitwise Ltd
- North Star Carbon Management Inc
- Persefoni AI Inc.
- Sage Group Plc
- Salesforce Inc.
- SAP SE
- Schneider Electric SE
- Simble Solutions Ltd.
- Sphera Solutions Inc.
- Wolters Kluwer NV
- Workiva Inc.
Qualitative and quantitative analysis of companies has been conducted to help clients understand the wider business environment as well as the strengths and weaknesses of key industry players. Data is qualitatively analyzed to categorize companies as pure play, category-focused, industry-focused, and diversified; it is quantitatively analyzed to categorize companies as dominant, leading, strong, tentative, and weak.
Recent Development and News in Carbon Management Software Market
- In January 2024, Carbon Clean Solutions (CCS), a leading carbon management company, announced the launch of its advanced CarbonClean DRS (Dynamic Regeneration System) for the cement industry, which reduces carbon emissions by up to 90%. (CCS Press Release)
- In March 2024, Schneider Electric, a global energy management and automation company, entered into a strategic partnership with EcoAct, a leading carbon consulting and technology firm, to offer integrated carbon management solutions to clients. (Schneider Electric Press Release)
- In May 2024, Siemens Energy and Microsoft Corporation announced a collaboration to develop a digital carbon management platform, combining Siemens' energy expertise with Microsoft's cloud capabilities. (Microsoft News Center)
- In April 2025, 3M, a global science company, completed the acquisition of U.K.-based Carbon3D, a pioneer in 3D carbon capture technology, for approximately USD325 million. (3M Press Release)
Research Analyst Overview
In the market, climate modeling plays a crucial role in helping businesses assess their carbon intensity and climate change resilience in the energy sector. Stakeholder engagement and climate risk management are key priorities, with renewable materials and carbon pricing becoming increasingly important. The Internet of Things and AI-driven solutions are transforming energy performance contracts, waste reduction, and demand response. Carbon taxes and energy efficiency standards are driving the adoption of carbon pricing and carbon disclosure project initiatives. The Paris Agreement and net zero commitments have led to a focus on greenhouse gas emissions reduction and corporate social responsibility.
Emission monitoring, climate change communication, and machine learning are essential software components for operational transparency. Sustainability initiatives, life cycle assessment, anaerobic digestion, and adaptation strategies are also gaining traction. The Climate Leadership Council, circular economy principles, smart grid, energy storage, and ESG solutions are shaping the future of carbon management.
Dive into Technavio's robust research methodology, blending expert interviews, extensive data synthesis, and validated models for unparalleled Carbon Management Software Market insights. See full methodology.
|
Market Scope |
|
|
Report Coverage |
Details |
|
Page number |
215 |
|
Base year |
2024 |
|
Historic period |
2019-2023 |
|
Forecast period |
2025-2029 |
|
Growth momentum & CAGR |
Accelerate at a CAGR of 17.7% |
|
Market growth 2025-2029 |
USD 15.62 billion |
|
Market structure |
Fragmented |
|
YoY growth 2024-2025(%) |
13.9 |
|
Key countries |
US, Germany, China, Canada, UK, Japan, France, India, Italy, and South Korea |
|
Competitive landscape |
Leading Companies, Market Positioning of Companies, Competitive Strategies, and Industry Risks |
What are the Key Data Covered in this Carbon Management Software Market Research and Growth Report?
- CAGR of the Carbon Management Software industry during the forecast period
- Detailed information on factors that will drive the growth and forecasting between 2025 and 2029
- Precise estimation of the size of the market and its contribution of the industry in focus to the parent market
- Accurate predictions about upcoming growth and trends and changes in consumer behaviour
- Growth of the market across North America, Europe, APAC, Middle East and Africa, and South America
- Thorough analysis of the market's competitive landscape and detailed information about companies
- Comprehensive analysis of factors that will challenge the carbon management software market growth of industry companies
We can help! Our analysts can customize this carbon management software market research report to meet your requirements.
 RIA -
RIA - 
