Carbon Monoxide Gas Sensors Market Analysis, Size, and Forecast 2026-2030: APAC (China, India, and Japan), Europe (Germany, UK, and France), North America (US, Canada, and Mexico), Middle East and Africa (Saudi Arabia, UAE, and South Africa), South America (Brazil and Argentina), and Rest of World (ROW)

Carbon Monoxide Gas Sensors Market Analysis, Size, and Forecast 2026-2030:
APAC (China, India, and Japan), Europe (Germany, UK, and France), North America (US, Canada, and Mexico), Middle East and Africa (Saudi Arabia, UAE, and South Africa), South America (Brazil and Argentina), and Rest of World (ROW)

Published: Jan 2026 297 Pages SKU: IRTNTR74158

Market Overview at a Glance

$164.3 Mn
Market Opportunity
9.2%
CAGR 2025 - 2030
39%
APAC Growth
$89.8 Mn
Medical segment 2024

Carbon Monoxide Gas Sensors Market Size 2026-2030

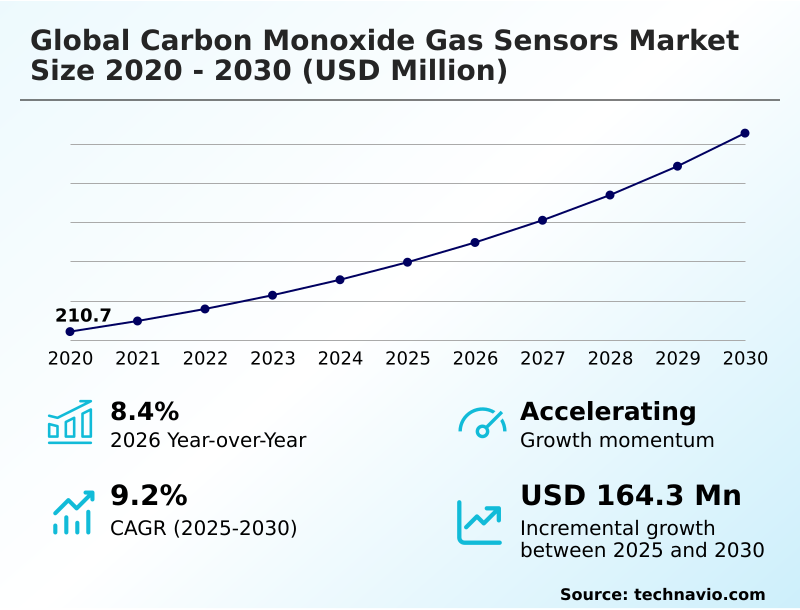
The carbon monoxide gas sensors market size is valued to increase by USD 164.3 million, at a CAGR of 9.2% from 2025 to 2030. Growth in industrial safety measures will drive the carbon monoxide gas sensors market.

Major Market Trends & Insights

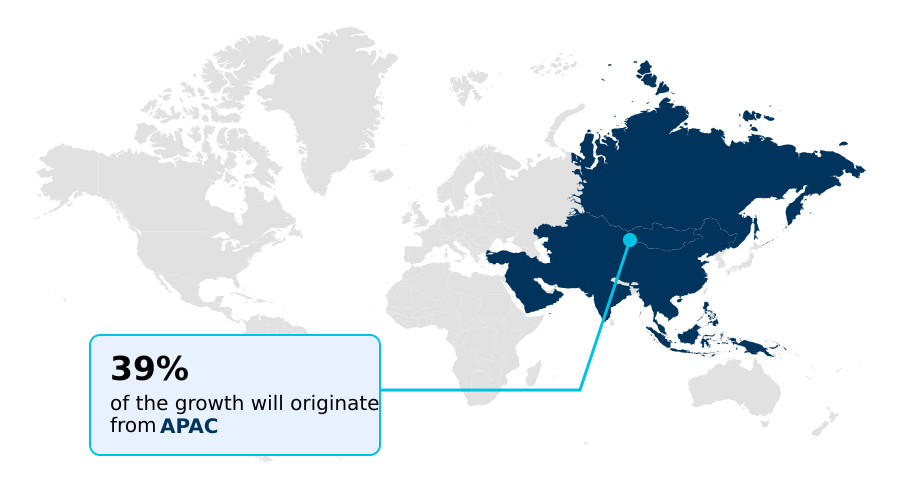
  • APAC dominated the market and accounted for a 39% growth during the forecast period.
  • By Application - Medical segment was valued at USD 89.8 million in 2024
  • By Type - Fixed sensors segment accounted for the largest market revenue share in 2024

Market Size & Forecast

  • Market Opportunities: USD 252.6 million
  • Market Future Opportunities: USD 164.3 million
  • CAGR from 2025 to 2030 : 9.2%

Market Summary

  • The Carbon Monoxide Gas Sensors market is defined by a fundamental need for safety and regulatory adherence across industrial, commercial, and residential sectors. Growth is propelled by the enforcement of stringent workplace safety standards and rising awareness of the dangers of colorless, odorless gases.
  • Technological evolution is a key dynamic, with a clear shift from basic analog devices to smart, connected systems featuring wireless connectivity and IoT compatibility. These advancements enable real-time monitoring and predictive analytics, which are crucial for proactive safety management.
  • For example, a petrochemical facility can integrate a network of sensors to monitor for leaks, with data fed into a central platform that automatically triggers ventilation systems and alerts safety personnel, optimizing response times and minimizing operational disruptions. The push for greater energy efficiency in buildings also drives demand, as sensors are used to control ventilation systems intelligently.
  • However, the complexity of these advanced systems presents challenges related to the availability of skilled technicians for proper installation and maintenance, potentially slowing adoption in some regions. The market continues to evolve with innovations in sensor materials and designs, such as MEMS sensors.

What will be the Size of the Carbon Monoxide Gas Sensors Market during the forecast period?

Get Key Insights on Market Forecast (PDF) Request Free Sample

How is the Carbon Monoxide Gas Sensors Market Segmented?

The carbon monoxide gas sensors industry research report provides comprehensive data (region-wise segment analysis), with forecasts and estimates in "USD million" for the period 2026-2030, as well as historical data from 2020-2024 for the following segments.

  • Application
    • Medical
    • Petrochemical
    • Industrial
    • Others
  • Type
    • Fixed sensors
    • Portable sensors
    • Multi-gas sensors
  • Technology
    • Electrochemical
    • Semiconductor
    • Optical
    • Metal oxide
    • Others
  • Geography
    • APAC
      • China
      • India
      • Japan
    • Europe
      • Germany
      • UK
      • France
    • North America
      • US
      • Canada
      • Mexico
    • Middle East and Africa
      • Saudi Arabia
      • UAE
      • South Africa
    • South America
      • Brazil
      • Argentina
    • Rest of World (ROW)

By Application Insights

The medical segment is estimated to witness significant growth during the forecast period.

The medical segment is a critical application area, driven by the demand for non-invasive diagnostic tools and enhanced patient safety protocols.

The adoption of high-accuracy electrochemical sensing is pivotal for analyzing exhaled breath to detect physiological conditions, with advanced cross-sensitivity filtration improving diagnostic accuracy by over 15%. This technology supports preventative care solutions and remote patient monitoring.

In clinical settings, such as during anesthesia machine monitoring, these sensors prevent patient exposure to hazardous gases.

The trend toward miniaturization and low power consumption enables the development of wearable monitors that continuously track exposure, promoting worker well-being for healthcare professionals and ensuring patient safety without compromising mobility or comfort.

These advancements are key to both emergency diagnostics and long-term health management.

Request Free Sample

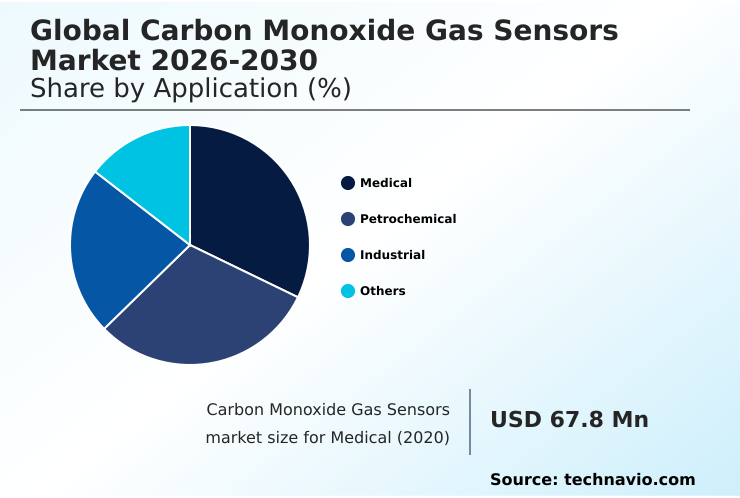
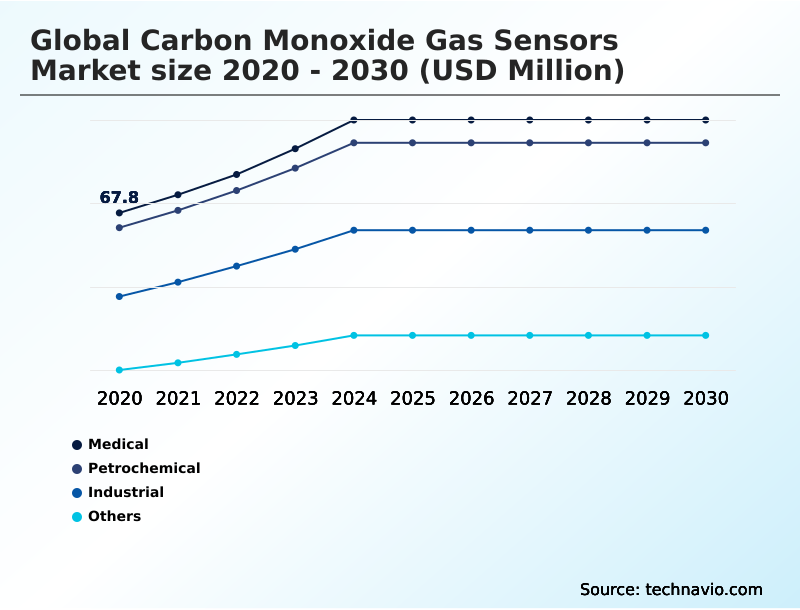
The Medical segment was valued at USD 89.8 million in 2024 and showed a gradual increase during the forecast period.

Request Free Sample

Regional Analysis

APAC is estimated to contribute 39% to the growth of the global market during the forecast period.Technavio’s analysts have elaborately explained the regional trends and drivers that shape the market during the forecast period.

See How Carbon Monoxide Gas Sensors Market Demand is Rising in APAC Request Free Sample

The geographic landscape is led by APAC, which accounts for 39% of the market's incremental growth, fueled by rapid industrialization in countries like China and India.

This region's dominance is supported by government enforcement of workplace safety standards and investments in manufacturing and infrastructure. In North America and Europe, growth is driven by the adoption of advanced technologies for building management systems and smart home ecosystems.

Innovations in optical sensing and infrared technologies are gaining traction for high-precision applications.

For instance, the deployment of real-time monitoring systems in industrial settings improves safety and has been linked to a 15% reduction in energy consumption through optimized process controls.

The development of specialized solutions, like those for hydrogen fuel cell safety and monitoring thermal runaway events in batteries, creates new opportunities globally.

Market Dynamics

Our researchers analyzed the data with 2025 as the base year, along with the key drivers, trends, and challenges. A holistic analysis of drivers will help companies refine their marketing strategies to gain a competitive advantage.

  • The global carbon monoxide gas sensors market 2026-2030 addresses diverse safety and operational needs across multiple industries. The demand for carbon monoxide sensors for mining safety is critical for preventing underground fires, while the use of portable gas detectors for oil and gas ensures worker protection in hazardous environments.
  • In healthcare, electrochemical sensors for medical diagnostics are becoming standard for non-invasive patient assessment, complemented by carbon monoxide monitoring in anesthesia machines to prevent accidental gas production. The automotive sector leverages MEMS-based sensors for automotive applications to enhance in-cabin air quality.
  • In commercial and residential settings, IoT integrated gas sensors for smart buildings and semiconductor sensors for residential safety are improving air quality monitoring. Wireless CO detectors for industrial facilities offer flexible deployment for real-time CO monitoring in petrochemical plants and ensuring carbon monoxide detection in steel production.
  • Specialized needs are met by the low concentration CO sensor for fuel cells and the optical gas sensor for high accuracy detection. Managing these systems effectively requires professional CO sensor calibration and maintenance services.
  • This is especially true when addressing cross-sensitivity issues in CO sensors, a challenge that requires advanced technical expertise, where specialized service providers can improve system reliability by over 20% compared to internal teams.

What are the key market drivers leading to the rise in the adoption of Carbon Monoxide Gas Sensors Industry?

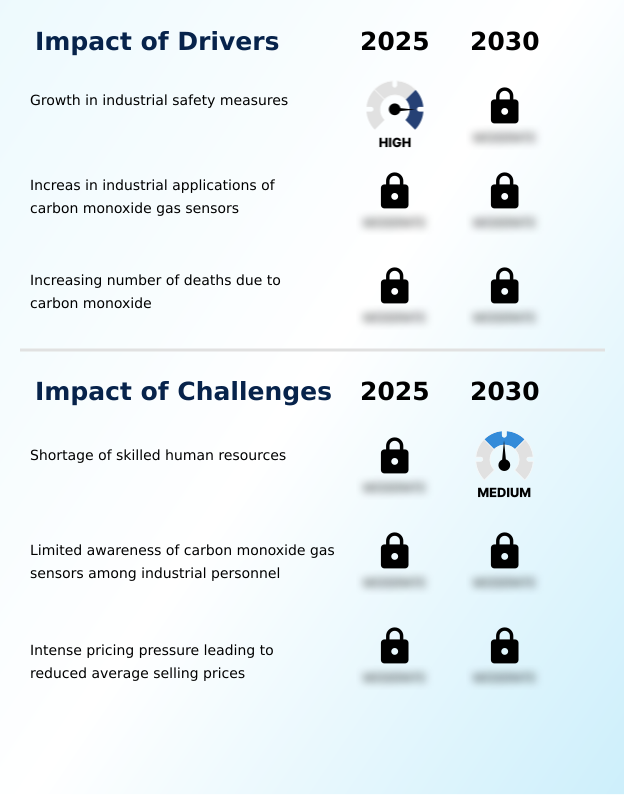
  • The increasing emphasis on stringent industrial safety measures is a primary driver for the market's growth.

  • Market growth is fundamentally driven by the enforcement of stringent industrial safety compliance and occupational health mandates. Industries are increasingly deploying fixed gas detectors with real-time monitoring capabilities to adhere to workplace safety standards, particularly for combustion process monitoring.
  • The integration of these sensors with IoT compatibility allows for advanced process control optimization, leading to efficiency gains and reduced risk. In the automotive sector, demand for exhaust sensors is rising to meet emissions regulations.
  • These industrial hygiene programs are not just about compliance; they are integral to operational continuity, with automated detection systems reducing incident-related downtime by over 20% in some manufacturing facilities.
  • This focus on safety and efficiency directly fuels investment in advanced sensing technologies.

What are the market trends shaping the Carbon Monoxide Gas Sensors Industry?

  • The development of advanced portable carbon monoxide gas sensors represents a significant market trend. This evolution is driven by the growing industry-wide requirement for mobile safety and enhanced operational efficiency.

  • Key market trends are centered on mobility, intelligence, and integration. The development of portable gas detectors, including wearable personal protective equipment, is empowering connected worker platforms in hazardous environment safety. These devices feature ergonomic designs and wireless connectivity, enabling real-time data transmission that has been shown to improve field worker safety compliance by up to 25%.
  • Concurrently, industrial automation adoption is driving demand for MEMS sensors, which offer a smaller footprint and lower power usage. This trend supports supply chain resilience by enabling more extensive monitoring networks. In commercial buildings, on-demand ventilation systems controlled by sensors can reduce energy costs by 15% or more, showcasing a clear return on investment.

What challenges does the Carbon Monoxide Gas Sensors Industry face during its growth?

  • A shortage of skilled human resources presents a significant challenge to the industry's growth, affecting sensor installation, calibration, and maintenance.

  • A primary challenge restraining market growth is the complexity of integrating diverse sensor technologies into unified platforms. While demand for multi-gas detection is rising, ensuring seamless operation across semiconductor-based detectors and catalytic bead sensors within a single system can be difficult.
  • This complexity extends to smart home ecosystems, where ensuring reliable air quality monitoring without false positives is crucial for consumer trust. In industrial settings like confined space gas detection, the need for accurate environmental monitoring is paramount, but the integration of new leakage sensors into legacy systems can increase operational costs by up to 10% during the initial phase.
  • Furthermore, optimizing for energy consumption reduction while maintaining high-performance detection for applications such as in-cabin air quality presents an ongoing technical hurdle for manufacturers.

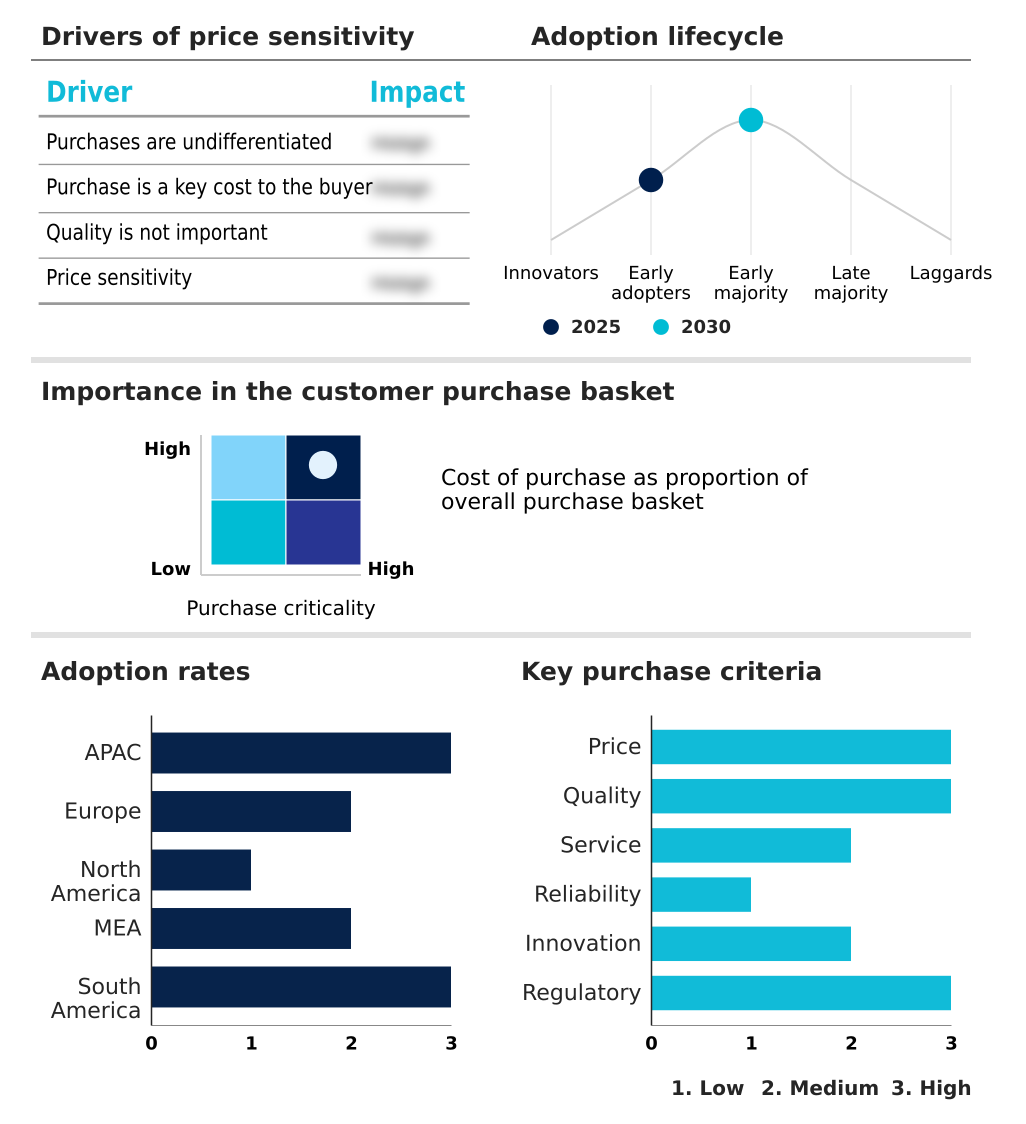
Exclusive Technavio Analysis on Customer Landscape

The carbon monoxide gas sensors market forecasting report includes the adoption lifecycle of the market, covering from the innovator’s stage to the laggard’s stage. It focuses on adoption rates in different regions based on penetration. Furthermore, the carbon monoxide gas sensors market report also includes key purchase criteria and drivers of price sensitivity to help companies evaluate and develop their market growth analysis strategies.

Customer Landscape of Carbon Monoxide Gas Sensors Industry

Competitive Landscape

Companies are implementing various strategies, such as strategic alliances, carbon monoxide gas sensors market forecast, partnerships, mergers and acquisitions, geographical expansion, and product/service launches, to enhance their presence in the industry.

ABB Ltd. - Delivering advanced sensing technologies for critical safety, automation, and environmental monitoring, ensuring high-precision gas detection and operational reliability across industries.

The industry research and growth report includes detailed analyses of the competitive landscape of the market and information about key companies, including:

  • ABB Ltd.
  • Aeroqual
  • Calibration Technologies Inc.
  • ENVEA
  • GfG Ltd.
  • Honeywell International Inc.
  • Nemoto and Co. Ltd.
  • NEW COSMOS ELECTRIC Co. Ltd.
  • Nissha Co. Ltd.
  • Renesas Electronics Corp.
  • Robert Bosch GmbH
  • Sensirion AG
  • Siemens AG
  • SPEC Sensors LLC
  • Trolex Ltd.
  • X-Sense Innovations Co. Ltd.
  • Yokogawa Electric Corp.

Qualitative and quantitative analysis of companies has been conducted to help clients understand the wider business environment as well as the strengths and weaknesses of key industry players. Data is qualitatively analyzed to categorize companies as pure play, category-focused, industry-focused, and diversified; it is quantitatively analyzed to categorize companies as dominant, leading, strong, tentative, and weak.

Recent Development and News in Carbon monoxide gas sensors market

  • In August 2025, Sensirion AG reported significant operational progress in its half-year financial update, citing strong revenue growth driven by the successful commercial ramp-up of its latest leakage sensors and a surge in demand for environmental sensing solutions across Asian markets.
  • In October 2025, Figaro Engineering Inc. announced the commercial release of a new ultra-compact metal oxide semiconductor sensor engineered to detect low concentrations of carbon monoxide within hydrogen fuel cell environments, addressing a niche segment of the green energy market.
  • In February 2025, Sensirion AG launched the SCD43, an upgraded photoacoustic gas sensor designed to meet stringent building standards. This technological breakthrough is expected to influence the development of highly accurate optical carbon monoxide detection solutions.
  • In May 2025, Honeywell International Inc. strengthened its presence in the Middle East by inaugurating a new gas detector assembly line at the Masdar Innovation Centre in Abu Dhabi, focusing on the production of fixed and portable detectors to support regional industrial safety initiatives.

Dive into Technavio’s robust research methodology, blending expert interviews, extensive data synthesis, and validated models for unparalleled Carbon Monoxide Gas Sensors Market insights. See full methodology.

Market Scope
Page number 297
Base year 2025
Historic period 2020-2024
Forecast period 2026-2030
Growth momentum & CAGR Accelerate at a CAGR of 9.2%
Market growth 2026-2030 USD 164.3 million
Market structure Fragmented
YoY growth 2025-2026(%) 8.4%
Key countries China, India, Japan, South Korea, Australia, Indonesia, Germany, UK, France, Italy, Spain, The Netherlands, US, Canada, Mexico, Saudi Arabia, UAE, South Africa, Israel, Turkey, Brazil, Argentina and Chile
Competitive landscape Leading Companies, Market Positioning of Companies, Competitive Strategies, and Industry Risks

Request Free Sample

Research Analyst Overview

  • The market is advancing through innovations in core detection technologies and their integration into broader safety ecosystems. The industry relies heavily on established methods like electrochemical sensing and catalytic bead sensors, but the adoption of MEMS sensors and optical sensing is accelerating.
  • This shift is driven by demands for higher performance, including low power consumption, high accuracy, and miniaturization for portable gas detectors and personal protective equipment. Advanced cross-sensitivity filtration is critical for reducing false alarms in complex industrial environments. The integration of wireless connectivity and IoT compatibility in fixed gas detectors enables sophisticated real-time monitoring and supports industrial hygiene programs.
  • Innovations such as the photoacoustic gas sensor, along with infrared and paramagnetic technologies, are enhancing detection capabilities. For boardroom decisions, the focus is on compliance and efficiency; connected sensor networks have demonstrated the ability to reduce incident reporting times by over 30%.
  • Applications now span from traditional environmental monitoring to specialized uses like improving in-cabin air quality with advanced exhaust sensors and ensuring safety with ergonomic designs for equipment.

What are the Key Data Covered in this Carbon Monoxide Gas Sensors Market Research and Growth Report?

  • What is the expected growth of the Carbon Monoxide Gas Sensors Market between 2026 and 2030?

    • USD 164.3 million, at a CAGR of 9.2%

  • What segmentation does the market report cover?

    • The report is segmented by Application (Medical, Petrochemical, Industrial, and Others), Type (Fixed sensors, Portable sensors, and Multi-gas sensors), Technology (Electrochemical, Semiconductor, Optical, Metal oxide, and Others) and Geography (APAC, Europe, North America, Middle East and Africa, South America)

  • Which regions are analyzed in the report?

    • APAC, Europe, North America, Middle East and Africa and South America

  • What are the key growth drivers and market challenges?

    • Growth in industrial safety measures, Shortage of skilled human resources

  • Who are the major players in the Carbon Monoxide Gas Sensors Market?

    • ABB Ltd., Aeroqual, Calibration Technologies Inc., ENVEA, GfG Ltd., Honeywell International Inc., Nemoto and Co. Ltd., NEW COSMOS ELECTRIC Co. Ltd., Nissha Co. Ltd., Renesas Electronics Corp., Robert Bosch GmbH, Sensirion AG, Siemens AG, SPEC Sensors LLC, Trolex Ltd., X-Sense Innovations Co. Ltd. and Yokogawa Electric Corp.

Market Research Insights

  • The market is shaped by the push for greater operational intelligence and safety compliance. The integration of advanced sensors into connected worker platforms is improving hazardous environment safety, with some industrial users reporting a 30% reduction in incident response times. This shift toward proactive risk management is reinforced by stringent occupational health mandates.
  • In commercial buildings, the adoption of smart building management systems that leverage sensor data for on-demand ventilation has been shown to achieve energy consumption reduction of up to 25% compared to continuous-run systems.
  • Furthermore, the focus on predictive maintenance, enabled by continuous data streams, helps organizations align with workplace safety standards more effectively, reducing equipment downtime by over 15% and ensuring supply chain resilience.

We can help! Our analysts can customize this carbon monoxide gas sensors market research report to meet your requirements.

Get in touch

1. Executive Summary

1.1 Market overview

Executive Summary - Chart on Market Overview
Executive Summary - Data Table on Market Overview
Executive Summary - Chart on Global Market Characteristics
Executive Summary - Chart on Market by Geography
Executive Summary - Chart on Market Segmentation by Application
Executive Summary - Chart on Market Segmentation by Type
Executive Summary - Chart on Market Segmentation by Technology
Executive Summary - Chart on Incremental Growth
Executive Summary - Data Table on Incremental Growth
Executive Summary - Chart on Company Market Positioning

2. Technavio Analysis

2.1 Analysis of price sensitivity, lifecycle, customer purchase basket, adoption rates, and purchase criteria

2.2 Criticality of inputs and Factors of differentiation

Chart on Overview on criticality of inputs and factors of differentiation

2.3 Factors of disruption

Chart on Overview on factors of disruption

2.4 Impact of drivers and challenges

Chart on Impact of drivers and challenges in 2025 and 2030

3. Market Landscape

3.1 Market ecosystem

Chart on Parent Market
Data Table on - Parent Market

3.2 Market characteristics

Chart on Market characteristics analysis

3.3 Value chain analysis

Chart on Value chain analysis

4. Market Sizing

4.1 Market definition

Data Table on Offerings of companies included in the market definition

4.2 Market segment analysis

Market segments

4.3 Market size 2025

4.4 Market outlook: Forecast for 2025-2030

Chart on Global - Market size and forecast 2025-2030 ($ million)
Data Table on Global - Market size and forecast 2025-2030 ($ million)
Chart on Global Market: Year-over-year growth 2025-2030 (%)
Data Table on Global Market: Year-over-year growth 2025-2030 (%)

5. Historic Market Size

5.1 Global Carbon Monoxide Gas Sensors Market 2020 - 2024

Historic Market Size - Data Table on Global Carbon Monoxide Gas Sensors Market 2020 - 2024 ($ million)

5.2 Application segment analysis 2020 - 2024

Historic Market Size - Application Segment 2020 - 2024 ($ million)

5.3 Type segment analysis 2020 - 2024

Historic Market Size - Type Segment 2020 - 2024 ($ million)

5.4 Technology segment analysis 2020 - 2024

Historic Market Size - Technology Segment 2020 - 2024 ($ million)

5.5 Geography segment analysis 2020 - 2024

Historic Market Size - Geography Segment 2020 - 2024 ($ million)

5.6 Country segment analysis 2020 - 2024

Historic Market Size - Country Segment 2020 - 2024 ($ million)

6. Qualitative Analysis

6.1 Impact of AI in global carbon monoxide gas sensors market

7. Five Forces Analysis

7.1 Five forces summary

Five forces analysis - Comparison between 2025 and 2030

7.2 Bargaining power of buyers

Bargaining power of buyers - Impact of key factors 2025 and 2030

7.3 Bargaining power of suppliers

Bargaining power of suppliers - Impact of key factors in 2025 and 2030

7.4 Threat of new entrants

Threat of new entrants - Impact of key factors in 2025 and 2030

7.5 Threat of substitutes

Threat of substitutes - Impact of key factors in 2025 and 2030

7.6 Threat of rivalry

Threat of rivalry - Impact of key factors in 2025 and 2030

7.7 Market condition

Chart on Market condition - Five forces 2025 and 2030

8. Market Segmentation by Application

8.1 Market segments

Chart on Application - Market share 2025-2030 (%)
Data Table on Application - Market share 2025-2030 (%)

8.2 Comparison by Application

Chart on Comparison by Application
Data Table on Comparison by Application

8.3 Medical - Market size and forecast 2025-2030

Chart on Medical - Market size and forecast 2025-2030 ($ million)
Data Table on Medical - Market size and forecast 2025-2030 ($ million)
Chart on Medical - Year-over-year growth 2025-2030 (%)
Data Table on Medical - Year-over-year growth 2025-2030 (%)

8.4 Petrochemical - Market size and forecast 2025-2030

Chart on Petrochemical - Market size and forecast 2025-2030 ($ million)
Data Table on Petrochemical - Market size and forecast 2025-2030 ($ million)
Chart on Petrochemical - Year-over-year growth 2025-2030 (%)
Data Table on Petrochemical - Year-over-year growth 2025-2030 (%)

8.5 Industrial - Market size and forecast 2025-2030

Chart on Industrial - Market size and forecast 2025-2030 ($ million)
Data Table on Industrial - Market size and forecast 2025-2030 ($ million)
Chart on Industrial - Year-over-year growth 2025-2030 (%)
Data Table on Industrial - Year-over-year growth 2025-2030 (%)

8.6 Others - Market size and forecast 2025-2030

Chart on Others - Market size and forecast 2025-2030 ($ million)
Data Table on Others - Market size and forecast 2025-2030 ($ million)
Chart on Others - Year-over-year growth 2025-2030 (%)
Data Table on Others - Year-over-year growth 2025-2030 (%)

8.7 Market opportunity by Application

Market opportunity by Application ($ million)
Data Table on Market opportunity by Application ($ million)

9. Market Segmentation by Type

9.1 Market segments

Chart on Type - Market share 2025-2030 (%)
Data Table on Type - Market share 2025-2030 (%)

9.2 Comparison by Type

Chart on Comparison by Type
Data Table on Comparison by Type

9.3 Fixed sensors - Market size and forecast 2025-2030

Chart on Fixed sensors - Market size and forecast 2025-2030 ($ million)
Data Table on Fixed sensors - Market size and forecast 2025-2030 ($ million)
Chart on Fixed sensors - Year-over-year growth 2025-2030 (%)
Data Table on Fixed sensors - Year-over-year growth 2025-2030 (%)

9.4 Portable sensors - Market size and forecast 2025-2030

Chart on Portable sensors - Market size and forecast 2025-2030 ($ million)
Data Table on Portable sensors - Market size and forecast 2025-2030 ($ million)
Chart on Portable sensors - Year-over-year growth 2025-2030 (%)
Data Table on Portable sensors - Year-over-year growth 2025-2030 (%)

9.5 Multi-gas sensors - Market size and forecast 2025-2030

Chart on Multi-gas sensors - Market size and forecast 2025-2030 ($ million)
Data Table on Multi-gas sensors - Market size and forecast 2025-2030 ($ million)
Chart on Multi-gas sensors - Year-over-year growth 2025-2030 (%)
Data Table on Multi-gas sensors - Year-over-year growth 2025-2030 (%)

9.6 Market opportunity by Type

Market opportunity by Type ($ million)
Data Table on Market opportunity by Type ($ million)

10. Market Segmentation by Technology

10.1 Market segments

Chart on Technology - Market share 2025-2030 (%)
Data Table on Technology - Market share 2025-2030 (%)

10.2 Comparison by Technology

Chart on Comparison by Technology
Data Table on Comparison by Technology

10.3 Electrochemical - Market size and forecast 2025-2030

Chart on Electrochemical - Market size and forecast 2025-2030 ($ million)
Data Table on Electrochemical - Market size and forecast 2025-2030 ($ million)
Chart on Electrochemical - Year-over-year growth 2025-2030 (%)
Data Table on Electrochemical - Year-over-year growth 2025-2030 (%)

10.4 Semiconductor - Market size and forecast 2025-2030

Chart on Semiconductor - Market size and forecast 2025-2030 ($ million)
Data Table on Semiconductor - Market size and forecast 2025-2030 ($ million)
Chart on Semiconductor - Year-over-year growth 2025-2030 (%)
Data Table on Semiconductor - Year-over-year growth 2025-2030 (%)

10.5 Optical - Market size and forecast 2025-2030

Chart on Optical - Market size and forecast 2025-2030 ($ million)
Data Table on Optical - Market size and forecast 2025-2030 ($ million)
Chart on Optical - Year-over-year growth 2025-2030 (%)
Data Table on Optical - Year-over-year growth 2025-2030 (%)

10.6 Metal oxide - Market size and forecast 2025-2030

Chart on Metal oxide - Market size and forecast 2025-2030 ($ million)
Data Table on Metal oxide - Market size and forecast 2025-2030 ($ million)
Chart on Metal oxide - Year-over-year growth 2025-2030 (%)
Data Table on Metal oxide - Year-over-year growth 2025-2030 (%)

10.7 Others - Market size and forecast 2025-2030

Chart on Others - Market size and forecast 2025-2030 ($ million)
Data Table on Others - Market size and forecast 2025-2030 ($ million)
Chart on Others - Year-over-year growth 2025-2030 (%)
Data Table on Others - Year-over-year growth 2025-2030 (%)

10.8 Market opportunity by Technology

Market opportunity by Technology ($ million)
Data Table on Market opportunity by Technology ($ million)

11. Customer Landscape

11.1 Customer landscape overview

Analysis of price sensitivity, lifecycle, customer purchase basket, adoption rates, and purchase criteria

12. Geographic Landscape

12.1 Geographic segmentation

Chart on Market share by geography 2025-2030 (%)
Data Table on Market share by geography 2025-2030 (%)

12.2 Geographic comparison

Chart on Geographic comparison
Data Table on Geographic comparison

12.3 APAC - Market size and forecast 2025-2030

Chart on APAC - Market size and forecast 2025-2030 ($ million)
Data Table on APAC - Market size and forecast 2025-2030 ($ million)
Chart on APAC - Year-over-year growth 2025-2030 (%)
Data Table on APAC - Year-over-year growth 2025-2030 (%)
Chart on Regional Comparison - APAC
Data Table on Regional Comparison - APAC

12.3.1 China - Market size and forecast 2025-2030

Chart on China - Market size and forecast 2025-2030 ($ million)
Data Table on China - Market size and forecast 2025-2030 ($ million)
Chart on China - Year-over-year growth 2025-2030 (%)
Data Table on China - Year-over-year growth 2025-2030 (%)

12.3.2 India - Market size and forecast 2025-2030

Chart on India - Market size and forecast 2025-2030 ($ million)
Data Table on India - Market size and forecast 2025-2030 ($ million)
Chart on India - Year-over-year growth 2025-2030 (%)
Data Table on India - Year-over-year growth 2025-2030 (%)

12.3.3 Japan - Market size and forecast 2025-2030

Chart on Japan - Market size and forecast 2025-2030 ($ million)
Data Table on Japan - Market size and forecast 2025-2030 ($ million)
Chart on Japan - Year-over-year growth 2025-2030 (%)
Data Table on Japan - Year-over-year growth 2025-2030 (%)

12.3.4 South Korea - Market size and forecast 2025-2030

Chart on South Korea - Market size and forecast 2025-2030 ($ million)
Data Table on South Korea - Market size and forecast 2025-2030 ($ million)
Chart on South Korea - Year-over-year growth 2025-2030 (%)
Data Table on South Korea - Year-over-year growth 2025-2030 (%)

12.3.5 Australia - Market size and forecast 2025-2030

Chart on Australia - Market size and forecast 2025-2030 ($ million)
Data Table on Australia - Market size and forecast 2025-2030 ($ million)
Chart on Australia - Year-over-year growth 2025-2030 (%)
Data Table on Australia - Year-over-year growth 2025-2030 (%)

12.3.6 Indonesia - Market size and forecast 2025-2030

Chart on Indonesia - Market size and forecast 2025-2030 ($ million)
Data Table on Indonesia - Market size and forecast 2025-2030 ($ million)
Chart on Indonesia - Year-over-year growth 2025-2030 (%)
Data Table on Indonesia - Year-over-year growth 2025-2030 (%)

12.4 Europe - Market size and forecast 2025-2030

Chart on Europe - Market size and forecast 2025-2030 ($ million)
Data Table on Europe - Market size and forecast 2025-2030 ($ million)
Chart on Europe - Year-over-year growth 2025-2030 (%)
Data Table on Europe - Year-over-year growth 2025-2030 (%)
Chart on Regional Comparison - Europe
Data Table on Regional Comparison - Europe

12.4.1 Germany - Market size and forecast 2025-2030

Chart on Germany - Market size and forecast 2025-2030 ($ million)
Data Table on Germany - Market size and forecast 2025-2030 ($ million)
Chart on Germany - Year-over-year growth 2025-2030 (%)
Data Table on Germany - Year-over-year growth 2025-2030 (%)

12.4.2 UK - Market size and forecast 2025-2030

Chart on UK - Market size and forecast 2025-2030 ($ million)
Data Table on UK - Market size and forecast 2025-2030 ($ million)
Chart on UK - Year-over-year growth 2025-2030 (%)
Data Table on UK - Year-over-year growth 2025-2030 (%)

12.4.3 France - Market size and forecast 2025-2030

Chart on France - Market size and forecast 2025-2030 ($ million)
Data Table on France - Market size and forecast 2025-2030 ($ million)
Chart on France - Year-over-year growth 2025-2030 (%)
Data Table on France - Year-over-year growth 2025-2030 (%)

12.4.4 Italy - Market size and forecast 2025-2030

Chart on Italy - Market size and forecast 2025-2030 ($ million)
Data Table on Italy - Market size and forecast 2025-2030 ($ million)
Chart on Italy - Year-over-year growth 2025-2030 (%)
Data Table on Italy - Year-over-year growth 2025-2030 (%)

12.4.5 Spain - Market size and forecast 2025-2030

Chart on Spain - Market size and forecast 2025-2030 ($ million)
Data Table on Spain - Market size and forecast 2025-2030 ($ million)
Chart on Spain - Year-over-year growth 2025-2030 (%)
Data Table on Spain - Year-over-year growth 2025-2030 (%)

12.4.6 The Netherlands - Market size and forecast 2025-2030

Chart on The Netherlands - Market size and forecast 2025-2030 ($ million)
Data Table on The Netherlands - Market size and forecast 2025-2030 ($ million)
Chart on The Netherlands - Year-over-year growth 2025-2030 (%)
Data Table on The Netherlands - Year-over-year growth 2025-2030 (%)

12.5 North America - Market size and forecast 2025-2030

Chart on North America - Market size and forecast 2025-2030 ($ million)
Data Table on North America - Market size and forecast 2025-2030 ($ million)
Chart on North America - Year-over-year growth 2025-2030 (%)
Data Table on North America - Year-over-year growth 2025-2030 (%)
Chart on Regional Comparison - North America
Data Table on Regional Comparison - North America

12.5.1 US - Market size and forecast 2025-2030

Chart on US - Market size and forecast 2025-2030 ($ million)
Data Table on US - Market size and forecast 2025-2030 ($ million)
Chart on US - Year-over-year growth 2025-2030 (%)
Data Table on US - Year-over-year growth 2025-2030 (%)

12.5.2 Canada - Market size and forecast 2025-2030

Chart on Canada - Market size and forecast 2025-2030 ($ million)
Data Table on Canada - Market size and forecast 2025-2030 ($ million)
Chart on Canada - Year-over-year growth 2025-2030 (%)
Data Table on Canada - Year-over-year growth 2025-2030 (%)

12.5.3 Mexico - Market size and forecast 2025-2030

Chart on Mexico - Market size and forecast 2025-2030 ($ million)
Data Table on Mexico - Market size and forecast 2025-2030 ($ million)
Chart on Mexico - Year-over-year growth 2025-2030 (%)
Data Table on Mexico - Year-over-year growth 2025-2030 (%)

12.6 Middle East and Africa - Market size and forecast 2025-2030

Chart on Middle East and Africa - Market size and forecast 2025-2030 ($ million)
Data Table on Middle East and Africa - Market size and forecast 2025-2030 ($ million)
Chart on Middle East and Africa - Year-over-year growth 2025-2030 (%)
Data Table on Middle East and Africa - Year-over-year growth 2025-2030 (%)
Chart on Regional Comparison - Middle East and Africa
Data Table on Regional Comparison - Middle East and Africa

12.6.1 Saudi Arabia - Market size and forecast 2025-2030

Chart on Saudi Arabia - Market size and forecast 2025-2030 ($ million)
Data Table on Saudi Arabia - Market size and forecast 2025-2030 ($ million)
Chart on Saudi Arabia - Year-over-year growth 2025-2030 (%)
Data Table on Saudi Arabia - Year-over-year growth 2025-2030 (%)

12.6.2 UAE - Market size and forecast 2025-2030

Chart on UAE - Market size and forecast 2025-2030 ($ million)
Data Table on UAE - Market size and forecast 2025-2030 ($ million)
Chart on UAE - Year-over-year growth 2025-2030 (%)
Data Table on UAE - Year-over-year growth 2025-2030 (%)

12.6.3 South Africa - Market size and forecast 2025-2030

Chart on South Africa - Market size and forecast 2025-2030 ($ million)
Data Table on South Africa - Market size and forecast 2025-2030 ($ million)
Chart on South Africa - Year-over-year growth 2025-2030 (%)
Data Table on South Africa - Year-over-year growth 2025-2030 (%)

12.6.4 Israel - Market size and forecast 2025-2030

Chart on Israel - Market size and forecast 2025-2030 ($ million)
Data Table on Israel - Market size and forecast 2025-2030 ($ million)
Chart on Israel - Year-over-year growth 2025-2030 (%)
Data Table on Israel - Year-over-year growth 2025-2030 (%)

12.6.5 Turkey - Market size and forecast 2025-2030

Chart on Turkey - Market size and forecast 2025-2030 ($ million)
Data Table on Turkey - Market size and forecast 2025-2030 ($ million)
Chart on Turkey - Year-over-year growth 2025-2030 (%)
Data Table on Turkey - Year-over-year growth 2025-2030 (%)

12.7 South America - Market size and forecast 2025-2030

Chart on South America - Market size and forecast 2025-2030 ($ million)
Data Table on South America - Market size and forecast 2025-2030 ($ million)
Chart on South America - Year-over-year growth 2025-2030 (%)
Data Table on South America - Year-over-year growth 2025-2030 (%)
Chart on Regional Comparison - South America
Data Table on Regional Comparison - South America

12.7.1 Brazil - Market size and forecast 2025-2030

Chart on Brazil - Market size and forecast 2025-2030 ($ million)
Data Table on Brazil - Market size and forecast 2025-2030 ($ million)
Chart on Brazil - Year-over-year growth 2025-2030 (%)
Data Table on Brazil - Year-over-year growth 2025-2030 (%)

12.7.2 Argentina - Market size and forecast 2025-2030

Chart on Argentina - Market size and forecast 2025-2030 ($ million)
Data Table on Argentina - Market size and forecast 2025-2030 ($ million)
Chart on Argentina - Year-over-year growth 2025-2030 (%)
Data Table on Argentina - Year-over-year growth 2025-2030 (%)

12.7.3 Chile - Market size and forecast 2025-2030

Chart on Chile - Market size and forecast 2025-2030 ($ million)
Data Table on Chile - Market size and forecast 2025-2030 ($ million)
Chart on Chile - Year-over-year growth 2025-2030 (%)
Data Table on Chile - Year-over-year growth 2025-2030 (%)

12.8 Market opportunity by geography

Market opportunity by geography ($ million)
Data Tables on Market opportunity by geography ($ million)

13. Drivers, Challenges, and Opportunity

13.1 Market drivers

Growth in industrial safety measures
Increas in industrial applications of carbon monoxide gas sensors
Increasing number of deaths due to carbon monoxide

13.2 Market challenges

Shortage of skilled human resources
Limited awareness of carbon monoxide gas sensors among industrial personnel
Intense pricing pressure leading to reduced average selling prices

13.3 Impact of drivers and challenges

Impact of drivers and challenges in 2025 and 2030

13.4 Market opportunities

Development of portable carbon monoxide gas sensors
Rise in new product launches
Growth in industrial automation adoption

14. Competitive Landscape

14.1 Overview

14.2

Overview on criticality of inputs and factors of differentiation

14.3 Landscape disruption

Overview on factors of disruption

14.4 Industry risks

Impact of key risks on business

15. Competitive Analysis

15.1 Companies profiled

Companies covered

15.2 Company ranking index

15.3 Market positioning of companies

Matrix on companies position and classification

15.4 ABB Ltd.

ABB Ltd. - Overview
ABB Ltd. - Business segments
ABB Ltd. - Key news
ABB Ltd. - Key offerings
ABB Ltd. - Segment focus
SWOT

15.5 Aeroqual

Aeroqual - Overview
Aeroqual - Product / Service
Aeroqual - Key offerings
SWOT

15.6 Calibration Technologies Inc.

Calibration Technologies Inc. - Overview
Calibration Technologies Inc. - Product / Service
Calibration Technologies Inc. - Key offerings
SWOT

15.7 Honeywell International Inc.

Honeywell International Inc. - Overview
Honeywell International Inc. - Business segments
Honeywell International Inc. - Key news
Honeywell International Inc. - Key offerings
Honeywell International Inc. - Segment focus
SWOT

15.8 Nemoto and Co. Ltd.

Nemoto and Co. Ltd. - Overview
Nemoto and Co. Ltd. - Product / Service
Nemoto and Co. Ltd. - Key offerings
SWOT

15.9 NEW COSMOS ELECTRIC Co. Ltd.

NEW COSMOS ELECTRIC Co. Ltd. - Overview
NEW COSMOS ELECTRIC Co. Ltd. - Product / Service
NEW COSMOS ELECTRIC Co. Ltd. - Key offerings
SWOT

15.10 Nissha Co. Ltd.

Nissha Co. Ltd. - Overview
Nissha Co. Ltd. - Business segments
Nissha Co. Ltd. - Key offerings
Nissha Co. Ltd. - Segment focus
SWOT

15.11 Renesas Electronics Corp.

Renesas Electronics Corp. - Overview
Renesas Electronics Corp. - Business segments
Renesas Electronics Corp. - Key news
Renesas Electronics Corp. - Key offerings
Renesas Electronics Corp. - Segment focus
SWOT

15.12 Robert Bosch GmbH

Robert Bosch GmbH - Overview
Robert Bosch GmbH - Product / Service
Robert Bosch GmbH - Key news
Robert Bosch GmbH - Key offerings
SWOT

15.13 Sensirion AG

Sensirion AG - Overview
Sensirion AG - Product / Service
Sensirion AG - Key news
Sensirion AG - Key offerings
SWOT

15.14 Siemens AG

Siemens AG - Overview
Siemens AG - Business segments
Siemens AG - Key news
Siemens AG - Key offerings
Siemens AG - Segment focus
SWOT

15.15 SPEC Sensors LLC

SPEC Sensors LLC - Overview
SPEC Sensors LLC - Product / Service
SPEC Sensors LLC - Key offerings
SWOT

15.16 Trolex Ltd.

Trolex Ltd. - Overview
Trolex Ltd. - Product / Service
Trolex Ltd. - Key offerings
SWOT

15.17 X-Sense Innovations Co. Ltd.

X-Sense Innovations Co. Ltd. - Overview
X-Sense Innovations Co. Ltd. - Product / Service
X-Sense Innovations Co. Ltd. - Key offerings
SWOT

15.18 Yokogawa Electric Corp.

Yokogawa Electric Corp. - Overview
Yokogawa Electric Corp. - Business segments
Yokogawa Electric Corp. - Key news
Yokogawa Electric Corp. - Key offerings
Yokogawa Electric Corp. - Segment focus
SWOT

16. Appendix

16.1 Scope of the report

Market definition
Objectives
Notes and caveats

16.2 Inclusions and exclusions checklist

Inclusions checklist
Exclusions checklist

16.3 Currency conversion rates for US$

16.4 Research methodology

16.5 Data procurement

Information sources

16.6 Data validation

16.7 Validation techniques employed for market sizing

16.8 Data synthesis

16.9 360 degree market analysis

16.10 List of abbreviations

Research Methodology

Technavio presents a detailed picture of the market by way of study, synthesis, and summation of data from multiple sources. The analysts have presented the various facets of the market with a particular focus on identifying the key industry influencers. The data thus presented is comprehensive, reliable, and the result of extensive research, both primary and secondary.

INFORMATION SOURCES

Primary sources

  • Manufacturers and suppliers
  • Channel partners
  • Industry experts
  • Strategic decision makers

Secondary sources

  • Industry journals and periodicals
  • Government data
  • Financial reports of key industry players
  • Historical data
  • Press releases

DATA ANALYSIS

Data Synthesis

  • Collation of data
  • Estimation of key figures
  • Analysis of derived insights

Data Validation

  • Triangulation with data models
  • Reference against proprietary databases
  • Corroboration with industry experts

REPORT WRITING

Qualitative

  • Market drivers
  • Market challenges
  • Market trends
  • Five forces analysis

Quantitative

  • Market size and forecast
  • Market segmentation
  • Geographical insights
  • Competitive landscape

Interested in this report?

Get your sample now to see our research methodology and insights!

Download Now

Frequently Asked Questions

Carbon Monoxide Gas Sensors market growth will increase by USD 164.3 million during 2026-2030.

The Carbon Monoxide Gas Sensors market is expected to grow at a CAGR of 9.2% during 2026-2030.

Carbon Monoxide Gas Sensors market is segmented by Application (Medical, Petrochemical, Industrial, Others) Type (Fixed sensors, Portable sensors, Multi-gas sensors) Technology (Electrochemical, Semiconductor, Optical, Metal oxide, Others)

ABB Ltd., Aeroqual, Calibration Technologies Inc., ENVEA, GfG Ltd., Honeywell International Inc., Nemoto and Co. Ltd., NEW COSMOS ELECTRIC Co. Ltd., Nissha Co. Ltd., Renesas Electronics Corp., Robert Bosch GmbH, Sensirion AG, Siemens AG, SPEC Sensors LLC, Trolex Ltd., X-Sense Innovations Co. Ltd., Yokogawa Electric Corp. are a few of the key vendors in the Carbon Monoxide Gas Sensors market.

APAC will register the highest growth rate of 39% among the other regions. Therefore, the Carbon Monoxide Gas Sensors market in APAC is expected to garner significant business opportunities for the vendors during the forecast period.

China, India, Japan, South Korea, Australia, Indonesia, Germany, UK, France, Italy, Spain, The Netherlands, US, Canada, Mexico, Saudi Arabia, UAE, South Africa, Israel, Turkey, Brazil, Argentina, Chile

  • Growth in industrial safety measures is the driving factor this market.

The Carbon Monoxide Gas Sensors market vendors should focus on grabbing business opportunities from the Application segment as it accounted for the largest market share in the base year.