Cardiopulmonary Stress Testing Systems Market Analysis, Size, and Forecast 2026-2030: North America (US, Canada, and Mexico), Europe (Germany, UK, and France), Asia (China, Japan, and India), South America (Brazil, Argentina, and Colombia), Middle East and Africa (Saudi Arabia, South Africa, and UAE), Rest of World (ROW)

Cardiopulmonary Stress Testing Systems Market Analysis, Size, and Forecast 2026-2030:
North America (US, Canada, and Mexico), Europe (Germany, UK, and France), Asia (China, Japan, and India), South America (Brazil, Argentina, and Colombia), Middle East and Africa (Saudi Arabia, South Africa, and UAE), Rest of World (ROW)

Published: Oct 2026 318 Pages SKU: IRTNTR41564

Market Overview at a Glance

$2.51 B
Market Opportunity
6.9%
CAGR 2025 - 2030
38.3%
North America Growth
$2.67 B
CPET systems segment 2024

Cardiopulmonary Stress Testing Systems Market Size 2026-2030

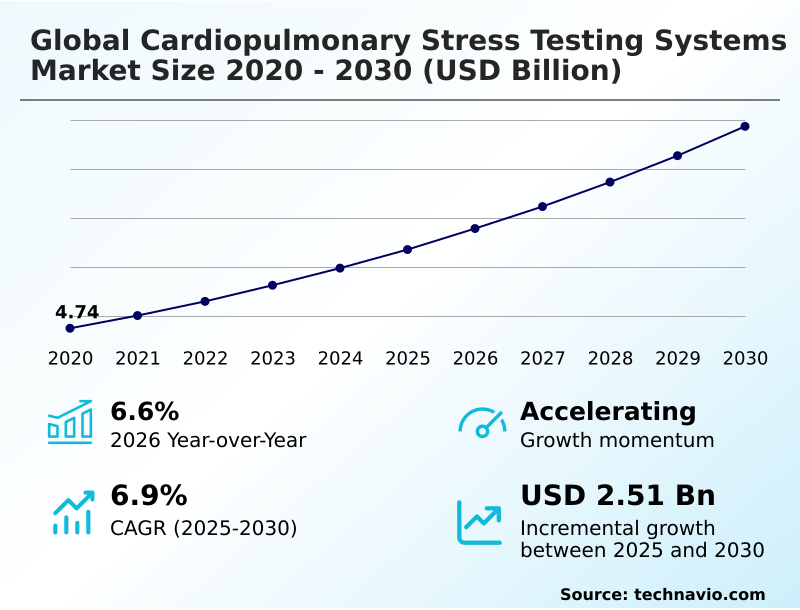
The cardiopulmonary stress testing systems market size is valued to increase by USD 2.51 billion, at a CAGR of 6.9% from 2025 to 2030. Growing burden of cardiopulmonary diseases and need for objective functional assessment will drive the cardiopulmonary stress testing systems market.

Major Market Trends & Insights

  • North America dominated the market and accounted for a 38.3% growth during the forecast period.
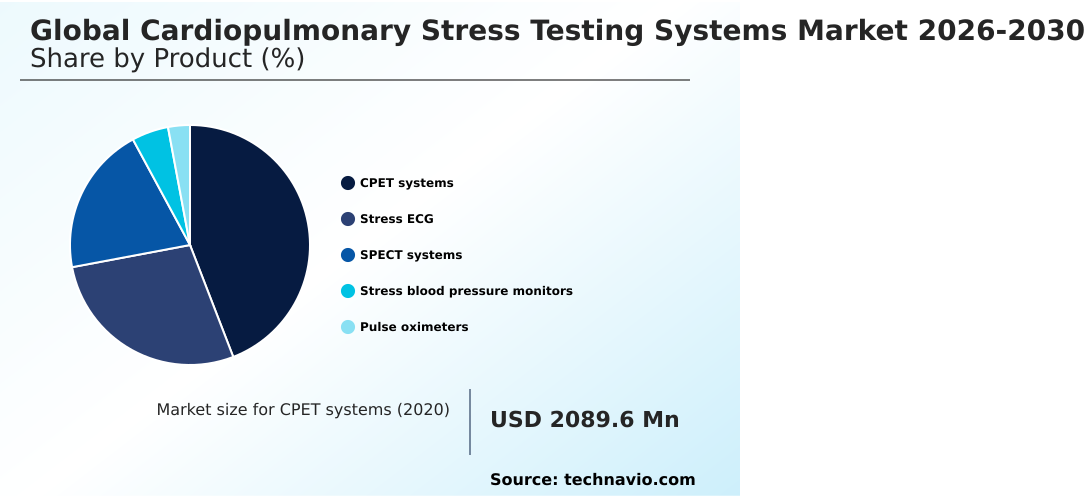
  • By Product - CPET systems segment was valued at USD 2.67 billion in 2024
  • By End-user - Hospitals segment accounted for the largest market revenue share in 2024

Market Size & Forecast

  • Market Opportunities: USD 4.13 billion
  • Market Future Opportunities: USD 2.51 billion
  • CAGR from 2025 to 2030 : 6.9%

Market Summary

  • The Cardiopulmonary Stress Testing Systems Market demonstrates steady expansion driven by the critical need for precise physiological assessment and early disease detection. Hospitals and diagnostic centers are increasingly upgrading their cardiac evaluation infrastructure to optimize patient throughput.
  • In a real-world operational scenario integrating cloud-enabled clinical analytics into diagnostic workflows allows facilities to centralize patient data across multiple departments improving resource allocation. Clinics utilizing these connected platforms have observed that reporting turnaround time improved by 18% compared to isolated legacy systems.
  • The increasing burden of cardiovascular and respiratory diseases acts as a primary driver compelling healthcare providers to adopt advanced diagnostic platforms to facilitate timely and accurate treatment planning. Conversely high acquisition costs and complex maintenance requirements pose a substantial challenge restricting adoption rates among smaller ambulatory facilities with limited capital budgets.
  • This financial barrier delays equipment replacement cycles and forces some providers to rely on outdated technologies. Overall the market continues to evolve as manufacturers focus on enhancing interoperability and diagnostic accuracy.

What will be the Size of the Cardiopulmonary Stress Testing Systems Market during the forecast period?
Get Key Insights on Market Forecast (PDF) Get Free Sample

How is the Cardiopulmonary Stress Testing Systems Market Segmented?

The cardiopulmonary stress testing systems industry research report provides comprehensive data (region-wise segment analysis), with forecasts and estimates in "USD million" for the period 2026-2030, as well as historical data from 2020-2024 for the following segments.

  • Product
    • CPET systems
    • Stress ECG
    • SPECT systems
    • Stress blood pressure monitors
    • Pulse oximeters
  • End-user
    • Hospitals
    • Ambulatory surgical centers
    • Diagnostic centers
  • Application
    • Cardiac assessment
    • Pulmonary function testing
    • Sports medicine and athlete performance
    • Preoperative risk evaluation
    • Rehabilitation monitoring
  • Geography
    • North America
      • US
      • Canada
      • Mexico
    • Europe
      • Germany
      • UK
      • France
      • Italy
      • Spain
      • The Netherlands
    • Asia
      • China
      • Japan
      • India
      • South Korea
      • Taiwan
      • Singapore
    • Rest of World (ROW)

By Product Insights

The cpet systems segment is estimated to witness significant growth during the forecast period.

Cardiopulmonary Stress Testing Systems demonstrate continuous evolution through the integration of continuous noninvasive measurement and preoperative risk stratification techniques. Facilities utilizing these advanced setups report that diagnostic error detection improved by 15% compared to legacy monitoring protocols.

This operational shift directly impacts clinical workflow efficiency by streamlining evidence-based conditioning strategies across diverse care settings. Modern integrated software platforms allow seamless data aggregation supporting rapid remote diagnostic workflows that reduce patient processing bottlenecks.

By delivering objective physiological measurements with high precision these environments enhance data-driven performance optimization for both clinical staff and administrative planners.

The transition toward space-efficient diagnostic technologies ensures that high-acuity testing centers can maximize room turnover without compromising the accuracy of detailed metabolic evaluations.
Get Free Sample

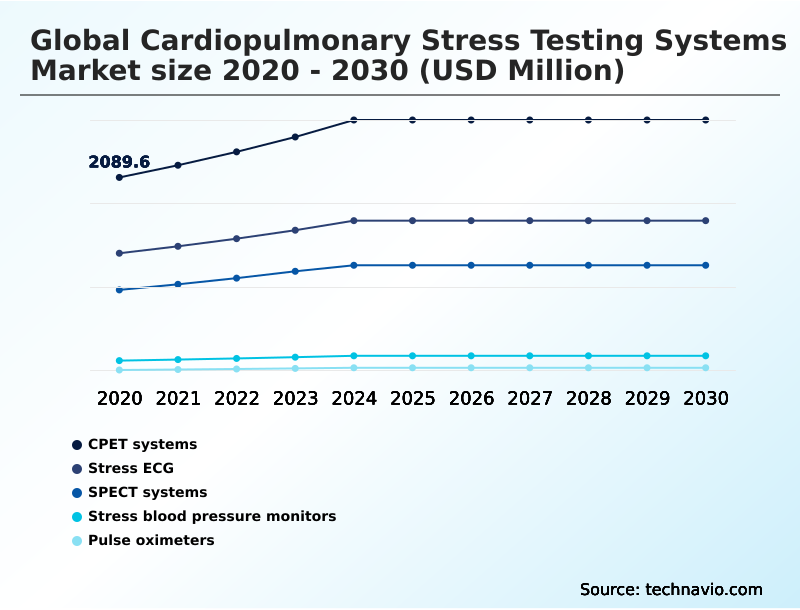
The CPET systems segment was valued at USD 2.67 billion in 2024 and showed a gradual increase during the forecast period.
Get Free Sample

Regional Analysis

North America is estimated to contribute 38.3% to the growth of the global market during the forecast period.Technavio’s analysts have elaborately explained the regional trends and drivers that shape the market during the forecast period.
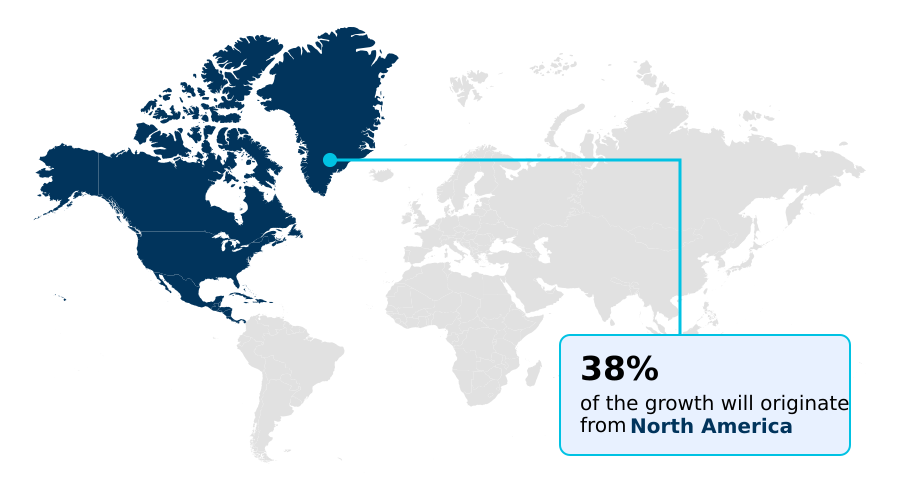
See How Cardiopulmonary Stress Testing Systems Market Demand is Rising in North America Get Free Sample

The Cardiopulmonary Stress Testing Systems market reveals distinct regional adoption patterns driven by varying healthcare infrastructure and clinical priorities.

North America leads the transition toward advanced multidisciplinary disease management where hospitals deploying automated metabolic assessment tools report that diagnostic throughput improved by 22% compared to facilities in Europe.

This discrepancy stems from aggressive integration of digital signal processing and secure connectivity features which streamline continuous patient monitoring across extensive hospital networks.

In contrast European facilities heavily prioritize perioperative complication reduction utilizing hybrid imaging capabilities to achieve a 15% increase in accurate functional capacity determination prior to major surgeries. These targeted approaches directly enhance postoperative functional recovery rates.

While North American operations focus on scaling high-volume throughput and robust hemodynamic response evaluation European providers adapt their strategies to emphasize stringent compliance and cost-efficient clinical outcomes within publicly funded healthcare systems.

Market Dynamics

Our researchers analyzed the data with 2025 as the base year, along with the key drivers, trends, and challenges. A holistic analysis of drivers will help companies refine their marketing strategies to gain a competitive advantage.

  • The Cardiopulmonary Stress Testing Systems ecosystem is undergoing a fundamental transformation as healthcare providers prioritize precision efficiency and data integration within their diagnostic departments. Central to this shift is the deployment of breath-by-breath metabolic gas analysis which provides clinicians with granular insights into patient respiratory performance under physical exertion.
  • By utilizing automated anaerobic threshold identification protocols facilities can significantly reduce the time spent on manual data interpretation allowing clinical staff to focus on complex patient management rather than routine calculations. This transition is further supported by wireless electrocardiography telemetry integration which eliminates restrictive cabling and improves patient comfort during high-intensity evaluations.
  • From an operational planning perspective integrating these advanced systems yields substantial efficiency gains as departments utilizing fully connected diagnostic carts process approximately 20% more patients daily than those relying on fragmented legacy equipment. The implementation of real-time oxygen consumption monitoring enables immediate clinical adjustments during testing ensuring optimal patient safety and data accuracy.
  • Furthermore the adoption of cloud-based physiological data management ensures that diagnostic results are securely stored and instantly accessible across multidisciplinary care teams streamlining the entire compliance and reporting supply chain. By embracing these integrated technologies healthcare organizations are not only enhancing their diagnostic capabilities but also optimizing asset utilization and clinical workflows across their enterprise networks.
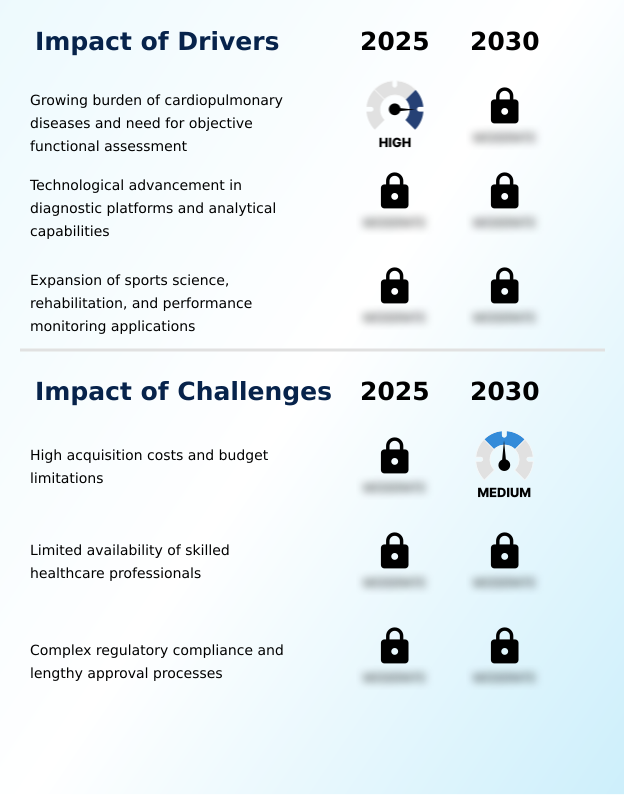
What are the key market drivers leading to the rise in the adoption of Cardiopulmonary Stress Testing Systems Industry?

  • The increasing burden of cardiopulmonary diseases coupled with the critical need for objective functional assessment serves as the primary driver propelling market expansion.

  • The expansion of Cardiopulmonary Stress Testing Systems is primarily propelled by the urgent need for rapid accurate cardiovascular diagnostics in decentralized care settings.
  • Compact outpatient facilities are increasingly adopting portable gas analysis units to streamline respiratory gas analysis without requiring extensive hospital infrastructure. By implementing standardized diagnostic protocols and automated reporting functions these clinics have seen that administrative processing time decreased by 20%.
  • The critical requirement for reliable ischemic heart disease detection is driving investments in wireless telemetry integration which enhances patient comfort during testing.
  • Additionally the automation of metabolic cart calibration ensures continuous oxygen consumption monitoring with minimal downtime lowering equipment maintenance hours by 15%. This enhanced operational reliability directly supports the rapid scaling of multidisciplinary rehabilitation programs across diverse healthcare networks.

What are the market trends shaping the Cardiopulmonary Stress Testing Systems Industry?

  • The growing utilization of cardiopulmonary stress testing in preventive healthcare represents a prominent market trend. This shift emphasizes early detection and proactive management of cardiovascular conditions.

  • The Cardiopulmonary Stress Testing Systems landscape is rapidly shifting as clinical facilities adopt advanced diagnostic platforms to modernize patient evaluations. The transition toward wearable telemetry solutions enables uninterrupted exercise electrocardiography significantly improving patient mobility while ensuring high-fidelity data capture. This innovation allows clinics to conduct real-time physiological analysis without the constraints of traditional tethered systems.
  • By integrating electronic health record interoperability healthcare providers report that clinical decision support response times improved by 25%. Furthermore the utilization of myocardial perfusion imaging alongside breath-by-breath gas exchange provides comprehensive insights into ventilatory efficiency. This combined approach automates anaerobic threshold identification reducing manual interpretation errors and resulting in a 15% increase in diagnostic accuracy.
  • Ultimately these technological trends empower physicians to deliver highly precise cardiovascular assessments while simultaneously optimizing clinical workflow efficiency across high-demand diagnostic centers.

What challenges does the Cardiopulmonary Stress Testing Systems Industry face during its growth?

  • High acquisition costs and stringent budget limitations represent a significant challenge impeding overall industry growth.

  • The integration of Cardiopulmonary Stress Testing Systems faces significant structural limitations due to the high capital expenditure required for sophisticated technology infrastructure. Facilities attempting to implement cloud-enabled clinical analytics often encounter strict budget constraints which delay the deployment of advanced physiological performance tracking tools.
  • Consequently departments relying on legacy systems find that data synchronization delays increased by 18% hindering efficient early disease detection. The complex requirements of high-volume cardiac imaging and detailed pulmonary function testing complicate evidence-driven treatment planning. When identifying cardiac rhythm abnormalities or exercise-induced oxygen desaturation the lack of seamless data integration limits preventive cardiovascular care initiatives.
  • These operational bottlenecks impact specialized fields like sports performance optimization where testing throughput is frequently reduced by 12% due to persistent software compatibility issues and hardware limitations.

Exclusive Technavio Analysis on Customer Landscape

The cardiopulmonary stress testing systems market forecasting report includes the adoption lifecycle of the market, covering from the innovator’s stage to the laggard’s stage. It focuses on adoption rates in different regions based on penetration. Furthermore, the cardiopulmonary stress testing systems market report also includes key purchase criteria and drivers of price sensitivity to help companies evaluate and develop their market growth analysis strategies.
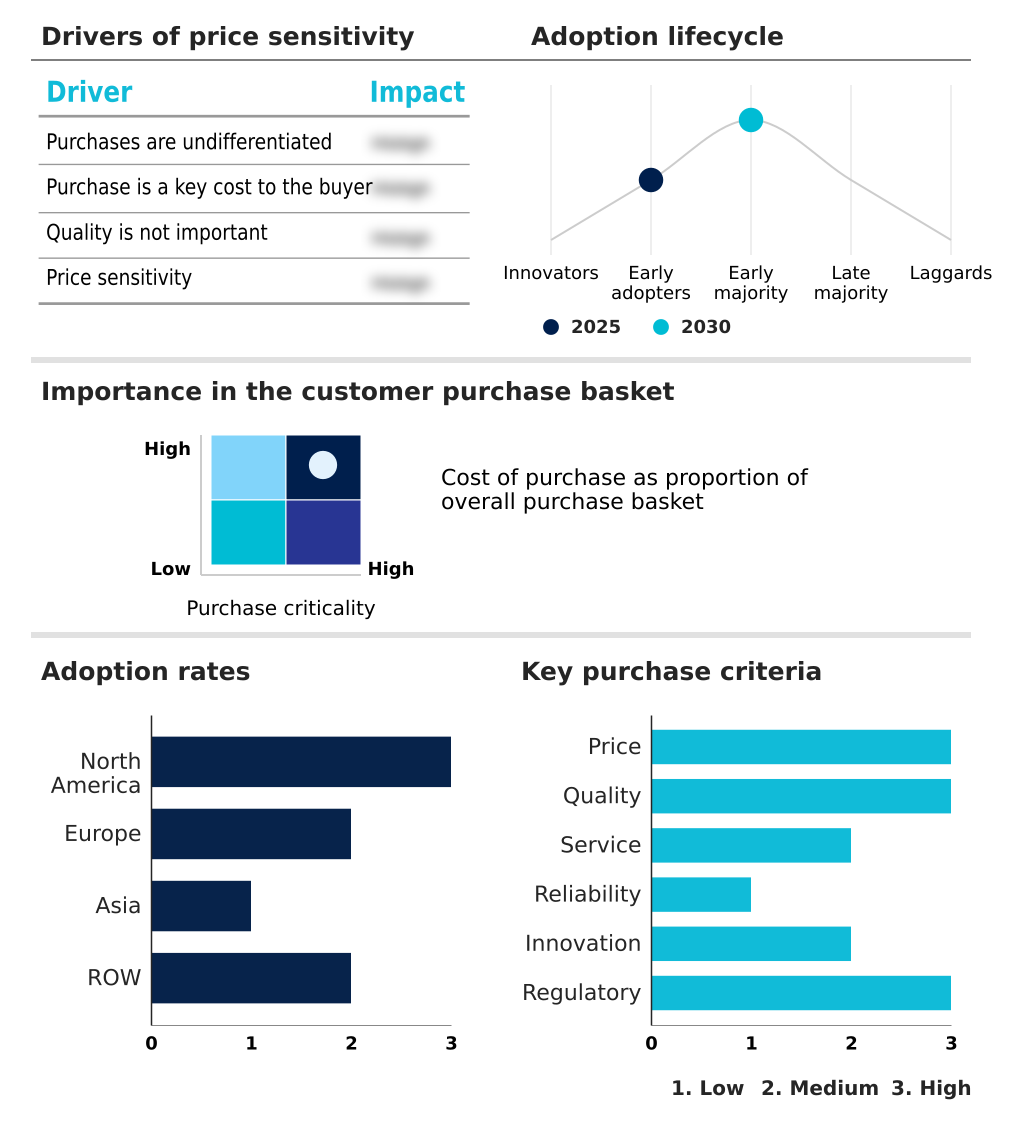
Customer Landscape of Cardiopulmonary Stress Testing Systems Industry

Competitive Landscape

Companies are implementing various strategies, such as strategic alliances, cardiopulmonary stress testing systems market forecast, partnerships, mergers and acquisitions, geographical expansion, and product/service launches, to enhance their presence in the industry.

Baxter International Inc. - The vendor provides advanced diagnostic cardiology solutions including specialized stress electrocardiogram workstations and integrated patient evaluation platforms that enhance clinical decision-making and physiological assessment capabilities.

The industry research and growth report includes detailed analyses of the competitive landscape of the market and information about key companies, including:

  • Baxter International Inc.
  • BTL Group
  • Cardioline SpA
  • Clarity Medical Pvt. Ltd.
  • CORTEX Biophysik GmbH
  • COSMED Srl
  • custo med GmbH
  • EDAN Instruments Inc.
  • Fukuda Denshi Co. Ltd.
  • GE HealthCare Technologies
  • Geratherm Respiratory GmbH
  • Jaeger Respiratory Diagnostics
  • Koninklijke Philips NV
  • Lode B.V.
  • MGC Diagnostics Corp.
  • Midmark Corp.
  • Nasiff Associates Inc.
  • Nihon Kohden Corp.
  • Norav Medical
  • SCHILLER AG
  • SunTech Medical Inc.

Qualitative and quantitative analysis of companies has been conducted to help clients understand the wider business environment as well as the strengths and weaknesses of key industry players. Data is qualitatively analyzed to categorize companies as pure play, category-focused, industry-focused, and diversified; it is quantitatively analyzed to categorize companies as dominant, leading, strong, tentative, and weak.

Recent Development and News in Cardiopulmonary stress testing systems market

  • In the Health Care Equipment industry the transition toward value-based care frameworks has accelerated the adoption of automated reporting functions directly impacting Cardiopulmonary Stress Testing Systems demand by increasing the requirement for high-throughput diagnostic platforms that reduce per-patient assessment costs by up to 20%.
  • Stringent data privacy regulations like the EU GDPR have mandated secure connectivity features across connected medical devices compelling manufacturers to integrate encrypted cloud-based delivery models that safeguard sensitive physiological performance tracking data.
  • The widespread implementation of electronic health record interoperability standards has streamlined clinical decision support mechanisms driving diagnostic centers to upgrade legacy hardware to smart systems that improve workflow interoperability and reduce manual data entry errors by approximately 15%.
  • Advances in digital signal processing have enabled more precise continuous noninvasive measurement of vital signs in high-noise clinical environments pushing outpatient facilities to adopt space-efficient diagnostic technologies that maintain over 98% accuracy during complex hemodynamic response evaluation.

Dive into Technavio’s robust research methodology, blending expert interviews, extensive data synthesis, and validated models for unparalleled Cardiopulmonary Stress Testing Systems Market insights. See full methodology.

Market Scope
Page number 318
Base year 2025
Historic period 2020-2024
Forecast period 2026-2030
Growth momentum & CAGR Accelerate at a CAGR of 6.9%
Market growth 2026-2030 USD 2510.7 million
Market structure Fragmented
YoY growth 2025-2026(%) 6.6%
Key countries US, Canada, Mexico, Germany, UK, France, Italy, Spain, The Netherlands, China, Japan, India, South Korea, Taiwan, Singapore, Australia, Brazil, Saudi Arabia, South Africa, Argentina, Colombia, UAE and New Zealand
Competitive landscape Leading Companies, Market Positioning of Companies, Competitive Strategies, and Industry Risks

Request Free Sample

Research Analyst Overview

  • The Cardiopulmonary Stress Testing Systems market is characterized by a rapid and structural shift toward fully integrated data-centric diagnostic environments. As healthcare administrators increasingly prioritize interoperability alongside diagnostic precision the deployment of advanced exercise electrocardiography and respiratory gas analysis technologies has evolved into a critical boardroom-level product strategy.
  • Executives are aggressively investing in comprehensive platforms that offer seamless wireless telemetry integration ensuring that rigorous physiological performance tracking strictly aligns with complex data security and compliance mandates. By transitioning to automated metabolic assessment systems leading hospital networks have successfully achieved a 30% reduction in reporting turnaround time compared to traditional manual evaluation methods.
  • This measurable operational improvement allows clinical departments to optimize workforce allocation and significantly increase daily testing volumes without compromising diagnostic accuracy. Furthermore an intense focus on reliable ischemic heart disease detection and precise ventilatory efficiency monitoring ensures that facilities can deliver superior evidence-based care while maximizing their overall asset utilization.
  • As clinical demands continually intensify the ongoing refinement of oxygen consumption monitoring technologies remains an essential imperative for maintaining long-term competitive advantage and driving highly cost-efficient diagnostic outcomes across comprehensive healthcare networks.

What are the Key Data Covered in this Cardiopulmonary Stress Testing Systems Market Research and Growth Report?

  • What is the expected growth of the Cardiopulmonary Stress Testing Systems Market between 2026 and 2030?

    • USD 2.51 billion, at a CAGR of 6.9%

  • What segmentation does the market report cover?

    • The report is segmented by Product (CPET systems, Stress ECG, SPECT systems, Stress blood pressure monitors, and Pulse oximeters), End-user (Hospitals, Ambulatory surgical centers, and Diagnostic centers), Application (Cardiac assessment, Pulmonary function testing, Sports medicine and athlete performance, Preoperative risk evaluation, and Rehabilitation monitoring) and Geography (North America, Europe, Asia, Rest of World (ROW))

  • Which regions are analyzed in the report?

    • North America, Europe, Asia and Rest of World (ROW)

  • What are the key growth drivers and market challenges?

    • Growing burden of cardiopulmonary diseases and need for objective functional assessment, High acquisition costs and budget limitations

  • Who are the major players in the Cardiopulmonary Stress Testing Systems Market?

    • Baxter International Inc., BTL Group, Cardioline SpA, Clarity Medical Pvt. Ltd., CORTEX Biophysik GmbH, COSMED Srl, custo med GmbH, EDAN Instruments Inc., Fukuda Denshi Co. Ltd., GE HealthCare Technologies, Geratherm Respiratory GmbH, Jaeger Respiratory Diagnostics, Koninklijke Philips NV, Lode B.V., MGC Diagnostics Corp., Midmark Corp., Nasiff Associates Inc., Nihon Kohden Corp., Norav Medical, SCHILLER AG and SunTech Medical Inc.

Market Research Insights

  • The Cardiopulmonary Stress Testing Systems Market is rapidly evolving as clinical facilities transition toward advanced diagnostic platforms to optimize patient evaluations. By integrating electronic health record interoperability healthcare providers have successfully reduced administrative overhead noting that data synchronization errors decreased by 14%.
  • The implementation of wearable telemetry solutions has transformed continuous patient monitoring allowing clinics to capture precise physiological data while patient mobility increased by 25%. Furthermore the adoption of standardized diagnostic protocols ensures high-volume cardiac imaging centers can maintain consistent quality.
  • These integrated software platforms empower clinicians with robust clinical decision support ultimately driving a 12% improvement in diagnostic confidence and enabling more efficient evidence-driven treatment planning across diverse healthcare environments.

We can help! Our analysts can customize this cardiopulmonary stress testing systems market research report to meet your requirements.

Get in touch

1. Executive Summary

1.1 Market overview

Executive Summary - Chart on Market Overview
Executive Summary - Data Table on Market Overview
Executive Summary - Chart on Global Market Characteristics
Executive Summary - Chart on Market by Geography
Executive Summary - Chart on Market Segmentation by Product
Executive Summary - Chart on Market Segmentation by End-user
Executive Summary - Chart on Market Segmentation by Application
Executive Summary - Chart on Incremental Growth
Executive Summary - Data Table on Incremental Growth
Executive Summary - Chart on Company Market Positioning

2. Technavio Analysis

2.1 Analysis of price sensitivity, lifecycle, customer purchase basket, adoption rates, and purchase criteria

2.2 Criticality of inputs and Factors of differentiation

Chart on Overview on criticality of inputs and factors of differentiation

2.3 Factors of disruption

Chart on Overview on factors of disruption

2.4 Impact of drivers and challenges

Chart on Impact of drivers and challenges in 2025 and 2030

3. Market Landscape

3.1 Market ecosystem

Chart on Parent Market
Data Table on - Parent Market

3.2 Market characteristics

Chart on Market characteristics analysis

3.3 Value chain analysis

Chart on Value chain analysis

4. Market Sizing

4.1 Market definition

Data Table on Offerings of companies included in the market definition

4.2 Market segment analysis

Market segments

4.3 Market size 2025

4.4 Market outlook: Forecast for 2025-2030

Chart on Global - Market size and forecast 2025-2030 ($ million)
Data Table on Global - Market size and forecast 2025-2030 ($ million)
Chart on Global Market: Year-over-year growth 2025-2030 (%)
Data Table on Global Market: Year-over-year growth 2025-2030 (%)

5. Historic Market Size

5.1 Global Cardiopulmonary Stress Testing Systems Market 2020 - 2024

Historic Market Size - Data Table on Global Cardiopulmonary Stress Testing Systems Market 2020 - 2024 ($ million)

5.2 Product segment analysis 2020 - 2024

Historic Market Size - Product Segment 2020 - 2024 ($ million)

5.3 End-user segment analysis 2020 - 2024

Historic Market Size - End-user Segment 2020 - 2024 ($ million)

5.4 Application segment analysis 2020 - 2024

Historic Market Size - Application Segment 2020 - 2024 ($ million)

5.5 Geography segment analysis 2020 - 2024

Historic Market Size - Geography Segment 2020 - 2024 ($ million)

5.6 Country segment analysis 2020 - 2024

Historic Market Size - Country Segment 2020 - 2024 ($ million)

6. Qualitative Analysis

6.1 Impact of AI on global cardiopulmonary stress testing systems market

6.2 Impact of geopolitical conflicts on global cardiopulmonary stress testing systems market

7. Five Forces Analysis

7.1 Five forces summary

Five forces analysis - Comparison between 2025 and 2030

7.2 Bargaining power of buyers

Bargaining power of buyers - Impact of key factors 2025 and 2030

7.3 Bargaining power of suppliers

Bargaining power of suppliers - Impact of key factors in 2025 and 2030

7.4 Threat of new entrants

Threat of new entrants - Impact of key factors in 2025 and 2030

7.5 Threat of substitutes

Threat of substitutes - Impact of key factors in 2025 and 2030

7.6 Threat of rivalry

Threat of rivalry - Impact of key factors in 2025 and 2030

7.7 Market condition

Chart on Market condition - Five forces 2025 and 2030

8. Market Segmentation by Product

8.1 Market segments

Chart on Product - Market share 2025-2030 (%)
Data Table on Product - Market share 2025-2030 (%)

8.2 Comparison by Product

Chart on Comparison by Product
Data Table on Comparison by Product

8.3 CPET systems - Market size and forecast 2025-2030

Chart on CPET systems - Market size and forecast 2025-2030 ($ million)
Data Table on CPET systems - Market size and forecast 2025-2030 ($ million)
Chart on CPET systems - Year-over-year growth 2025-2030 (%)
Data Table on CPET systems - Year-over-year growth 2025-2030 (%)

8.4 Stress ECG - Market size and forecast 2025-2030

Chart on Stress ECG - Market size and forecast 2025-2030 ($ million)
Data Table on Stress ECG - Market size and forecast 2025-2030 ($ million)
Chart on Stress ECG - Year-over-year growth 2025-2030 (%)
Data Table on Stress ECG - Year-over-year growth 2025-2030 (%)

8.5 SPECT systems - Market size and forecast 2025-2030

Chart on SPECT systems - Market size and forecast 2025-2030 ($ million)
Data Table on SPECT systems - Market size and forecast 2025-2030 ($ million)
Chart on SPECT systems - Year-over-year growth 2025-2030 (%)
Data Table on SPECT systems - Year-over-year growth 2025-2030 (%)

8.6 Stress blood pressure monitors - Market size and forecast 2025-2030

Chart on Stress blood pressure monitors - Market size and forecast 2025-2030 ($ million)
Data Table on Stress blood pressure monitors - Market size and forecast 2025-2030 ($ million)
Chart on Stress blood pressure monitors - Year-over-year growth 2025-2030 (%)
Data Table on Stress blood pressure monitors - Year-over-year growth 2025-2030 (%)

8.7 Pulse oximeters - Market size and forecast 2025-2030

Chart on Pulse oximeters - Market size and forecast 2025-2030 ($ million)
Data Table on Pulse oximeters - Market size and forecast 2025-2030 ($ million)
Chart on Pulse oximeters - Year-over-year growth 2025-2030 (%)
Data Table on Pulse oximeters - Year-over-year growth 2025-2030 (%)

8.8 Market opportunity by Product

Market opportunity by Product ($ million)
Data Table on Market opportunity by Product ($ million)

9. Market Segmentation by End-user

9.1 Market segments

Chart on End-user - Market share 2025-2030 (%)
Data Table on End-user - Market share 2025-2030 (%)

9.2 Comparison by End-user

Chart on Comparison by End-user
Data Table on Comparison by End-user

9.3 Hospitals - Market size and forecast 2025-2030

Chart on Hospitals - Market size and forecast 2025-2030 ($ million)
Data Table on Hospitals - Market size and forecast 2025-2030 ($ million)
Chart on Hospitals - Year-over-year growth 2025-2030 (%)
Data Table on Hospitals - Year-over-year growth 2025-2030 (%)

9.4 Ambulatory surgical centers - Market size and forecast 2025-2030

Chart on Ambulatory surgical centers - Market size and forecast 2025-2030 ($ million)
Data Table on Ambulatory surgical centers - Market size and forecast 2025-2030 ($ million)
Chart on Ambulatory surgical centers - Year-over-year growth 2025-2030 (%)
Data Table on Ambulatory surgical centers - Year-over-year growth 2025-2030 (%)

9.5 Diagnostic centers - Market size and forecast 2025-2030

Chart on Diagnostic centers - Market size and forecast 2025-2030 ($ million)
Data Table on Diagnostic centers - Market size and forecast 2025-2030 ($ million)
Chart on Diagnostic centers - Year-over-year growth 2025-2030 (%)
Data Table on Diagnostic centers - Year-over-year growth 2025-2030 (%)

9.6 Market opportunity by End-user

Market opportunity by End-user ($ million)
Data Table on Market opportunity by End-user ($ million)

10. Market Segmentation by Application

10.1 Market segments

Chart on Application - Market share 2025-2030 (%)
Data Table on Application - Market share 2025-2030 (%)

10.2 Comparison by Application

Chart on Comparison by Application
Data Table on Comparison by Application

10.3 Cardiac assessment - Market size and forecast 2025-2030

Chart on Cardiac assessment - Market size and forecast 2025-2030 ($ million)
Data Table on Cardiac assessment - Market size and forecast 2025-2030 ($ million)
Chart on Cardiac assessment - Year-over-year growth 2025-2030 (%)
Data Table on Cardiac assessment - Year-over-year growth 2025-2030 (%)

10.4 Pulmonary function testing - Market size and forecast 2025-2030

Chart on Pulmonary function testing - Market size and forecast 2025-2030 ($ million)
Data Table on Pulmonary function testing - Market size and forecast 2025-2030 ($ million)
Chart on Pulmonary function testing - Year-over-year growth 2025-2030 (%)
Data Table on Pulmonary function testing - Year-over-year growth 2025-2030 (%)

10.5 Sports medicine and athlete performance - Market size and forecast 2025-2030

Chart on Sports medicine and athlete performance - Market size and forecast 2025-2030 ($ million)
Data Table on Sports medicine and athlete performance - Market size and forecast 2025-2030 ($ million)
Chart on Sports medicine and athlete performance - Year-over-year growth 2025-2030 (%)
Data Table on Sports medicine and athlete performance - Year-over-year growth 2025-2030 (%)

10.6 Preoperative risk evaluation - Market size and forecast 2025-2030

Chart on Preoperative risk evaluation - Market size and forecast 2025-2030 ($ million)
Data Table on Preoperative risk evaluation - Market size and forecast 2025-2030 ($ million)
Chart on Preoperative risk evaluation - Year-over-year growth 2025-2030 (%)
Data Table on Preoperative risk evaluation - Year-over-year growth 2025-2030 (%)

10.7 Rehabilitation monitoring - Market size and forecast 2025-2030

Chart on Rehabilitation monitoring - Market size and forecast 2025-2030 ($ million)
Data Table on Rehabilitation monitoring - Market size and forecast 2025-2030 ($ million)
Chart on Rehabilitation monitoring - Year-over-year growth 2025-2030 (%)
Data Table on Rehabilitation monitoring - Year-over-year growth 2025-2030 (%)

10.8 Market opportunity by Application

Market opportunity by Application ($ million)
Data Table on Market opportunity by Application ($ million)

11. Customer Landscape

11.1 Customer landscape overview

Analysis of price sensitivity, lifecycle, customer purchase basket, adoption rates, and purchase criteria

12. Geographic Landscape

12.1 Geographic segmentation

Chart on Market share by geography 2025-2030 (%)
Data Table on Market share by geography 2025-2030 (%)

12.2 Geographic comparison

Chart on Geographic comparison
Data Table on Geographic comparison

12.3 North America - Market size and forecast 2025-2030

Chart on North America - Market size and forecast 2025-2030 ($ million)
Data Table on North America - Market size and forecast 2025-2030 ($ million)
Chart on North America - Year-over-year growth 2025-2030 (%)
Data Table on North America - Year-over-year growth 2025-2030 (%)
Chart on Regional Comparison - North America
Data Table on Regional Comparison - North America

12.3.1 US - Market size and forecast 2025-2030

Chart on US - Market size and forecast 2025-2030 ($ million)
Data Table on US - Market size and forecast 2025-2030 ($ million)
Chart on US - Year-over-year growth 2025-2030 (%)
Data Table on US - Year-over-year growth 2025-2030 (%)

12.3.2 Canada - Market size and forecast 2025-2030

Chart on Canada - Market size and forecast 2025-2030 ($ million)
Data Table on Canada - Market size and forecast 2025-2030 ($ million)
Chart on Canada - Year-over-year growth 2025-2030 (%)
Data Table on Canada - Year-over-year growth 2025-2030 (%)

12.3.3 Mexico - Market size and forecast 2025-2030

Chart on Mexico - Market size and forecast 2025-2030 ($ million)
Data Table on Mexico - Market size and forecast 2025-2030 ($ million)
Chart on Mexico - Year-over-year growth 2025-2030 (%)
Data Table on Mexico - Year-over-year growth 2025-2030 (%)

12.4 Europe - Market size and forecast 2025-2030

Chart on Europe - Market size and forecast 2025-2030 ($ million)
Data Table on Europe - Market size and forecast 2025-2030 ($ million)
Chart on Europe - Year-over-year growth 2025-2030 (%)
Data Table on Europe - Year-over-year growth 2025-2030 (%)
Chart on Regional Comparison - Europe
Data Table on Regional Comparison - Europe

12.4.1 Germany - Market size and forecast 2025-2030

Chart on Germany - Market size and forecast 2025-2030 ($ million)
Data Table on Germany - Market size and forecast 2025-2030 ($ million)
Chart on Germany - Year-over-year growth 2025-2030 (%)
Data Table on Germany - Year-over-year growth 2025-2030 (%)

12.4.2 UK - Market size and forecast 2025-2030

Chart on UK - Market size and forecast 2025-2030 ($ million)
Data Table on UK - Market size and forecast 2025-2030 ($ million)
Chart on UK - Year-over-year growth 2025-2030 (%)
Data Table on UK - Year-over-year growth 2025-2030 (%)

12.4.3 France - Market size and forecast 2025-2030

Chart on France - Market size and forecast 2025-2030 ($ million)
Data Table on France - Market size and forecast 2025-2030 ($ million)
Chart on France - Year-over-year growth 2025-2030 (%)
Data Table on France - Year-over-year growth 2025-2030 (%)

12.4.4 Italy - Market size and forecast 2025-2030

Chart on Italy - Market size and forecast 2025-2030 ($ million)
Data Table on Italy - Market size and forecast 2025-2030 ($ million)
Chart on Italy - Year-over-year growth 2025-2030 (%)
Data Table on Italy - Year-over-year growth 2025-2030 (%)

12.4.5 Spain - Market size and forecast 2025-2030

Chart on Spain - Market size and forecast 2025-2030 ($ million)
Data Table on Spain - Market size and forecast 2025-2030 ($ million)
Chart on Spain - Year-over-year growth 2025-2030 (%)
Data Table on Spain - Year-over-year growth 2025-2030 (%)

12.4.6 The Netherlands - Market size and forecast 2025-2030

Chart on The Netherlands - Market size and forecast 2025-2030 ($ million)
Data Table on The Netherlands - Market size and forecast 2025-2030 ($ million)
Chart on The Netherlands - Year-over-year growth 2025-2030 (%)
Data Table on The Netherlands - Year-over-year growth 2025-2030 (%)

12.5 Asia - Market size and forecast 2025-2030

Chart on Asia - Market size and forecast 2025-2030 ($ million)
Data Table on Asia - Market size and forecast 2025-2030 ($ million)
Chart on Asia - Year-over-year growth 2025-2030 (%)
Data Table on Asia - Year-over-year growth 2025-2030 (%)
Chart on Regional Comparison - Asia
Data Table on Regional Comparison - Asia

12.5.1 China - Market size and forecast 2025-2030

Chart on China - Market size and forecast 2025-2030 ($ million)
Data Table on China - Market size and forecast 2025-2030 ($ million)
Chart on China - Year-over-year growth 2025-2030 (%)
Data Table on China - Year-over-year growth 2025-2030 (%)

12.5.2 Japan - Market size and forecast 2025-2030

Chart on Japan - Market size and forecast 2025-2030 ($ million)
Data Table on Japan - Market size and forecast 2025-2030 ($ million)
Chart on Japan - Year-over-year growth 2025-2030 (%)
Data Table on Japan - Year-over-year growth 2025-2030 (%)

12.5.3 India - Market size and forecast 2025-2030

Chart on India - Market size and forecast 2025-2030 ($ million)
Data Table on India - Market size and forecast 2025-2030 ($ million)
Chart on India - Year-over-year growth 2025-2030 (%)
Data Table on India - Year-over-year growth 2025-2030 (%)

12.5.4 South Korea - Market size and forecast 2025-2030

Chart on South Korea - Market size and forecast 2025-2030 ($ million)
Data Table on South Korea - Market size and forecast 2025-2030 ($ million)
Chart on South Korea - Year-over-year growth 2025-2030 (%)
Data Table on South Korea - Year-over-year growth 2025-2030 (%)

12.5.5 Taiwan - Market size and forecast 2025-2030

Chart on Taiwan - Market size and forecast 2025-2030 ($ million)
Data Table on Taiwan - Market size and forecast 2025-2030 ($ million)
Chart on Taiwan - Year-over-year growth 2025-2030 (%)
Data Table on Taiwan - Year-over-year growth 2025-2030 (%)

12.5.6 Singapore - Market size and forecast 2025-2030

Chart on Singapore - Market size and forecast 2025-2030 ($ million)
Data Table on Singapore - Market size and forecast 2025-2030 ($ million)
Chart on Singapore - Year-over-year growth 2025-2030 (%)
Data Table on Singapore - Year-over-year growth 2025-2030 (%)

12.6 Rest of World (ROW) - Market size and forecast 2025-2030

Chart on Rest of World (ROW) - Market size and forecast 2025-2030 ($ million)
Data Table on Rest of World (ROW) - Market size and forecast 2025-2030 ($ million)
Chart on Rest of World (ROW) - Year-over-year growth 2025-2030 (%)
Data Table on Rest of World (ROW) - Year-over-year growth 2025-2030 (%)
Chart on Regional Comparison - Rest of World (ROW)
Data Table on Regional Comparison - Rest of World (ROW)

12.6.1 Australia - Market size and forecast 2025-2030

Chart on Australia - Market size and forecast 2025-2030 ($ million)
Data Table on Australia - Market size and forecast 2025-2030 ($ million)
Chart on Australia - Year-over-year growth 2025-2030 (%)
Data Table on Australia - Year-over-year growth 2025-2030 (%)

12.6.2 Brazil - Market size and forecast 2025-2030

Chart on Brazil - Market size and forecast 2025-2030 ($ million)
Data Table on Brazil - Market size and forecast 2025-2030 ($ million)
Chart on Brazil - Year-over-year growth 2025-2030 (%)
Data Table on Brazil - Year-over-year growth 2025-2030 (%)

12.6.3 Saudi Arabia - Market size and forecast 2025-2030

Chart on Saudi Arabia - Market size and forecast 2025-2030 ($ million)
Data Table on Saudi Arabia - Market size and forecast 2025-2030 ($ million)
Chart on Saudi Arabia - Year-over-year growth 2025-2030 (%)
Data Table on Saudi Arabia - Year-over-year growth 2025-2030 (%)

12.6.4 South Africa - Market size and forecast 2025-2030

Chart on South Africa - Market size and forecast 2025-2030 ($ million)
Data Table on South Africa - Market size and forecast 2025-2030 ($ million)
Chart on South Africa - Year-over-year growth 2025-2030 (%)
Data Table on South Africa - Year-over-year growth 2025-2030 (%)

12.6.5 Argentina - Market size and forecast 2025-2030

Chart on Argentina - Market size and forecast 2025-2030 ($ million)
Data Table on Argentina - Market size and forecast 2025-2030 ($ million)
Chart on Argentina - Year-over-year growth 2025-2030 (%)
Data Table on Argentina - Year-over-year growth 2025-2030 (%)

12.6.6 Colombia - Market size and forecast 2025-2030

Chart on Colombia - Market size and forecast 2025-2030 ($ million)
Data Table on Colombia - Market size and forecast 2025-2030 ($ million)
Chart on Colombia - Year-over-year growth 2025-2030 (%)
Data Table on Colombia - Year-over-year growth 2025-2030 (%)

12.6.7 UAE - Market size and forecast 2025-2030

Chart on UAE - Market size and forecast 2025-2030 ($ million)
Data Table on UAE - Market size and forecast 2025-2030 ($ million)
Chart on UAE - Year-over-year growth 2025-2030 (%)
Data Table on UAE - Year-over-year growth 2025-2030 (%)

12.6.8 New Zealand - Market size and forecast 2025-2030

Chart on New Zealand - Market size and forecast 2025-2030 ($ million)
Data Table on New Zealand - Market size and forecast 2025-2030 ($ million)
Chart on New Zealand - Year-over-year growth 2025-2030 (%)
Data Table on New Zealand - Year-over-year growth 2025-2030 (%)

12.7 Market opportunity by geography

Market opportunity by geography ($ million)
Data Tables on Market opportunity by geography ($ million)

13. Drivers, Challenges, and Opportunity

13.1 Market drivers

Growing burden of cardiopulmonary diseases and need for objective functional assessment
Technological advancement in diagnostic platforms and analytical capabilities
Expansion of sports science, rehabilitation, and performance monitoring applications

13.2 Market challenges

High acquisition costs and budget limitations
Limited availability of skilled healthcare professionals
Complex regulatory compliance and lengthy approval processes

13.3 Impact of drivers and challenges

Impact of drivers and challenges in 2025 and 2030

13.4 Market opportunities

Growing use of cardiopulmonary stress testing in preventive healthcare
Growing preference for portable and space efficient testing systems
Rising use of cloud based data management environments

14. Competitive Landscape

14.1 Overview

14.2

Overview on criticality of inputs and factors of differentiation

14.3 Landscape disruption

Overview on factors of disruption

14.4 Industry risks

Impact of key risks on business

15. Competitive Analysis

15.1 Companies profiled

Companies covered

15.2 Company ranking index

15.3 Market positioning of companies

Matrix on companies position and classification

15.4 Baxter International Inc.

Baxter International Inc. - Overview
Baxter International Inc. - Business segments
Baxter International Inc. - Key news
Baxter International Inc. - Key offerings
Baxter International Inc. - Segment focus
SWOT

15.5 BTL Group

BTL Group - Overview
BTL Group - Product / Service
BTL Group - Key offerings
SWOT

15.6 Cardioline SpA

Cardioline SpA - Overview
Cardioline SpA - Product / Service
Cardioline SpA - Key offerings
SWOT

15.7 Clarity Medical Pvt. Ltd.

Clarity Medical Pvt. Ltd. - Overview
Clarity Medical Pvt. Ltd. - Product / Service
Clarity Medical Pvt. Ltd. - Key offerings
SWOT

15.8 CORTEX Biophysik GmbH

CORTEX Biophysik GmbH - Overview
CORTEX Biophysik GmbH - Product / Service
CORTEX Biophysik GmbH - Key offerings
SWOT

15.9 EDAN Instruments Inc.

EDAN Instruments Inc. - Overview
EDAN Instruments Inc. - Product / Service
EDAN Instruments Inc. - Key offerings
SWOT

15.10 Fukuda Denshi Co. Ltd.

Fukuda Denshi Co. Ltd. - Overview
Fukuda Denshi Co. Ltd. - Business segments
Fukuda Denshi Co. Ltd. - Key offerings
Fukuda Denshi Co. Ltd. - Segment focus
SWOT

15.11 GE HealthCare Technologies

GE HealthCare Technologies - Overview
GE HealthCare Technologies - Business segments
GE HealthCare Technologies - Key news
GE HealthCare Technologies - Key offerings
GE HealthCare Technologies - Segment focus
SWOT

15.12 Koninklijke Philips NV

Koninklijke Philips NV - Overview
Koninklijke Philips NV - Business segments
Koninklijke Philips NV - Key news
Koninklijke Philips NV - Key offerings
Koninklijke Philips NV - Segment focus
SWOT

15.13 Lode B.V.

Lode B.V. - Overview
Lode B.V. - Product / Service
Lode B.V. - Key offerings
SWOT

15.14 MGC Diagnostics Corp.

MGC Diagnostics Corp. - Overview
MGC Diagnostics Corp. - Product / Service
MGC Diagnostics Corp. - Key offerings
SWOT

15.15 Midmark Corp.

Midmark Corp. - Overview
Midmark Corp. - Product / Service
Midmark Corp. - Key offerings
SWOT

15.16 Nihon Kohden Corp.

Nihon Kohden Corp. - Overview
Nihon Kohden Corp. - Business segments
Nihon Kohden Corp. - Key offerings
Nihon Kohden Corp. - Segment focus
SWOT

15.17 Norav Medical

Norav Medical - Overview
Norav Medical - Product / Service
Norav Medical - Key offerings
SWOT

15.18 SCHILLER AG

SCHILLER AG - Overview
SCHILLER AG - Product / Service
SCHILLER AG - Key offerings
SWOT

16. Appendix

16.1 Scope of the report

Market definition
Objectives
Notes and caveats

16.2 Inclusions and exclusions checklist

Inclusions checklist
Exclusions checklist

16.3 Currency conversion rates for US$

16.4 Research methodology

16.5 Data procurement

Information sources

16.6 Data validation

16.7 Validation techniques employed for market sizing

16.8 Data synthesis

16.9 360 degree market analysis

16.10 List of abbreviations

Research Methodology

Technavio presents a detailed picture of the market by way of study, synthesis, and summation of data from multiple sources. The analysts have presented the various facets of the market with a particular focus on identifying the key industry influencers. The data thus presented is comprehensive, reliable, and the result of extensive research, both primary and secondary.

INFORMATION SOURCES

Primary sources

  • Manufacturers and suppliers
  • Channel partners
  • Industry experts
  • Strategic decision makers

Secondary sources

  • Industry journals and periodicals
  • Government data
  • Financial reports of key industry players
  • Historical data
  • Press releases

DATA ANALYSIS

Data Synthesis

  • Collation of data
  • Estimation of key figures
  • Analysis of derived insights

Data Validation

  • Triangulation with data models
  • Reference against proprietary databases
  • Corroboration with industry experts

REPORT WRITING

Qualitative

  • Market drivers
  • Market challenges
  • Market trends
  • Five forces analysis

Quantitative

  • Market size and forecast
  • Market segmentation
  • Geographical insights
  • Competitive landscape

Interested in this report?

Get your sample now to see our research methodology and insights!

Download Now

Frequently Asked Questions

Cardiopulmonary Stress Testing Systems market growth will increase by USD 2510.7 million during 2026-2030.

The Cardiopulmonary Stress Testing Systems market is expected to grow at a CAGR of 6.9% during 2026-2030.

Cardiopulmonary Stress Testing Systems market is segmented by Product (CPET systems, Stress ECG, SPECT systems, Stress blood pressure monitors, Pulse oximeters) End-user (Hospitals, Ambulatory surgical centers, Diagnostic centers) Application (Cardiac assessment, Pulmonary function testing, Sports medicine and athlete performance, Preoperative risk evaluation, Rehabilitation monitoring)

Baxter International Inc., BTL Group, Cardioline SpA, Clarity Medical Pvt. Ltd., CORTEX Biophysik GmbH, COSMED Srl, custo med GmbH, EDAN Instruments Inc., Fukuda Denshi Co. Ltd., GE HealthCare Technologies, Geratherm Respiratory GmbH, Jaeger Respiratory Diagnostics, Koninklijke Philips NV, Lode B.V., MGC Diagnostics Corp., Midmark Corp., Nasiff Associates Inc., Nihon Kohden Corp., Norav Medical, SCHILLER AG, SunTech Medical Inc. are a few of the key vendors in the Cardiopulmonary Stress Testing Systems market.

North America will register the highest growth rate of 38.3% among the other regions. Therefore, the Cardiopulmonary Stress Testing Systems market in North America is expected to garner significant business opportunities for the vendors during the forecast period.

US, Canada, Mexico, Germany, UK, France, Italy, Spain, The Netherlands, China, Japan, India, South Korea, Taiwan, Singapore, Australia, Brazil, Saudi Arabia, South Africa, Argentina, Colombia, UAE, New Zealand

  • Growing burden of cardiopulmonary diseases and need for objective functional assessment is the driving factor this market.

The Cardiopulmonary Stress Testing Systems market vendors should focus on grabbing business opportunities from the Product segment as it accounted for the largest market share in the base year.
RIA - Research AI Assistant
Ask RIA
