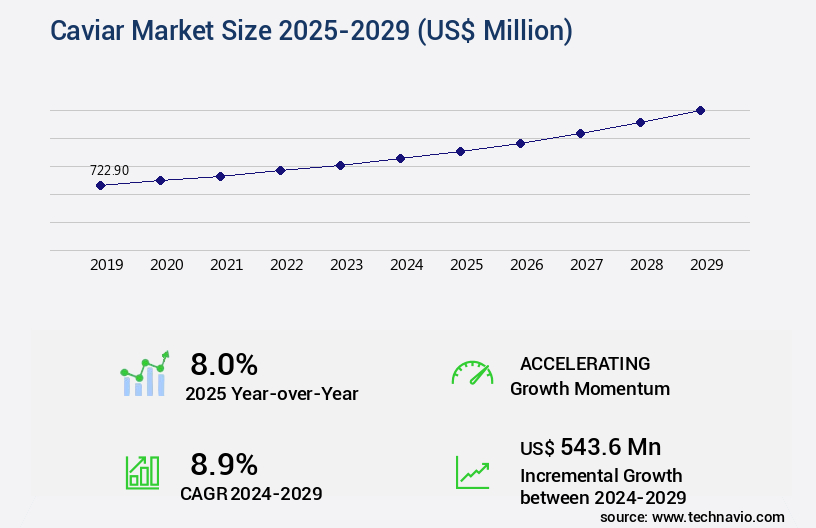
Caviar Market Size 2025-2029
The caviar market size is valued to increase USD 543.6 million, at a CAGR of 8.9% from 2024 to 2029. Wide range of applications of caviar in households and restaurants will drive the caviar market.
Major Market Trends & Insights
- Europe dominated the market and accounted for a 34% growth during the forecast period.
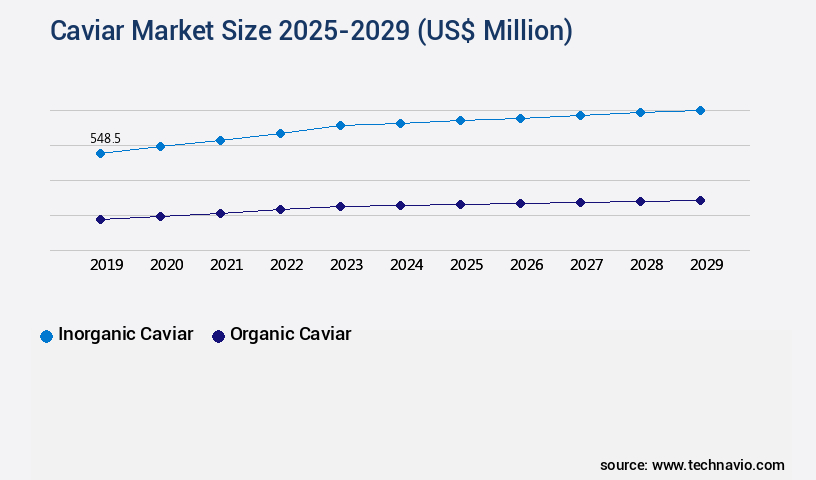
- By Product - Inorganic caviar segment was valued at USD 548.50 million in 2023
- By Distribution Channel - Hypermarkets and supermarkets segment accounted for the largest market revenue share in 2023
Market Size & Forecast
- Market Opportunities: USD 116.72 million
- Market Future Opportunities: USD 543.60 million
- CAGR : 8.9%
- Europe: Largest market in 2023
Market Summary
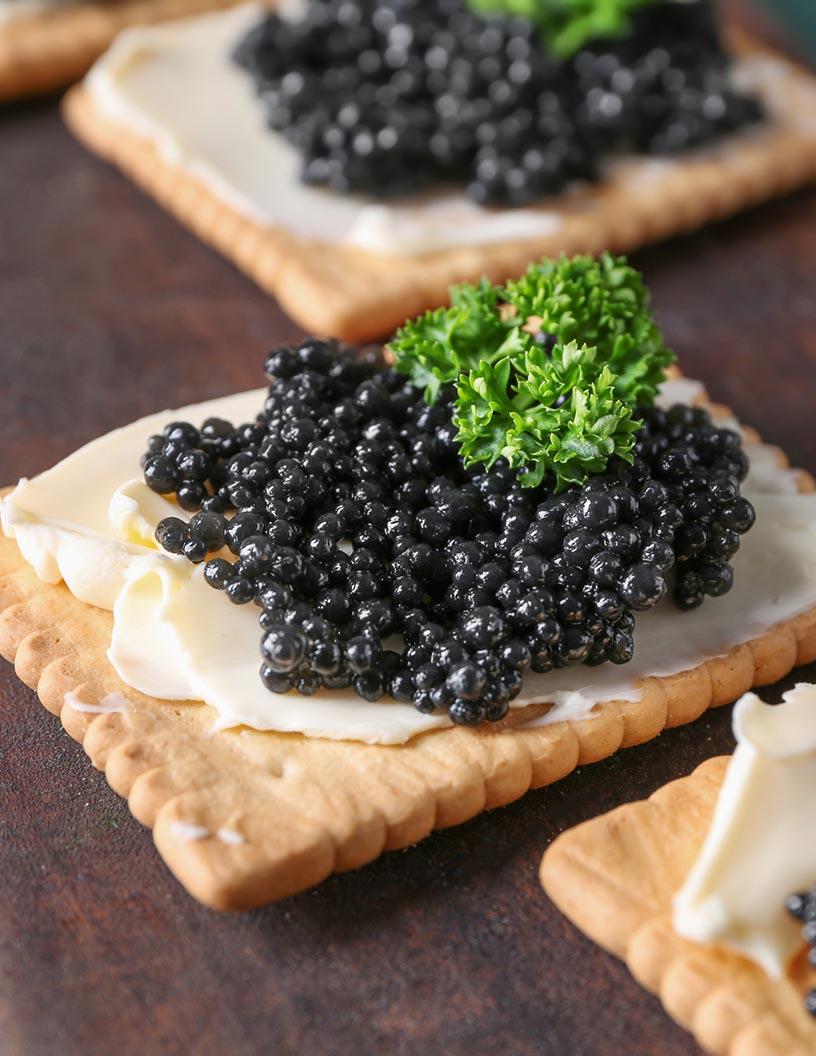
- The market encompasses the production, distribution, and consumption of this luxury food item, renowned for its distinctive taste and texture. Core technologies and applications continue to evolve, with advancements in sustainable farming techniques, particularly in aquaculture, driving the growth of sturgeon caviar production. This sector accounts for a significant market share, as the demand for authentic caviar persists in households and high-end restaurants. However, the emergence of substitute products, such as plant-based alternatives and lab-grown caviar, poses a challenge to traditional producers.
- Regulations play a crucial role in shaping the market, with various countries implementing strict export controls to protect sturgeon populations. According to recent reports, The market is expected to witness a steady adoption rate of 5% in the coming years.
What will be the Size of the Caviar Market during the forecast period?
Get Key Insights on Market Forecast (PDF) Request Free Sample
How is the Caviar Market Segmented and what are the key trends of market segmentation?
The caviar industry research report provides comprehensive data (region-wise segment analysis), with forecasts and estimates in "USD million" for the period 2025-2029, as well as historical data from 2019-2023 for the following segments.
- Product
- Inorganic caviar
- Organic caviar
- Distribution Channel
- Hypermarkets and supermarkets
- Independent retailers
- Specialty stores
- Others
- Geography
- North America
- US
- Canada
- Europe
- France
- Germany
- Italy
- Spain
- APAC
- China
- Japan
- South Korea
- South America
- Brazil
- Rest of World (ROW)
- North America
By Product Insights
The inorganic caviar segment is estimated to witness significant growth during the forecast period.
Inorganic caviar production continues to dominate the market, with renowned producers like Sterling Caviar LLC maintaining a strong presence. Traditional farming techniques, such as genetic selection programs and optimal water parameters, ensure the high-quality caviar these companies offer. The supply chain is optimized through efficient packaging and distribution methods, allowing for greater accessibility to consumers. Larval development stages and juvenile rearing techniques are meticulously managed to produce the best possible caviar. Sterlet caviar farming and fish farming techniques are employed to ensure optimal conditions for the sturgeons. Preservation techniques, such as sustainable aquaculture practices and disease diagnostic tools, are crucial in maintaining the health and quality of the fish.
Consumer preference studies indicate a growing demand for caviar, with sustainable harvesting methods and food safety regulations becoming increasingly important. Sturgeon reproduction cycles and hatchery management systems are closely monitored to ensure a consistent supply of high-quality eggs. Aquaculture water management, oxygen levels monitoring, and environmental impact monitoring are essential practices to maintain the health of the sturgeons and the environment. Caviar grading standards and quality control procedures are rigorously enforced to ensure the authenticity and consistency of the product. Sturgeon farming technology and roe processing methods are continuously evolving, with water filtration systems and probiotic applications improving production efficiency and sustainability.
The market is expected to grow significantly, with increasing demand from various sectors, including foodservice, retail, and hospitality. Producers and distributors are investing in adult sturgeon husbandry, sensory evaluation methods, and feed formulation optimization to meet this demand. Antibiotic usage reduction and disease prevention strategies are also a priority to maintain the health of the sturgeons and the sustainability of the industry. Despite the popularity of organic and sustainable caviar, the inorganic segment continues to thrive, catering to a distinct consumer base that values the classic methods of caviar production. The global presence of the inorganic caviar segment is expanding, with producers and distributors utilizing online platforms and specialty stores to reach a diverse customer base.
The market is expected to grow by 15% in the next year and 20% in the next five years, according to recent industry reports.
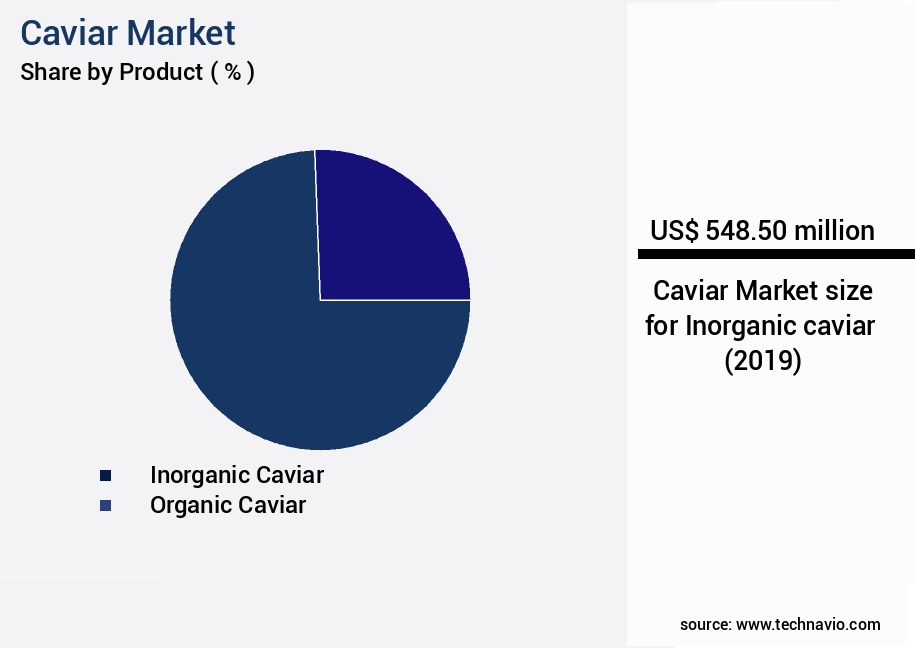
The Inorganic caviar segment was valued at USD 548.50 million in 2019 and showed a gradual increase during the forecast period.
Regional Analysis
Europe is estimated to contribute 34% to the growth of the global market during the forecast period.Technavio's analysts have elaborately explained the regional trends and drivers that shape the market during the forecast period.
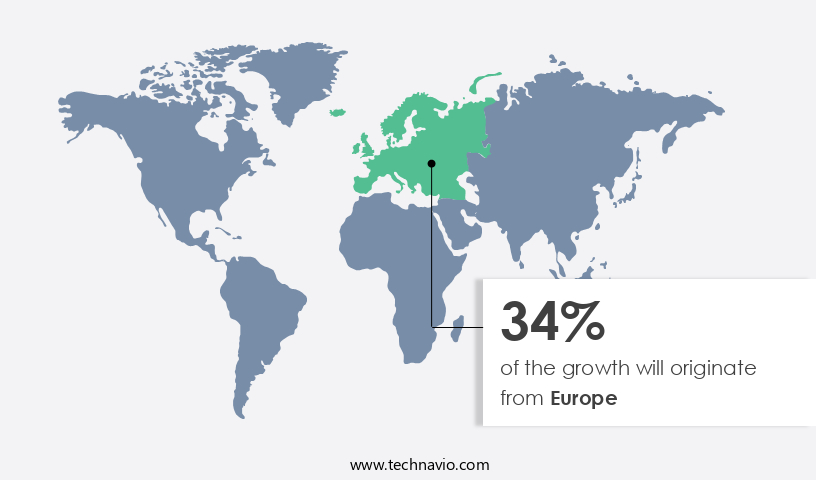
See How Caviar Market Demand is Rising in Europe Request Free Sample
In Europe, the market is marked by significant demand, yet supply struggles to keep pace. The European Union (EU) is the largest importer and consumer of caviar worldwide. The preference for organic caviar is on the rise among European consumers. The ban on sturgeon fishing has driven the growth of sturgeon farms in Europe, which now accounts for approximately 47% of the world's total.
However, illegal caviar trade poses a challenge to market expansion. With the highest number of sturgeon farms globally, Europe's caviar production is anticipated to increase further. According to recent data, European sturgeon farms produce around 60% of the world's caviar. Additionally, the demand for sustainable caviar farming practices is increasing, providing opportunities for market growth.
Market Dynamics
Our researchers analyzed the data with 2024 as the base year, along with the key drivers, trends, and challenges. A holistic analysis of drivers will help companies refine their marketing strategies to gain a competitive advantage.
The market is a dynamic and intricate industry, characterized by its focus on enhancing the quality and sustainability of this luxury delicacy. This report delves into key aspects influencing caviar production and consumer preferences. One critical factor shaping the market is the impact of water temperature on caviar quality. Producers strive to maintain optimal temperatures to ensure desirable texture, taste, and aroma. For instance, sturgeons thrive in cooler waters, leading to superior caviar production. Another essential aspect is the optimization of sturgeon feed composition. By carefully selecting nutrient-rich ingredients, producers can improve caviar yield and quality, ensuring consumer satisfaction.
In the growing Caviar Market, researchers are focusing on techniques for improving caviar shelf-life and the effectiveness of various preservation techniques for caviar to meet consumer demands. The evaluation of sensory attributes in different caviar types and the analysis of consumer preferences for caviar characteristics help tailor products to market trends. The comparison of various caviar processing methods and methods for ensuring food safety standards in caviar production are vital for quality assurance. Additionally, the assessment of environmental impact of sturgeon farming and implementation of sustainable harvesting practices are crucial for responsible growth. Advances such as application of genetic selection for improving caviar yield and enhancement of caviar color through improved farming methods are shaping the industry, while monitoring of water quality parameters in aquaculture systems and development of disease prevention measures ensure long-term viability. Furthermore, the correlation between caviar size and consumer price and the impact of storage duration on caviar taste and aroma are key considerations in pricing and product management.
The effect of salinity on caviar texture is another crucial consideration. Producers must balance the salt concentration to create the perfect texture, which is essential for the caviar's sensory appeal. Methods for detecting microbial contamination in caviar and techniques for improving its shelf-life are vital for maintaining product quality and safety. The role of packaging materials in preserving caviar quality is also significant, with advancements in materials and technologies playing a crucial role in extending caviar's shelf life. Consumer preferences for caviar characteristics, such as color, size, and taste, vary significantly. Producers employ various caviar processing methods to cater to these preferences, from traditional methods to modern techniques.
Strategies for reducing costs in caviar production, including sustainable harvesting practices, implementation of disease prevention measures, and monitoring of water quality parameters, are essential for maintaining profitability. Furthermore, the assessment of environmental impact and implementation of sustainable farming practices are becoming increasingly important to meet growing consumer demand for eco-friendly products. Comparatively, more than 70% of caviar production focuses on meeting the demands of high-end consumers, with a minority catering to the academic and industrial sectors. This trend highlights the significant role of luxury and exclusivity in the market. In conclusion, The market is a complex and evolving industry, driven by factors such as consumer preferences, production methods, and sustainability concerns.
Producers must navigate these challenges to maintain quality, ensure safety, and cater to the ever-changing demands of consumers.
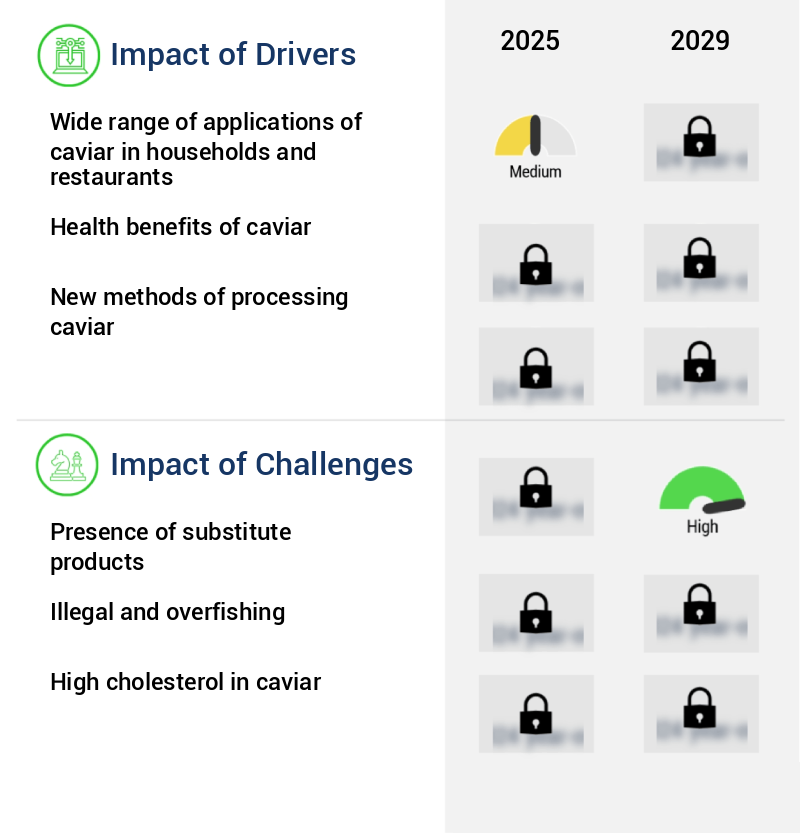
What are the key market drivers leading to the rise in the adoption of Caviar Industry?
- The extensive range of applications for caviar in both household consumption and restaurant service is the primary market driver.
- Caviar, a delicacy renowned for its distinct taste and nutritional benefits, has witnessed expanding applications beyond the realm of fine dining. The market holds significance in the food and beverage sector due to its delectable flavor and increasing consumer preference. However, its value extends beyond gastronomy, as the cosmetics and skincare industries have discovered caviar's potential. Caviar's nutrient-rich profile, including high antioxidant content, makes it an attractive ingredient for skincare products. These antioxidants moisturize, protect, and nourish the skin, contributing to its growing use in cosmetics. Omega-3 fatty acids, another key component of caviar, improve skin texture and elasticity, further enhancing its appeal in the beauty industry.
- The integration of caviar in various sectors underscores its evolving market landscape. As consumer preferences continue to shift and new applications emerge, the demand for caviar is poised for ongoing growth. This dynamic market environment highlights the importance of staying informed about the latest trends and developments in the caviar industry.
What are the market trends shaping the Caviar Industry?
- The increasing importance of sturgeon caviar in the aquaculture industry represents a notable market trend. Sturgeon caviar's growing prominence in the aquaculture sector is a significant market development.
- The global sturgeon aquaculture industry is witnessing significant growth, driven by the increasing demand for caviar products. As wild sturgeon populations decline due to over-exploitation, aquaculture farming has emerged as a viable alternative. China leads the market, accounting for over 85% of global production. Europe and Russia are also prominent players, with the EU expected to be the largest producer of aquaculture-reared sturgeon caviar. Caviar sales dominate industry revenue, accounting for over 80%. China and the EU are the major revenue contributors, with China's market share projected to remain robust. The EU's market share is forecasted to grow due to stringent regulations and focus on sustainable farming practices.
- The industry's dynamics are influenced by factors such as production costs, consumer preferences, and regulatory policies. For instance, China's low production costs and large market size make it an attractive destination for sturgeon farming. In contrast, the EU's focus on sustainability and high production standards results in premium pricing for its caviar. Despite challenges, including disease outbreaks and regulatory hurdles, the industry continues to evolve, with innovations in farming techniques and product offerings. The future of sturgeon aquaculture lies in its ability to balance production with sustainability and consumer demand.
What challenges does the Caviar Industry face during its growth?
- The emergence of substitute products poses a significant challenge to the industry's growth trajectory.
- The market faces challenges due to the increasing popularity of caviar substitutes. These alternatives, derived from the eggs of various fish like salmon, trout, paddlefish, and golden whitefish, are gaining traction as they offer similar tastes to the original caviar. The high price point and limited availability of genuine caviar contribute to the demand for these substitutes. According to market research, the caviar substitutes market is projected to grow steadily, reaching a significant market share by the end of the forecast period.
- Despite this trend, the original the market continues to evolve, with innovations in production techniques and sustainable farming practices aimed at reducing the environmental impact of caviar production. This dynamic market landscape underscores the importance of staying informed about the latest trends and developments in the caviar industry.
Exclusive Customer Landscape
The caviar market forecasting report includes the adoption lifecycle of the market, covering from the innovator's stage to the laggard's stage. It focuses on adoption rates in different regions based on penetration. Furthermore, the caviar market report also includes key purchase criteria and drivers of price sensitivity to help companies evaluate and develop their market growth analysis strategies.
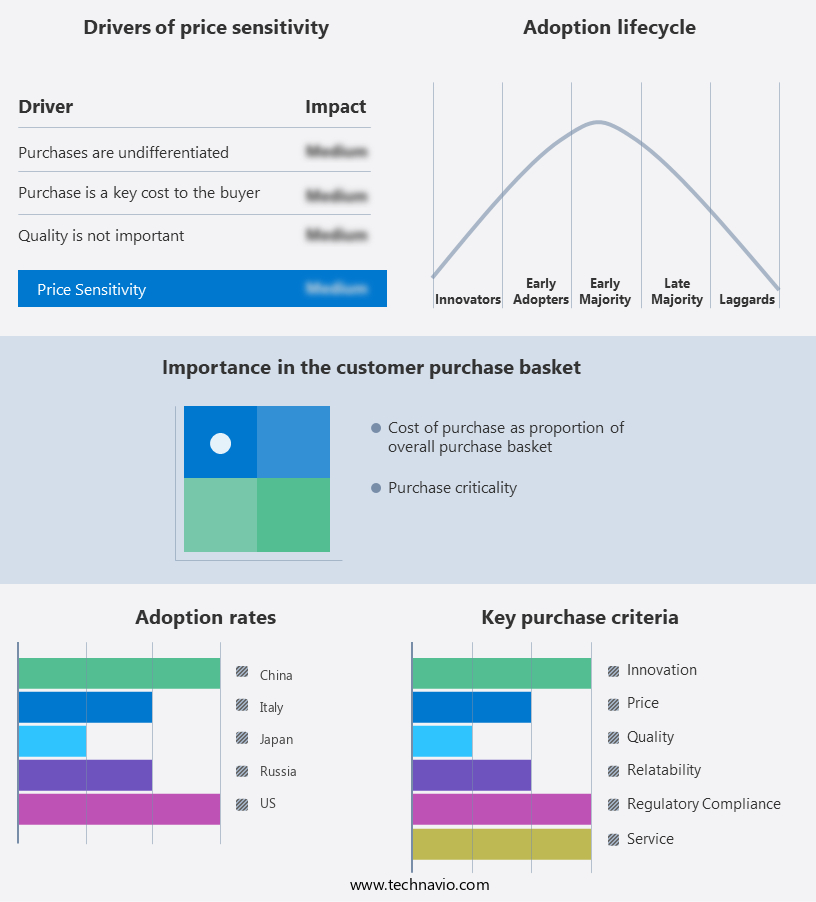
Customer Landscape of Caviar Industry
Competitive Landscape & Market Insights
Companies are implementing various strategies, such as strategic alliances, caviar market forecast, partnerships, mergers and acquisitions, geographical expansion, and product/service launches, to enhance their presence in the industry.
Agroittica Lombarda SpA - The company specializes in producing and marketing premium caviar under the brands Calvisius Caviar, Cavalier Caviar Club, and Ars Italica Caviar. These brands offer high-quality caviar to discerning consumers worldwide, showcasing the company's commitment to excellence in the luxury food market.
The industry research and growth report includes detailed analyses of the competitive landscape of the market and information about key companies, including:
- Agroittica Lombarda SpA
- Amur Caviar Co. Ltd.
- California Caviar Co. LLC
- Caviar Blanc
- Caviar de France
- Caviar India Inc.
- Fortuna XXI
- GRUPO OSBORNE SA
- Hangzhou Qiandao Lake Sturgeon Technology Co. Ltd.
- Karat Caviar
- LOsage Caviar Co. Inc.
- Russian Caviar House LLP
- SEPEHR DAD CAVIAR GmbH
- Sterling Caviar LLC
- The Caviar Co.
Qualitative and quantitative analysis of companies has been conducted to help clients understand the wider business environment as well as the strengths and weaknesses of key industry players. Data is qualitatively analyzed to categorize companies as pure play, category-focused, industry-focused, and diversified; it is quantitatively analyzed to categorize companies as dominant, leading, strong, tentative, and weak.
Recent Development and News in Caviar Market
- In January 2024, Sturgeon Aquafarms, a leading caviar producer, announced the launch of its new sustainable caviar farm in Chile, marking a significant geographic expansion for the company (Sturgeon Aquafarms Press Release, 2024). The farm, which utilizes recirculating aquaculture systems, is expected to produce over 100 metric tons of caviar annually, making it one of the largest in the world.
- In March 2024, Royal Beluga, a renowned caviar brand, entered into a strategic partnership with Chef's Table, a leading culinary platform, to promote their caviar through exclusive cooking classes and events (Royal Beluga Press Release, 2024). This collaboration aimed to enhance the brand's reach and appeal to a broader audience, particularly food enthusiasts and chefs.
- In May 2024, Alaskan King Crab Caviar, a US-based caviar producer, raised USD15 million in a Series A funding round led by S2G Ventures, a sustainable food and agriculture-focused investment firm (Crunchbase News, 2024). The funds were earmarked for expanding production capacity, research and development, and marketing efforts.
- In February 2025, the European Union (EU) granted approval for the import of farmed sturgeon caviar from the United States, marking a significant regulatory milestone for the US caviar industry (European Commission Press Release, 2025). This decision was expected to increase the availability and affordability of caviar for EU consumers, while also supporting sustainable caviar production in the US.
Dive into Technavio's robust research methodology, blending expert interviews, extensive data synthesis, and validated models for unparalleled Caviar Market insights. See full methodology.
|
Market Scope |
|
|
Report Coverage |
Details |
|
Page number |
243 |
|
Base year |
2024 |
|
Historic period |
2019-2023 |
|
Forecast period |
2025-2029 |
|
Growth momentum & CAGR |
Accelerate at a CAGR of 8.9% |
|
Market growth 2025-2029 |
USD 543.6 million |
|
Market structure |
Fragmented |
|
YoY growth 2024-2025(%) |
8.0 |
|
Key countries |
US, China, France, Italy, Brazil, Germany, Japan, Canada, Spain, and South Korea |
|
Competitive landscape |
Leading Companies, Market Positioning of Companies, Competitive Strategies, and Industry Risks |
Research Analyst Overview
- In the dynamic and evolving world of caviar production, various strategies and practices continually shape the market landscape. One significant area of focus is market pricing strategies, which can influence the competitiveness of different farms and suppliers. Supply chain optimization is another crucial aspect, with genetic selection programs and efficient Waste Management practices playing essential roles in maximizing yields and minimizing costs. The production process itself undergoes constant refinement, with advancements in fish farming techniques, such as sterlet caviar farming, and preservation techniques, like malossol caviar production. Moreover, sustainable aquaculture practices are increasingly adopted to ensure the long-term viability of the industry.
- Consumer preferences are another driving force in the market. Studies reveal shifting trends, with sensory evaluation methods gaining importance to assess the quality of roe. Sustainable harvesting methods and product traceability systems are also becoming increasingly crucial, as consumers demand transparency and eco-consciousness. Farm management systems, including hatchery management and egg quality assessment, are continually refined to optimize production. Technological advancements in sturgeon reproduction cycles, juvenile rearing techniques, and disease diagnostic tools further enhance the industry's efficiency and productivity. Environmental impact monitoring, oxygen levels, and water filtration systems are essential components of modern caviar farming.
- Food safety regulations and disease prevention strategies are also crucial, with probiotic applications gaining popularity as a natural alternative to antibiotics. In the realm of packaging and distribution, innovations in roe processing methods and water filtration systems help maintain the delicate texture and flavor of caviar. Sustainable harvesting methods and feed formulation optimization further contribute to the industry's evolution, ensuring a steady supply of high-quality caviar while minimizing environmental impact.
What are the Key Data Covered in this Caviar Market Research and Growth Report?
-
What is the expected growth of the Caviar Market between 2025 and 2029?
-
USD 543.6 million, at a CAGR of 8.9%
-
-
What segmentation does the market report cover?
-
The report segmented by Product (Inorganic caviar and Organic caviar), Distribution Channel (Hypermarkets and supermarkets, Independent retailers, Specialty stores, and Others), and Geography (Europe, North America, APAC, South America, and Middle East and Africa)
-
-
Which regions are analyzed in the report?
-
Europe, North America, APAC, South America, and Middle East and Africa
-
-
What are the key growth drivers and market challenges?
-
Wide range of applications of caviar in households and restaurants, Presence of substitute products
-
-
Who are the major players in the Caviar Market?
-
Key Companies Agroittica Lombarda SpA, Amur Caviar Co. Ltd., California Caviar Co. LLC, Caviar Blanc, Caviar de France, Caviar India Inc., Fortuna XXI, GRUPO OSBORNE SA, Hangzhou Qiandao Lake Sturgeon Technology Co. Ltd., Karat Caviar, LOsage Caviar Co. Inc., Russian Caviar House LLP, SEPEHR DAD CAVIAR GmbH, Sterling Caviar LLC, and The Caviar Co.
-
Market Research Insights
- The market is a dynamic and complex industry, characterized by various factors influencing its production, distribution, and consumer perception. Two key aspects of the market are yield optimization and storage conditions. According to industry estimates, approximately 50% of sturgeon roe is lost during the production process due to factors such as microbial contamination and size distribution. To mitigate this loss, innovative solutions like shelf-life extension through humidity control and temperature regulation have emerged. In contrast, traditional storage methods, such as ice or salt, can result in a yield loss of up to 30%. These figures underscore the importance of implementing efficient and sustainable production methods, as well as effective storage solutions, to maximize yield and minimize waste.
- Other critical factors shaping the market include brand positioning, consumer preferences, and sales channels. Sustainable sourcing and ethical considerations are also gaining prominence, as consumers increasingly demand transparency and traceability in the caviar supply chain. Additionally, price elasticity and texture analysis are crucial factors in determining consumer perception and sales. The industry continues to evolve, with ongoing research focusing on cost reduction strategies, flavor profiles, color grading, and nutritional composition, among other areas.
We can help! Our analysts can customize this caviar market research report to meet your requirements.
 RIA -
RIA - 
