Waste Management Market Analysis, Size, and Forecast 2026-2030: APAC (China, Japan, and India), North America (US, Canada, and Mexico), Europe (Germany, UK, and France), Middle East and Africa (Saudi Arabia, UAE, and South Africa), South America (Brazil, Argentina, and Chile), and Rest of World (ROW)

Waste Management Market Analysis, Size, and Forecast 2026-2030:
APAC (China, Japan, and India), North America (US, Canada, and Mexico), Europe (Germany, UK, and France), Middle East and Africa (Saudi Arabia, UAE, and South Africa), South America (Brazil, Argentina, and Chile), and Rest of World (ROW)

Published: Oct 2026 315 Pages SKU: IRTNTR73620

Market Overview at a Glance

$167.08 B
Market Opportunity
6%
CAGR 2025 - 2030
30.5%
APAC Growth
$194.89 B
Residential segment 2024

Waste Management Market Size 2026-2030

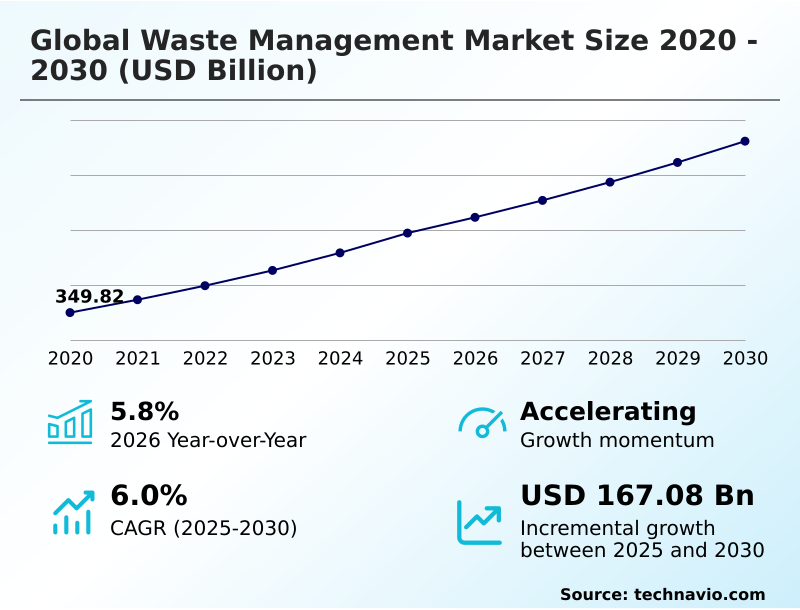
The waste management market size is valued to increase by USD 167.08 billion, at a CAGR of 6% from 2025 to 2030. Growing regulatory focus on environmental sustainability and resource recovery will drive the waste management market.

Major Market Trends & Insights

  • APAC dominated the market and accounted for a 30.5% growth during the forecast period.
  • By End-user - Residential segment was valued at USD 194.89 billion in 2024
  • By Service Type - Landfill segment accounted for the largest market revenue share in 2024

Market Size & Forecast

  • Market Opportunities: USD 311.68 billion
  • Market Future Opportunities: USD 167.08 billion
  • CAGR from 2025 to 2030 : 6%

Market Summary

  • The Waste Management Market is undergoing a rapid structural transformation driven by the critical need to transition from linear disposal models to highly integrated resource recovery frameworks. As urban centers expand, municipal and commercial operators face mounting pressure to optimize collection logistics and diversion rates.
  • For instance, implementing predictive maintenance systems and route optimization software in municipal collection fleets has allowed service providers to lower operational downtime by 25% compared to legacy scheduling models. This technological enhancement directly mitigates fleet management costs while improving service reliability.
  • An intensifying regulatory focus on sustainability and emissions control acts as a major market driver, compelling facilities to integrate anaerobic digestion technology to avoid steep non-compliance penalties. Conversely, the market faces significant headwinds due to limited infrastructure and processing capacity.
  • When incoming waste volumes exceed sorting capabilities, material recovery facilities suffer from elevated contamination rates and operational bottlenecks, ultimately diminishing the economic viability of recovered secondary raw materials. Consequently, organizations must strategically balance compliance requirements with capital-intensive infrastructure upgrades to maintain long-term profitability.

What will be the Size of the Waste Management Market during the forecast period?
Get Key Insights on Market Forecast (PDF) Get Free Sample

How is the Waste Management Market Segmented?

The waste management industry research report provides comprehensive data (region-wise segment analysis), with forecasts and estimates in "USD million" for the period 2026-2030, as well as historical data from 2020-2024 for the following segments.

  • End-user
    • Residential
    • Commercial
    • Industrial
  • Service type
    • Landfill
    • Open dumping
    • Incineration
    • Recycling
    • Composting and anaerobic digestion
  • Type
    • Municipal waste
    • Industrial waste
    • Hazardous waste
    • E-waste
    • Others
  • Geography
    • APAC
      • China
      • Japan
      • India
      • South Korea
      • Australia
      • Indonesia
    • North America
      • US
      • Canada
      • Mexico
    • Europe
      • Germany
      • UK
      • France
      • Italy
      • Spain
      • The Netherlands
    • Middle East and Africa
      • Saudi Arabia
      • UAE
      • South Africa
      • Israel
      • Turkey
    • South America
      • Brazil
      • Argentina
      • Chile

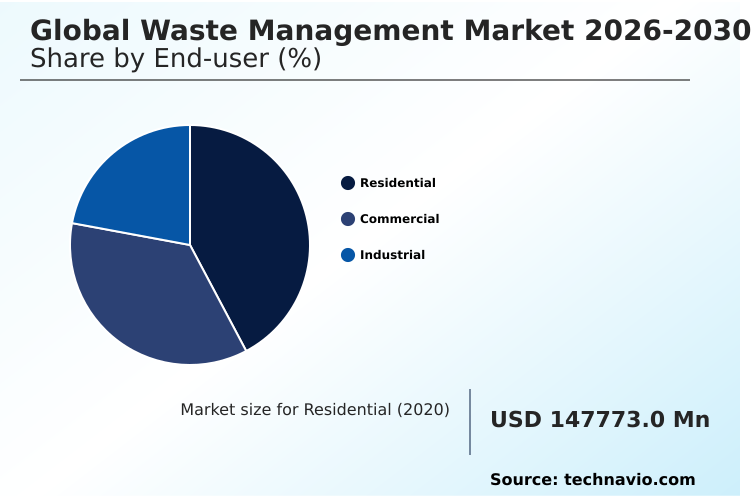
By End-user Insights

The residential segment is estimated to witness significant growth during the forecast period.

The residential sub-segment within Waste Management handles vast volumes of household discards, demanding high operational precision from service operators. As urban density increases, organizations deploy advanced compliance monitoring tools to ensure strict adherence to local environmental regulations.

This modernization efficiently manages diverse municipal solid waste streams while reducing logistical friction. Furthermore, integrating automated sorting systems alongside advanced robotic waste separation at local processing centers has elevated household material recovery rates by 22% compared to traditional manual methods.

These efficiency gains directly alleviate cost pressures for service providers, allowing for optimal capital allocation toward sustainable practices.

By enhancing source segregation capabilities and expanding curbside diversion programs, including the introduction of localized anaerobic digestion technology for organics, the sector structurally diminishes long-term disposal dependency and landfill reliance.
Get Free Sample

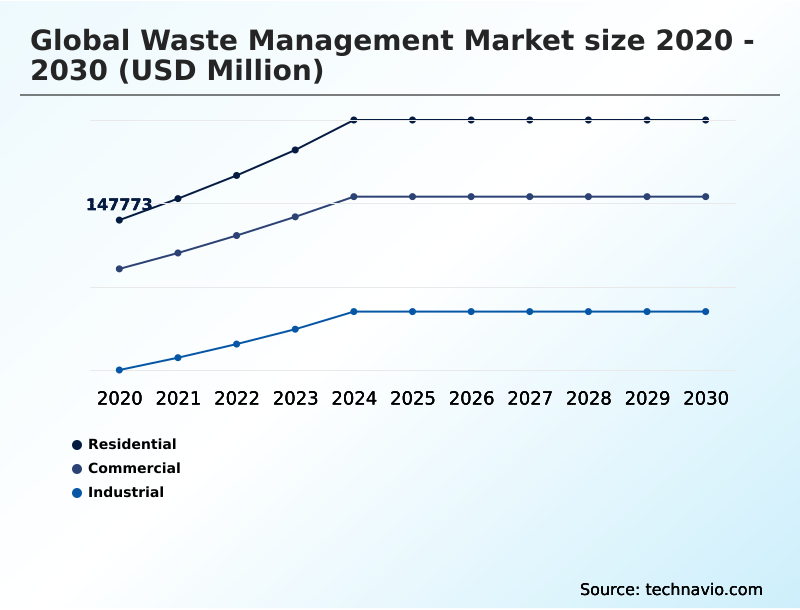
The Residential segment was valued at USD 194.89 billion in 2024 and showed a gradual increase during the forecast period.
Get Free Sample

Regional Analysis

APAC is estimated to contribute 30.5% to the growth of the global market during the forecast period.Technavio’s analysts have elaborately explained the regional trends and drivers that shape the market during the forecast period.
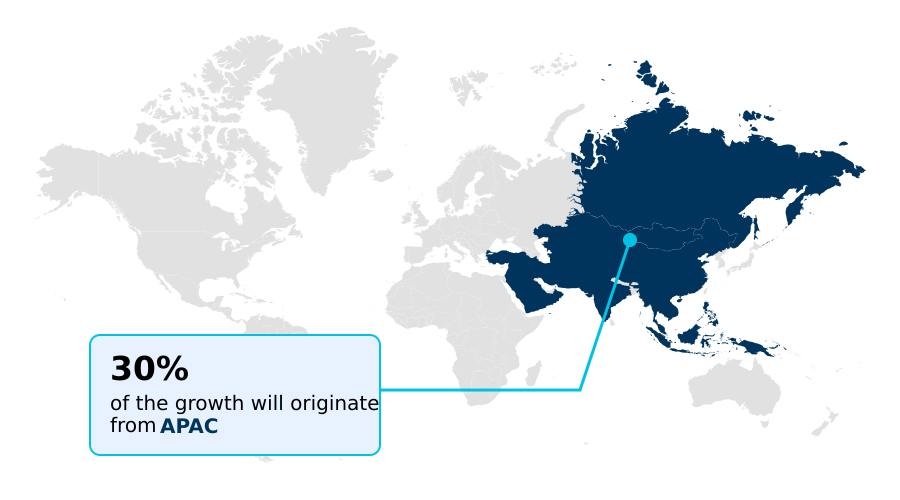
See How Waste Management Market Demand is Rising in APAC Get Free Sample

The geographic landscape of Waste Management highlights distinct structural disparities between North America and APAC. North America operates within a mature regulatory framework, prioritizing advanced landfill gas recovery and strict greenhouse gas mitigation protocols.

This extensive infrastructure has enabled regional facilities to achieve a 35% higher resource utilization efficiency than developing counterparts. Conversely, APAC is experiencing rapid industrialization, forcing an accelerated shift toward modern infrastructure to manage surging volumes.

Consequently, APAC exhibits a 22% faster adoption rate of automated fleet dispatch solutions as municipalities aggressively optimize urban sanitation improvement.

While North American operators heavily utilize sophisticated thermal destruction process capabilities for complex residues, APAC stakeholders are actively investing in greenfield material recovery capacities to bypass traditional open dumping practices.

These divergent trajectories require multinational providers to tailor their capital expenditure strategies, balancing high-tech compliance in mature economies with scalable processing in emerging regions.

Market Dynamics

Our researchers analyzed the data with 2025 as the base year, along with the key drivers, trends, and challenges. A holistic analysis of drivers will help companies refine their marketing strategies to gain a competitive advantage.

  • As environmental regulations intensify and corporate sustainability goals mature, the Waste Management sector is rapidly advancing its operational capabilities to maximize material diversion and asset utilization. Supply chain planners and municipal coordinators are fundamentally redesigning traditional workflows to incorporate highly technical processing methodologies.
  • By integrating smart sensor based waste collection into urban grids, municipalities have achieved a 30% greater logistical efficiency compared to rigid routing systems, drastically lowering transportation overhead. Once materials reach processing centers, automated material recovery facility operations utilize optical sorters and robotics to systematically reduce human error, yielding exceptionally pure secondary commodities.
  • Concurrently, the management of specialized discard streams requires sophisticated treatment infrastructure. For example, industrial hazardous waste thermal treatment provides essential compliance and liability reduction for chemical producers by ensuring complete destruction of toxic compounds.
  • In the consumer technology domain, electronic waste critical mineral extraction has become a strategic imperative, mitigating supply chain risks by recovering high-value metals for reuse in advanced manufacturing. Furthermore, addressing massive biodegradable refuse volumes, organizations are scaling municipal organic waste anaerobic digestion to simultaneously produce renewable energy and nutrient-rich soil amendments.
  • By aligning these advanced recovery paradigms, service providers fulfill strict environmental mandates while driving long-term profitability.
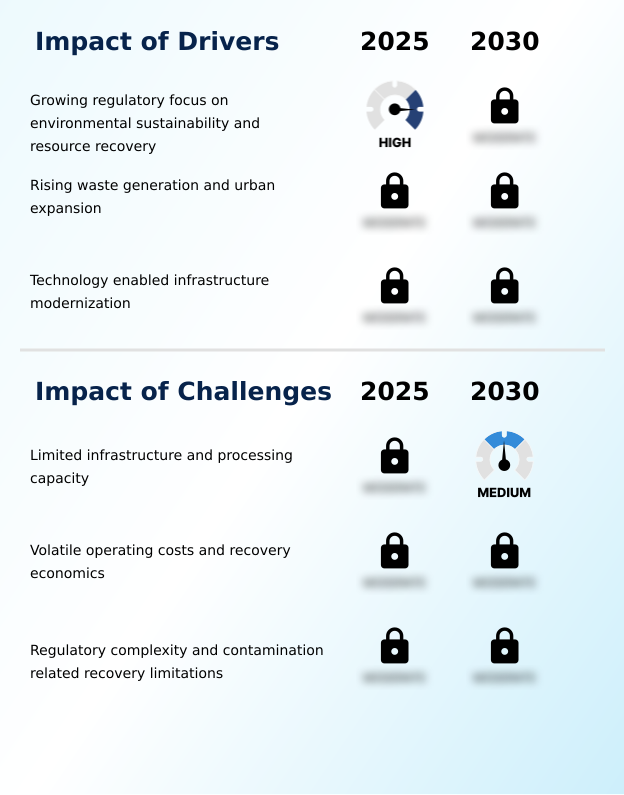
What are the key market drivers leading to the rise in the adoption of Waste Management Industry?

  • An intensifying regulatory focus on environmental sustainability and resource recovery serves as the primary catalyst propelling structural growth and infrastructure modernization across the industry.

  • Stricter regulatory mandates surrounding environmental protection and resource conservation serve as the primary catalyst propelling modern Waste Management operations. Governments worldwide are enforcing rigorous landfill diversion strategies to aggressively combat urban pollution and resource depletion.
  • This sweeping regulatory intervention forces industrial and commercial enterprises to adopt robust circular economy models. As a direct result, organizations integrating advanced material recovery frameworks have lowered long-term waste disposal costs by 22% compared to conventional landfill reliance.
  • This modernization ensures that mandatory extended producer responsibility becomes an integral part of corporate product governance.
  • By prioritizing strict emissions control compliance and adhering to complex regulatory reporting standards, businesses actively mitigate severe legal liabilities while establishing resilient, eco-friendly operational workflows that meet contemporary sustainability requirements.

What are the market trends shaping the Waste Management Industry?

  • A pronounced shift toward decentralized waste processing networks is fundamentally reshaping operational frameworks across the industry. This structural evolution prioritizes localized resource recovery, significantly reducing logistical dependencies on centralized disposal facilities.

  • A defining trend within the Waste Management industry is the accelerated transition toward decentralized treatment infrastructure, fundamentally altering how commercial and municipal entities handle diverse refuse streams. Organizations are increasingly adopting localized organic waste composting to process materials closer to the point of generation.
  • This strategic shift is primarily driven by the urgent need to mitigate soaring transportation costs and minimize fleet-related emissions. Consequently, facilities that have integrated localized processing models report a 25% improvement in logistical efficiency compared to traditional centralized disposal methods.
  • By deploying advanced sensor based identification networks at these decentralized hubs, operators can ensure high material purity and seamless supply chain circularity. This localized approach not only fortifies environmental performance tracking but also empowers municipalities to rapidly scale their resource recovery operations in response to shifting demographic demands.

What challenges does the Waste Management Industry face during its growth?

  • Limited physical infrastructure and restricted processing capacities remain critical constraints that impede material recovery efficiency and complicate operational scalability.

  • Despite continuous technological advancements, severe infrastructure capacity constraints remain a formidable challenge impeding the optimization of Waste Management workflows. Rapid urbanization consistently generates refuse volumes that outpace the processing capabilities of existing material recovery facilities. This chronic undercapacity directly causes elevated contamination rates and severe operational bottlenecks.
  • Because legacy sorting networks struggle to handle complex packaging without robust contamination reduction practices, facilities experience a 30% reduction in the purity of secondary raw materials compared to fully modernized plants. Furthermore, navigating complex protocols for hazardous waste containment forces operators to incur heavy administrative and operational expenditure management burdens.
  • Consequently, the inability to rapidly scale advanced sorting and treatment capabilities significantly restricts overall profitability and hampers the widespread realization of profitable recycling networks.

Exclusive Technavio Analysis on Customer Landscape

The waste management market forecasting report includes the adoption lifecycle of the market, covering from the innovator’s stage to the laggard’s stage. It focuses on adoption rates in different regions based on penetration. Furthermore, the waste management market report also includes key purchase criteria and drivers of price sensitivity to help companies evaluate and develop their market growth analysis strategies.
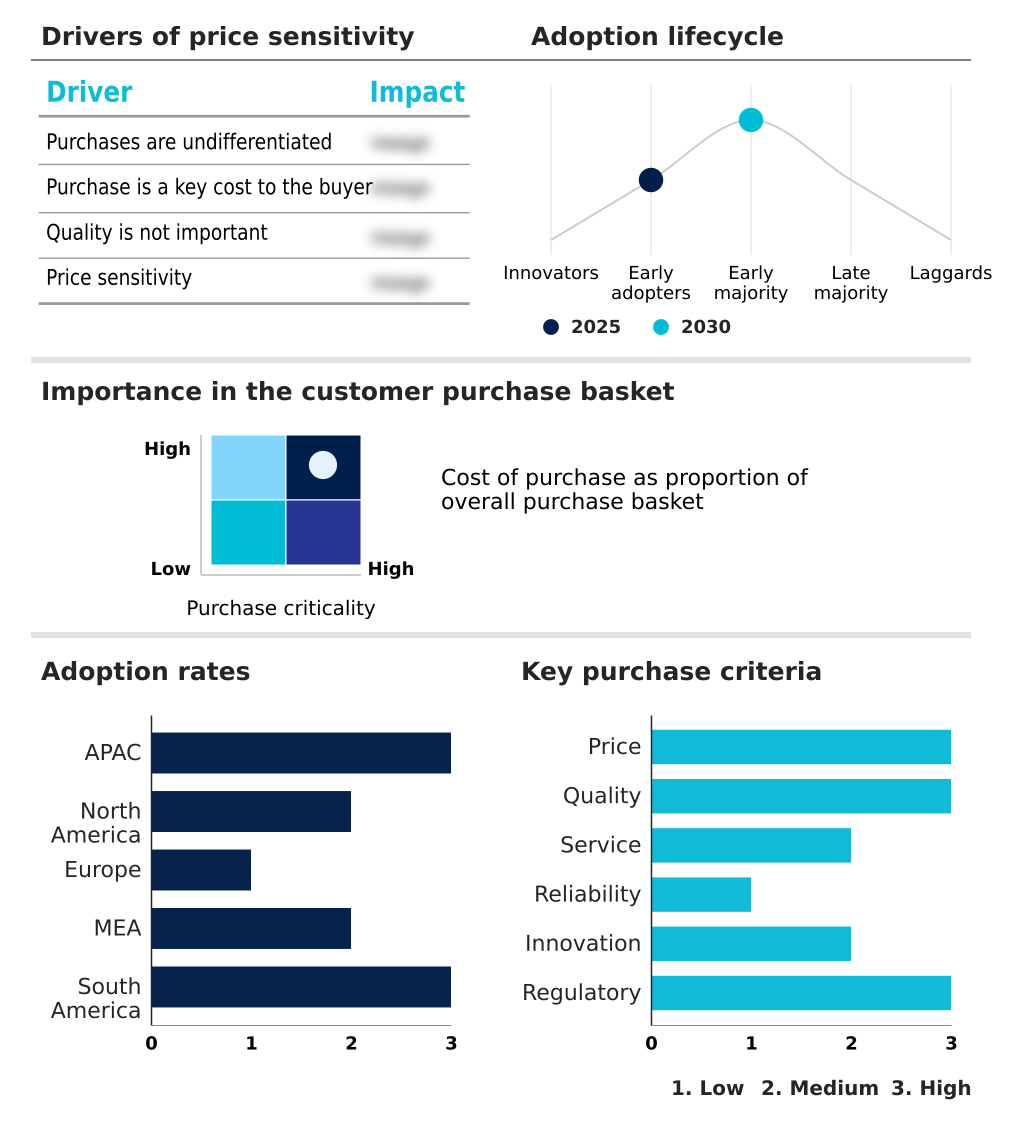
Customer Landscape of Waste Management Industry

Competitive Landscape

Companies are implementing various strategies, such as strategic alliances, waste management market forecast, partnerships, mergers and acquisitions, geographical expansion, and product/service launches, to enhance their presence in the industry.

Befesa SA - The entity provides comprehensive Waste Management offerings specializing in the recovery of complex industrial byproducts and critical hazardous materials to support circular supply chains and rigorous regulatory compliance.

The industry research and growth report includes detailed analyses of the competitive landscape of the market and information about key companies, including:

  • Befesa SA
  • Casella Waste Systems Inc.
  • Clean Harbors Inc.
  • Covanta Holding Corp.
  • Enviri Corp.
  • GFL Environmental Inc.
  • Keppel Ltd.
  • Paprec Group
  • PreZero International GmbH
  • Recology Inc.
  • Remondis SE and Co. KG
  • Renewi Plc
  • Republic Services Inc.
  • Sacyr SA
  • Sims Ltd.
  • Stericycle Inc.
  • SUEZ SA
  • Tomra Systems ASA
  • URBASER SA
  • Veolia Environment SA
  • Waste Connections Inc.
  • Waste Management Inc.

Qualitative and quantitative analysis of companies has been conducted to help clients understand the wider business environment as well as the strengths and weaknesses of key industry players. Data is qualitatively analyzed to categorize companies as pure play, category-focused, industry-focused, and diversified; it is quantitatively analyzed to categorize companies as dominant, leading, strong, tentative, and weak.

Recent Development and News in Waste management market

  • In the Environmental and Facilities Services industry, the widespread adoption of AI-enabled route optimization algorithms has minimized logistics overhead, directly impacting Waste Management demand by accelerating the deployment of smart collection bins and reducing fleet fuel consumption by up to 18%.
  • In the Environmental and Facilities Services industry, stringent European Union landfill diversion mandates have forced municipalities to re-evaluate disposal practices, directly impacting Waste Management supply chains by driving a 25% increase in the construction of advanced material recovery facilities.
  • In the Environmental and Facilities Services industry, the integration of specialized biogas purification units into public infrastructure projects has enhanced resource utilization efficiency, directly impacting the Waste Management market by increasing organic waste composting throughput and yielding a 20% boost in renewable natural gas output.
  • In the Environmental and Facilities Services industry, the enforcement of rigorous extended producer responsibility frameworks for electronics has reshaped compliance standards, directly impacting Waste Management operations by necessitating a 30% expansion in dedicated electronic waste dismantling and critical mineral recovery capacities.

Dive into Technavio’s robust research methodology, blending expert interviews, extensive data synthesis, and validated models for unparalleled Waste Management Market insights. See full methodology.

Market Scope
Page number 315
Base year 2025
Historic period 2020-2024
Forecast period 2026-2030
Growth momentum & CAGR Accelerate at a CAGR of 6%
Market growth 2026-2030 USD 167076.4 million
Market structure Fragmented
YoY growth 2025-2026(%) 5.8%
Key countries China, Japan, India, South Korea, Australia, Indonesia, US, Canada, Mexico, Germany, UK, France, Italy, Spain, The Netherlands, Saudi Arabia, UAE, South Africa, Israel, Turkey, Brazil, Argentina and Chile
Competitive landscape Leading Companies, Market Positioning of Companies, Competitive Strategies, and Industry Risks

Request Free Sample

Research Analyst Overview

  • The Waste Management sector is experiencing a profound operational overhaul as regulatory frameworks dictate stricter material recovery and disposal protocols. Organizations are systematically integrating robotic waste separation into legacy material recovery facilities, an initiative that has yielded a 30% reduction in manual sorting times and vastly improved output purity.
  • This automation trend directly influences boardroom-level budgeting decisions, as the initial capital outlay is rapidly offset by minimized labor dependencies and enhanced commodity revenues. Industrial byproduct valorization has transitioned from a niche environmental initiative into a core product strategy, allowing manufacturers to monetize previously discarded residues.
  • Furthermore, the mandatory implementation of extended producer responsibility mandates requires corporations to meticulously track product lifecycles and ensure compliant end-of-life processing. To meet these stringent obligations, service providers are deploying closed loop recycling models alongside advanced flue gas treatment systems to guarantee absolute regulatory alignment.
  • Ultimately, deploying sustainable materials management strategies allows enterprises to structurally lower their carbon footprints while fortifying operational resilience.

What are the Key Data Covered in this Waste Management Market Research and Growth Report?

  • What is the expected growth of the Waste Management Market between 2026 and 2030?

    • USD 167.08 billion, at a CAGR of 6%

  • What segmentation does the market report cover?

    • The report is segmented by End-user (Residential, Commercial, and Industrial), Service Type (Landfill, Open dumping, Incineration, Recycling, and Composting and anaerobic digestion), Type (Municipal waste, Industrial waste, Hazardous waste, E-waste, and Others) and Geography (APAC, North America, Europe, Middle East and Africa, South America)

  • Which regions are analyzed in the report?

    • APAC, North America, Europe, Middle East and Africa and South America

  • What are the key growth drivers and market challenges?

    • Growing regulatory focus on environmental sustainability and resource recovery, Limited infrastructure and processing capacity

  • Who are the major players in the Waste Management Market?

    • Befesa SA, Casella Waste Systems Inc., Clean Harbors Inc., Covanta Holding Corp., Enviri Corp., GFL Environmental Inc., Keppel Ltd., Paprec Group, PreZero International GmbH, Recology Inc., Remondis SE and Co. KG, Renewi Plc, Republic Services Inc., Sacyr SA, Sims Ltd., Stericycle Inc., SUEZ SA, Tomra Systems ASA, URBASER SA, Veolia Environment SA, Waste Connections Inc. and Waste Management Inc.

Market Research Insights

  • The Waste Management industry is undergoing a systemic transition toward optimized resource recovery and strict environmental compliance. Organizations are rapidly adopting contamination reduction practices, which have demonstrated a 28% improvement in the purity of secondary raw materials, significantly bolstering downstream manufacturing margins.
  • Simultaneously, the strategic deployment of advanced tracking tools across processing equipment has reduced facility downtime by 15%, ensuring steady operational expenditure management. By integrating rigorous regulatory reporting standards directly into daily workflows, operators successfully mitigate legal liabilities while improving overall facility throughput.
  • This modernization ensures that supply chain circularity becomes a measurable, profitable reality rather than merely a conceptual sustainability target, structurally altering how industrial and commercial waste streams are monetized.

We can help! Our analysts can customize this waste management market research report to meet your requirements.

Get in touch

1. Executive Summary

1.1 Market overview

Executive Summary - Chart on Market Overview
Executive Summary - Data Table on Market Overview
Executive Summary - Chart on Global Market Characteristics
Executive Summary - Chart on Market by Geography
Executive Summary - Chart on Market Segmentation by End-user
Executive Summary - Chart on Market Segmentation by Service Type
Executive Summary - Chart on Market Segmentation by Type
Executive Summary - Chart on Incremental Growth
Executive Summary - Data Table on Incremental Growth
Executive Summary - Chart on Company Market Positioning

2. Technavio Analysis

2.1 Analysis of price sensitivity, lifecycle, customer purchase basket, adoption rates, and purchase criteria

2.2 Criticality of inputs and Factors of differentiation

Chart on Overview on criticality of inputs and factors of differentiation

2.3 Factors of disruption

Chart on Overview on factors of disruption

2.4 Impact of drivers and challenges

Chart on Impact of drivers and challenges in 2025 and 2030

3. Market Landscape

3.1 Market ecosystem

Chart on Parent Market
Data Table on - Parent Market

3.2 Market characteristics

Chart on Market characteristics analysis

3.3 Value chain analysis

Chart on Value chain analysis

4. Market Sizing

4.1 Market definition

Data Table on Offerings of companies included in the market definition

4.2 Market segment analysis

Market segments

4.3 Market size 2025

4.4 Market outlook: Forecast for 2025-2030

Chart on Global - Market size and forecast 2025-2030 ($ million)
Data Table on Global - Market size and forecast 2025-2030 ($ million)
Chart on Global Market: Year-over-year growth 2025-2030 (%)
Data Table on Global Market: Year-over-year growth 2025-2030 (%)

5. Historic Market Size

5.1 Global Waste Management Market 2020 - 2024

Historic Market Size - Data Table on Global Waste Management Market 2020 - 2024 ($ million)

5.2 End-user segment analysis 2020 - 2024

Historic Market Size - End-user Segment 2020 - 2024 ($ million)

5.3 Service Type segment analysis 2020 - 2024

Historic Market Size - Service Type Segment 2020 - 2024 ($ million)

5.4 Type segment analysis 2020 - 2024

Historic Market Size - Type Segment 2020 - 2024 ($ million)

5.5 Geography segment analysis 2020 - 2024

Historic Market Size - Geography Segment 2020 - 2024 ($ million)

5.6 Country segment analysis 2020 - 2024

Historic Market Size - Country Segment 2020 - 2024 ($ million)

6. Qualitative Analysis

6.1 Impact of AI on global waste management market

6.2 Impact of geopolitical conflicts on global waste management market

7. Five Forces Analysis

7.1 Five forces summary

Five forces analysis - Comparison between 2025 and 2030

7.2 Bargaining power of buyers

Bargaining power of buyers - Impact of key factors 2025 and 2030

7.3 Bargaining power of suppliers

Bargaining power of suppliers - Impact of key factors in 2025 and 2030

7.4 Threat of new entrants

Threat of new entrants - Impact of key factors in 2025 and 2030

7.5 Threat of substitutes

Threat of substitutes - Impact of key factors in 2025 and 2030

7.6 Threat of rivalry

Threat of rivalry - Impact of key factors in 2025 and 2030

7.7 Market condition

Chart on Market condition - Five forces 2025 and 2030

8. Market Segmentation by End-user

8.1 Market segments

Chart on End-user - Market share 2025-2030 (%)
Data Table on End-user - Market share 2025-2030 (%)

8.2 Comparison by End-user

Chart on Comparison by End-user
Data Table on Comparison by End-user

8.3 Residential - Market size and forecast 2025-2030

Chart on Residential - Market size and forecast 2025-2030 ($ million)
Data Table on Residential - Market size and forecast 2025-2030 ($ million)
Chart on Residential - Year-over-year growth 2025-2030 (%)
Data Table on Residential - Year-over-year growth 2025-2030 (%)

8.4 Commercial - Market size and forecast 2025-2030

Chart on Commercial - Market size and forecast 2025-2030 ($ million)
Data Table on Commercial - Market size and forecast 2025-2030 ($ million)
Chart on Commercial - Year-over-year growth 2025-2030 (%)
Data Table on Commercial - Year-over-year growth 2025-2030 (%)

8.5 Industrial - Market size and forecast 2025-2030

Chart on Industrial - Market size and forecast 2025-2030 ($ million)
Data Table on Industrial - Market size and forecast 2025-2030 ($ million)
Chart on Industrial - Year-over-year growth 2025-2030 (%)
Data Table on Industrial - Year-over-year growth 2025-2030 (%)

8.6 Market opportunity by End-user

Market opportunity by End-user ($ million)
Data Table on Market opportunity by End-user ($ million)

9. Market Segmentation by Service Type

9.1 Market segments

Chart on Service Type - Market share 2025-2030 (%)
Data Table on Service Type - Market share 2025-2030 (%)

9.2 Comparison by Service Type

Chart on Comparison by Service Type
Data Table on Comparison by Service Type

9.3 Landfill - Market size and forecast 2025-2030

Chart on Landfill - Market size and forecast 2025-2030 ($ million)
Data Table on Landfill - Market size and forecast 2025-2030 ($ million)
Chart on Landfill - Year-over-year growth 2025-2030 (%)
Data Table on Landfill - Year-over-year growth 2025-2030 (%)

9.4 Open dumping - Market size and forecast 2025-2030

Chart on Open dumping - Market size and forecast 2025-2030 ($ million)
Data Table on Open dumping - Market size and forecast 2025-2030 ($ million)
Chart on Open dumping - Year-over-year growth 2025-2030 (%)
Data Table on Open dumping - Year-over-year growth 2025-2030 (%)

9.5 Incineration - Market size and forecast 2025-2030

Chart on Incineration - Market size and forecast 2025-2030 ($ million)
Data Table on Incineration - Market size and forecast 2025-2030 ($ million)
Chart on Incineration - Year-over-year growth 2025-2030 (%)
Data Table on Incineration - Year-over-year growth 2025-2030 (%)

9.6 Recycling - Market size and forecast 2025-2030

Chart on Recycling - Market size and forecast 2025-2030 ($ million)
Data Table on Recycling - Market size and forecast 2025-2030 ($ million)
Chart on Recycling - Year-over-year growth 2025-2030 (%)
Data Table on Recycling - Year-over-year growth 2025-2030 (%)

9.7 Composting and anaerobic digestion - Market size and forecast 2025-2030

Chart on Composting and anaerobic digestion - Market size and forecast 2025-2030 ($ million)
Data Table on Composting and anaerobic digestion - Market size and forecast 2025-2030 ($ million)
Chart on Composting and anaerobic digestion - Year-over-year growth 2025-2030 (%)
Data Table on Composting and anaerobic digestion - Year-over-year growth 2025-2030 (%)

9.8 Market opportunity by Service Type

Market opportunity by Service Type ($ million)
Data Table on Market opportunity by Service Type ($ million)

10. Market Segmentation by Type

10.1 Market segments

Chart on Type - Market share 2025-2030 (%)
Data Table on Type - Market share 2025-2030 (%)

10.2 Comparison by Type

Chart on Comparison by Type
Data Table on Comparison by Type

10.3 Municipal waste - Market size and forecast 2025-2030

Chart on Municipal waste - Market size and forecast 2025-2030 ($ million)
Data Table on Municipal waste - Market size and forecast 2025-2030 ($ million)
Chart on Municipal waste - Year-over-year growth 2025-2030 (%)
Data Table on Municipal waste - Year-over-year growth 2025-2030 (%)

10.4 Industrial waste - Market size and forecast 2025-2030

Chart on Industrial waste - Market size and forecast 2025-2030 ($ million)
Data Table on Industrial waste - Market size and forecast 2025-2030 ($ million)
Chart on Industrial waste - Year-over-year growth 2025-2030 (%)
Data Table on Industrial waste - Year-over-year growth 2025-2030 (%)

10.5 Hazardous waste - Market size and forecast 2025-2030

Chart on Hazardous waste - Market size and forecast 2025-2030 ($ million)
Data Table on Hazardous waste - Market size and forecast 2025-2030 ($ million)
Chart on Hazardous waste - Year-over-year growth 2025-2030 (%)
Data Table on Hazardous waste - Year-over-year growth 2025-2030 (%)

10.6 E-waste - Market size and forecast 2025-2030

Chart on E-waste - Market size and forecast 2025-2030 ($ million)
Data Table on E-waste - Market size and forecast 2025-2030 ($ million)
Chart on E-waste - Year-over-year growth 2025-2030 (%)
Data Table on E-waste - Year-over-year growth 2025-2030 (%)

10.7 Others - Market size and forecast 2025-2030

Chart on Others - Market size and forecast 2025-2030 ($ million)
Data Table on Others - Market size and forecast 2025-2030 ($ million)
Chart on Others - Year-over-year growth 2025-2030 (%)
Data Table on Others - Year-over-year growth 2025-2030 (%)

10.8 Market opportunity by Type

Market opportunity by Type ($ million)
Data Table on Market opportunity by Type ($ million)

11. Customer Landscape

11.1 Customer landscape overview

Analysis of price sensitivity, lifecycle, customer purchase basket, adoption rates, and purchase criteria

12. Geographic Landscape

12.1 Geographic segmentation

Chart on Market share by geography 2025-2030 (%)
Data Table on Market share by geography 2025-2030 (%)

12.2 Geographic comparison

Chart on Geographic comparison
Data Table on Geographic comparison

12.3 APAC - Market size and forecast 2025-2030

Chart on APAC - Market size and forecast 2025-2030 ($ million)
Data Table on APAC - Market size and forecast 2025-2030 ($ million)
Chart on APAC - Year-over-year growth 2025-2030 (%)
Data Table on APAC - Year-over-year growth 2025-2030 (%)
Chart on Regional Comparison - APAC
Data Table on Regional Comparison - APAC

12.3.1 China - Market size and forecast 2025-2030

Chart on China - Market size and forecast 2025-2030 ($ million)
Data Table on China - Market size and forecast 2025-2030 ($ million)
Chart on China - Year-over-year growth 2025-2030 (%)
Data Table on China - Year-over-year growth 2025-2030 (%)

12.3.2 Japan - Market size and forecast 2025-2030

Chart on Japan - Market size and forecast 2025-2030 ($ million)
Data Table on Japan - Market size and forecast 2025-2030 ($ million)
Chart on Japan - Year-over-year growth 2025-2030 (%)
Data Table on Japan - Year-over-year growth 2025-2030 (%)

12.3.3 India - Market size and forecast 2025-2030

Chart on India - Market size and forecast 2025-2030 ($ million)
Data Table on India - Market size and forecast 2025-2030 ($ million)
Chart on India - Year-over-year growth 2025-2030 (%)
Data Table on India - Year-over-year growth 2025-2030 (%)

12.3.4 South Korea - Market size and forecast 2025-2030

Chart on South Korea - Market size and forecast 2025-2030 ($ million)
Data Table on South Korea - Market size and forecast 2025-2030 ($ million)
Chart on South Korea - Year-over-year growth 2025-2030 (%)
Data Table on South Korea - Year-over-year growth 2025-2030 (%)

12.3.5 Australia - Market size and forecast 2025-2030

Chart on Australia - Market size and forecast 2025-2030 ($ million)
Data Table on Australia - Market size and forecast 2025-2030 ($ million)
Chart on Australia - Year-over-year growth 2025-2030 (%)
Data Table on Australia - Year-over-year growth 2025-2030 (%)

12.3.6 Indonesia - Market size and forecast 2025-2030

Chart on Indonesia - Market size and forecast 2025-2030 ($ million)
Data Table on Indonesia - Market size and forecast 2025-2030 ($ million)
Chart on Indonesia - Year-over-year growth 2025-2030 (%)
Data Table on Indonesia - Year-over-year growth 2025-2030 (%)

12.4 North America - Market size and forecast 2025-2030

Chart on North America - Market size and forecast 2025-2030 ($ million)
Data Table on North America - Market size and forecast 2025-2030 ($ million)
Chart on North America - Year-over-year growth 2025-2030 (%)
Data Table on North America - Year-over-year growth 2025-2030 (%)
Chart on Regional Comparison - North America
Data Table on Regional Comparison - North America

12.4.1 US - Market size and forecast 2025-2030

Chart on US - Market size and forecast 2025-2030 ($ million)
Data Table on US - Market size and forecast 2025-2030 ($ million)
Chart on US - Year-over-year growth 2025-2030 (%)
Data Table on US - Year-over-year growth 2025-2030 (%)

12.4.2 Canada - Market size and forecast 2025-2030

Chart on Canada - Market size and forecast 2025-2030 ($ million)
Data Table on Canada - Market size and forecast 2025-2030 ($ million)
Chart on Canada - Year-over-year growth 2025-2030 (%)
Data Table on Canada - Year-over-year growth 2025-2030 (%)

12.4.3 Mexico - Market size and forecast 2025-2030

Chart on Mexico - Market size and forecast 2025-2030 ($ million)
Data Table on Mexico - Market size and forecast 2025-2030 ($ million)
Chart on Mexico - Year-over-year growth 2025-2030 (%)
Data Table on Mexico - Year-over-year growth 2025-2030 (%)

12.5 Europe - Market size and forecast 2025-2030

Chart on Europe - Market size and forecast 2025-2030 ($ million)
Data Table on Europe - Market size and forecast 2025-2030 ($ million)
Chart on Europe - Year-over-year growth 2025-2030 (%)
Data Table on Europe - Year-over-year growth 2025-2030 (%)
Chart on Regional Comparison - Europe
Data Table on Regional Comparison - Europe

12.5.1 Germany - Market size and forecast 2025-2030

Chart on Germany - Market size and forecast 2025-2030 ($ million)
Data Table on Germany - Market size and forecast 2025-2030 ($ million)
Chart on Germany - Year-over-year growth 2025-2030 (%)
Data Table on Germany - Year-over-year growth 2025-2030 (%)

12.5.2 UK - Market size and forecast 2025-2030

Chart on UK - Market size and forecast 2025-2030 ($ million)
Data Table on UK - Market size and forecast 2025-2030 ($ million)
Chart on UK - Year-over-year growth 2025-2030 (%)
Data Table on UK - Year-over-year growth 2025-2030 (%)

12.5.3 France - Market size and forecast 2025-2030

Chart on France - Market size and forecast 2025-2030 ($ million)
Data Table on France - Market size and forecast 2025-2030 ($ million)
Chart on France - Year-over-year growth 2025-2030 (%)
Data Table on France - Year-over-year growth 2025-2030 (%)

12.5.4 Italy - Market size and forecast 2025-2030

Chart on Italy - Market size and forecast 2025-2030 ($ million)
Data Table on Italy - Market size and forecast 2025-2030 ($ million)
Chart on Italy - Year-over-year growth 2025-2030 (%)
Data Table on Italy - Year-over-year growth 2025-2030 (%)

12.5.5 Spain - Market size and forecast 2025-2030

Chart on Spain - Market size and forecast 2025-2030 ($ million)
Data Table on Spain - Market size and forecast 2025-2030 ($ million)
Chart on Spain - Year-over-year growth 2025-2030 (%)
Data Table on Spain - Year-over-year growth 2025-2030 (%)

12.5.6 The Netherlands - Market size and forecast 2025-2030

Chart on The Netherlands - Market size and forecast 2025-2030 ($ million)
Data Table on The Netherlands - Market size and forecast 2025-2030 ($ million)
Chart on The Netherlands - Year-over-year growth 2025-2030 (%)
Data Table on The Netherlands - Year-over-year growth 2025-2030 (%)

12.6 Middle East and Africa - Market size and forecast 2025-2030

Chart on Middle East and Africa - Market size and forecast 2025-2030 ($ million)
Data Table on Middle East and Africa - Market size and forecast 2025-2030 ($ million)
Chart on Middle East and Africa - Year-over-year growth 2025-2030 (%)
Data Table on Middle East and Africa - Year-over-year growth 2025-2030 (%)
Chart on Regional Comparison - Middle East and Africa
Data Table on Regional Comparison - Middle East and Africa

12.6.1 Saudi Arabia - Market size and forecast 2025-2030

Chart on Saudi Arabia - Market size and forecast 2025-2030 ($ million)
Data Table on Saudi Arabia - Market size and forecast 2025-2030 ($ million)
Chart on Saudi Arabia - Year-over-year growth 2025-2030 (%)
Data Table on Saudi Arabia - Year-over-year growth 2025-2030 (%)

12.6.2 UAE - Market size and forecast 2025-2030

Chart on UAE - Market size and forecast 2025-2030 ($ million)
Data Table on UAE - Market size and forecast 2025-2030 ($ million)
Chart on UAE - Year-over-year growth 2025-2030 (%)
Data Table on UAE - Year-over-year growth 2025-2030 (%)

12.6.3 South Africa - Market size and forecast 2025-2030

Chart on South Africa - Market size and forecast 2025-2030 ($ million)
Data Table on South Africa - Market size and forecast 2025-2030 ($ million)
Chart on South Africa - Year-over-year growth 2025-2030 (%)
Data Table on South Africa - Year-over-year growth 2025-2030 (%)

12.6.4 Israel - Market size and forecast 2025-2030

Chart on Israel - Market size and forecast 2025-2030 ($ million)
Data Table on Israel - Market size and forecast 2025-2030 ($ million)
Chart on Israel - Year-over-year growth 2025-2030 (%)
Data Table on Israel - Year-over-year growth 2025-2030 (%)

12.6.5 Turkey - Market size and forecast 2025-2030

Chart on Turkey - Market size and forecast 2025-2030 ($ million)
Data Table on Turkey - Market size and forecast 2025-2030 ($ million)
Chart on Turkey - Year-over-year growth 2025-2030 (%)
Data Table on Turkey - Year-over-year growth 2025-2030 (%)

12.7 South America - Market size and forecast 2025-2030

Chart on South America - Market size and forecast 2025-2030 ($ million)
Data Table on South America - Market size and forecast 2025-2030 ($ million)
Chart on South America - Year-over-year growth 2025-2030 (%)
Data Table on South America - Year-over-year growth 2025-2030 (%)
Chart on Regional Comparison - South America
Data Table on Regional Comparison - South America

12.7.1 Brazil - Market size and forecast 2025-2030

Chart on Brazil - Market size and forecast 2025-2030 ($ million)
Data Table on Brazil - Market size and forecast 2025-2030 ($ million)
Chart on Brazil - Year-over-year growth 2025-2030 (%)
Data Table on Brazil - Year-over-year growth 2025-2030 (%)

12.7.2 Argentina - Market size and forecast 2025-2030

Chart on Argentina - Market size and forecast 2025-2030 ($ million)
Data Table on Argentina - Market size and forecast 2025-2030 ($ million)
Chart on Argentina - Year-over-year growth 2025-2030 (%)
Data Table on Argentina - Year-over-year growth 2025-2030 (%)

12.7.3 Chile - Market size and forecast 2025-2030

Chart on Chile - Market size and forecast 2025-2030 ($ million)
Data Table on Chile - Market size and forecast 2025-2030 ($ million)
Chart on Chile - Year-over-year growth 2025-2030 (%)
Data Table on Chile - Year-over-year growth 2025-2030 (%)

12.8 Market opportunity by geography

Market opportunity by geography ($ million)
Data Tables on Market opportunity by geography ($ million)

13. Drivers, Challenges, and Opportunity

13.1 Market drivers

Growing regulatory focus on environmental sustainability and resource recovery
Rising waste generation and urban expansion
Technology enabled infrastructure modernization

13.2 Market challenges

Limited infrastructure and processing capacity
Volatile operating costs and recovery economics
Regulatory complexity and contamination related recovery limitations

13.3 Impact of drivers and challenges

Impact of drivers and challenges in 2025 and 2030

13.4 Market opportunities

Shift toward decentralized waste processing networks
Expansion of specialized waste stream management services
Increasing government initiative associated with waste management transformation programs

14. Competitive Landscape

14.1 Overview

14.2

Overview on criticality of inputs and factors of differentiation

14.3 Landscape disruption

Overview on factors of disruption

14.4 Industry risks

Impact of key risks on business

15. Competitive Analysis

15.1 Companies profiled

Companies covered

15.2 Company ranking index

15.3 Market positioning of companies

Matrix on companies position and classification

15.4 Befesa SA

Befesa SA - Overview
Befesa SA - Business segments
Befesa SA - Key offerings
Befesa SA - Segment focus
SWOT

15.5 Casella Waste Systems Inc.

Casella Waste Systems Inc. - Overview
Casella Waste Systems Inc. - Business segments
Casella Waste Systems Inc. - Key offerings
Casella Waste Systems Inc. - Segment focus
SWOT

15.6 Clean Harbors Inc.

Clean Harbors Inc. - Overview
Clean Harbors Inc. - Business segments
Clean Harbors Inc. - Key news
Clean Harbors Inc. - Key offerings
Clean Harbors Inc. - Segment focus
SWOT

15.7 Covanta Holding Corp.

Covanta Holding Corp. - Overview
Covanta Holding Corp. - Product / Service
Covanta Holding Corp. - Key offerings
SWOT

15.8 Enviri Corp.

Enviri Corp. - Overview
Enviri Corp. - Business segments
Enviri Corp. - Key offerings
Enviri Corp. - Segment focus
SWOT

15.9 GFL Environmental Inc.

GFL Environmental Inc. - Overview
GFL Environmental Inc. - Business segments
GFL Environmental Inc. - Key offerings
GFL Environmental Inc. - Segment focus
SWOT

15.10 Keppel Ltd.

Keppel Ltd. - Overview
Keppel Ltd. - Business segments
Keppel Ltd. - Key offerings
Keppel Ltd. - Segment focus
SWOT

15.11 Remondis SE and Co. KG

Remondis SE and Co. KG - Overview
Remondis SE and Co. KG - Product / Service
Remondis SE and Co. KG - Key offerings
SWOT

15.12 Republic Services Inc.

Republic Services Inc. - Overview
Republic Services Inc. - Business segments
Republic Services Inc. - Key news
Republic Services Inc. - Key offerings
Republic Services Inc. - Segment focus
SWOT

15.13 Sacyr SA

Sacyr SA - Overview
Sacyr SA - Business segments
Sacyr SA - Key offerings
Sacyr SA - Segment focus
SWOT

15.14 Tomra Systems ASA

Tomra Systems ASA - Overview
Tomra Systems ASA - Business segments
Tomra Systems ASA - Key offerings
Tomra Systems ASA - Segment focus
SWOT

15.15 URBASER SA

URBASER SA - Overview
URBASER SA - Product / Service
URBASER SA - Key offerings
SWOT

15.16 Veolia Environment SA

Veolia Environment SA - Overview
Veolia Environment SA - Business segments
Veolia Environment SA - Key news
Veolia Environment SA - Key offerings
Veolia Environment SA - Segment focus
SWOT

15.17 Waste Connections Inc.

Waste Connections Inc. - Overview
Waste Connections Inc. - Business segments
Waste Connections Inc. - Key offerings
Waste Connections Inc. - Segment focus
SWOT

15.18 Waste Management Inc.

Waste Management Inc. - Overview
Waste Management Inc. - Business segments
Waste Management Inc. - Key news
Waste Management Inc. - Key offerings
Waste Management Inc. - Segment focus
SWOT

16. Appendix

16.1 Scope of the report

Market definition
Objectives
Notes and caveats

16.2 Inclusions and exclusions checklist

Inclusions checklist
Exclusions checklist

16.3 Currency conversion rates for US$

16.4 Research methodology

16.5 Data procurement

Information sources

16.6 Data validation

16.7 Validation techniques employed for market sizing

16.8 Data synthesis

16.9 360 degree market analysis

16.10 List of abbreviations

Research Methodology

Technavio presents a detailed picture of the market by way of study, synthesis, and summation of data from multiple sources. The analysts have presented the various facets of the market with a particular focus on identifying the key industry influencers. The data thus presented is comprehensive, reliable, and the result of extensive research, both primary and secondary.

INFORMATION SOURCES

Primary sources

  • Manufacturers and suppliers
  • Channel partners
  • Industry experts
  • Strategic decision makers

Secondary sources

  • Industry journals and periodicals
  • Government data
  • Financial reports of key industry players
  • Historical data
  • Press releases

DATA ANALYSIS

Data Synthesis

  • Collation of data
  • Estimation of key figures
  • Analysis of derived insights

Data Validation

  • Triangulation with data models
  • Reference against proprietary databases
  • Corroboration with industry experts

REPORT WRITING

Qualitative

  • Market drivers
  • Market challenges
  • Market trends
  • Five forces analysis

Quantitative

  • Market size and forecast
  • Market segmentation
  • Geographical insights
  • Competitive landscape

Interested in this report?

Get your sample now to see our research methodology and insights!

Download Now

Frequently Asked Questions

Waste Management market growth will increase by USD 167076.4 million during 2026-2030.

The Waste Management market is expected to grow at a CAGR of 6% during 2026-2030.

Waste Management market is segmented by End-user (Residential, Commercial, Industrial) Service type (Landfill, Open dumping, Incineration, Recycling, Composting and anaerobic digestion) Type (Municipal waste, Industrial waste, Hazardous waste, E-waste, Others)

Befesa SA, Casella Waste Systems Inc., Clean Harbors Inc., Covanta Holding Corp., Enviri Corp., GFL Environmental Inc., Keppel Ltd., Paprec Group, PreZero International GmbH, Recology Inc., Remondis SE and Co. KG, Renewi Plc, Republic Services Inc., Sacyr SA, Sims Ltd., Stericycle Inc., SUEZ SA, Tomra Systems ASA, URBASER SA, Veolia Environment SA, Waste Connections Inc., Waste Management Inc. are a few of the key vendors in the Waste Management market.

APAC will register the highest growth rate of 30.5% among the other regions. Therefore, the Waste Management market in APAC is expected to garner significant business opportunities for the vendors during the forecast period.

China, Japan, India, South Korea, Australia, Indonesia, US, Canada, Mexico, Germany, UK, France, Italy, Spain, The Netherlands, Saudi Arabia, UAE, South Africa, Israel, Turkey, Brazil, Argentina, Chile

  • Growing regulatory focus on environmental sustainability and resource recovery is the driving factor this market.

The Waste Management market vendors should focus on grabbing business opportunities from the End-user segment as it accounted for the largest market share in the base year.
RIA - Research AI Assistant
Ask RIA
