
Cellular Health Screening Market Analysis, Size, and Forecast 2026-2030: North America (US, Canada, and Mexico), Europe (Germany, UK, and France), Asia (China, Japan, and India), South America (Brazil, Argentina, and Colombia), Middle East and Africa (Saudi Arabia, UAE, and South Africa), Rest of World (ROW)

Cellular Health Screening Market Analysis, Size, and Forecast 2026-2030:
North America (US, Canada, and Mexico), Europe (Germany, UK, and France), Asia (China, Japan, and India), South America (Brazil, Argentina, and Colombia), Middle East and Africa (Saudi Arabia, UAE, and South Africa), Rest of World (ROW)

Published: Oct 2026 297 Pages SKU: IRTNTR72430

Market Overview at a Glance

$4.40 B
Market Opportunity
17.3%
CAGR 2025 - 2030
41.8%
North America Growth
$1.95 B
Office segment 2024

Cellular Health Screening Market Size 2026-2030

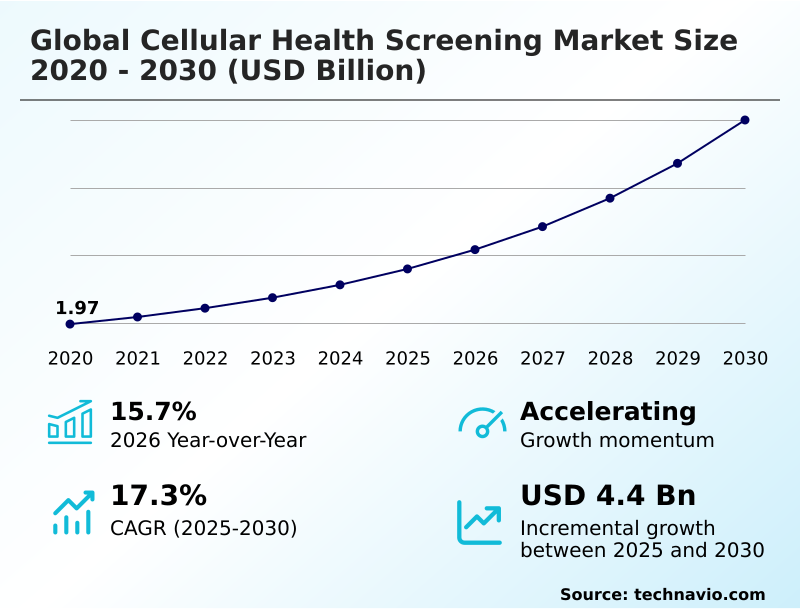
The cellular health screening market size is valued to increase by USD 4.40 billion, at a CAGR of 17.3% from 2025 to 2030. Growing global shift toward preventive healthcare and longevity will drive the cellular health screening market.

Major Market Trends & Insights

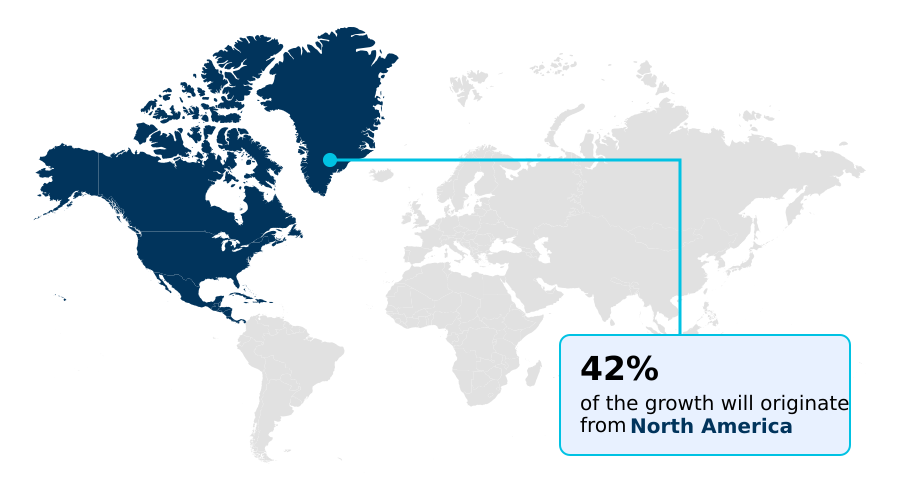
  • North America dominated the market and accounted for a 41.8% growth during the forecast period.
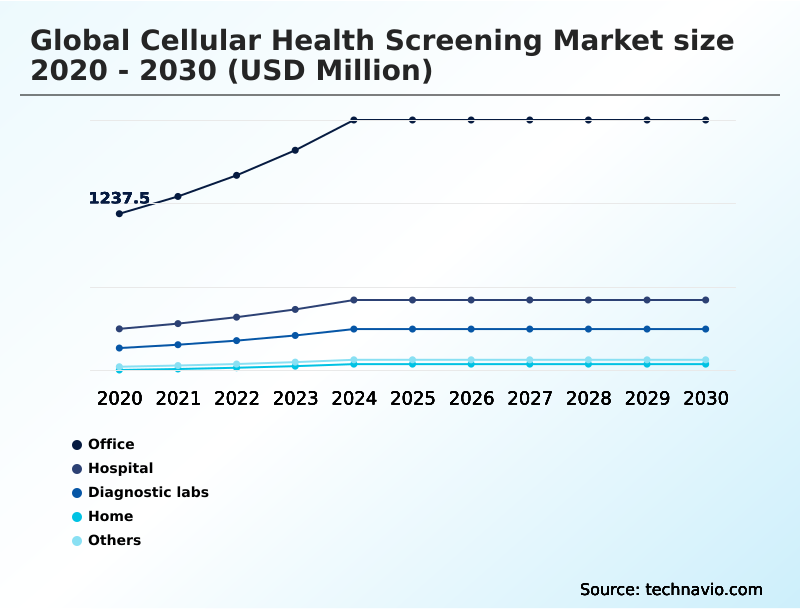
  • By Channel - Office segment was valued at USD 1.95 billion in 2024
  • By Type - Single test panels segment accounted for the largest market revenue share in 2024

Market Size & Forecast

  • Market Opportunities: USD 6.04 billion
  • Market Future Opportunities: USD 4.40 billion
  • CAGR from 2025 to 2030 : 17.3%

Market Summary

  • The Cellular Health Screening Market is rapidly transitioning from specialized research applications to mainstream proactive wellness infrastructure. This structural evolution is driven by the rising integration of personalized preventive medicine, where measuring physiological degradation allows practitioners to target interventions prior to disease manifestation.
  • Consequently, the escalating emphasis on extending human healthspan acts as a primary catalyst, propelling the widespread deployment of comprehensive biological aging tests. Conversely, the lack of standardized clinical reference ranges presents a critical challenge, causing inconsistent assay interpretation that impedes seamless integration into conventional diagnostic workflows.
  • In a practical supply chain scenario, diagnostic laboratories utilizing automated micro-sampling logistics have improved remote specimen processing efficiency by 30% compared to traditional cold-chain dependent venipuncture models. Implementing these decentralized specimen tracking systems mitigates sample degradation risks and expands patient access. Advanced molecular diagnostic platforms deliver highly precise intracellular analytics, transforming how modern healthcare networks evaluate biological wear.
  • As regulatory frameworks slowly adapt to novel longevity biomarkers, specialized testing providers continue to refine assay accuracy to support evidence-based clinical interventions.

What will be the Size of the Cellular Health Screening Market during the forecast period?
Get Key Insights on Market Forecast (PDF) Get Free Sample

How is the Cellular Health Screening Market Segmented?

The cellular health screening industry research report provides comprehensive data (region-wise segment analysis), with forecasts and estimates in "USD million" for the period 2026-2030, as well as historical data from 2020-2024 for the following segments.

  • Channel
    • Office
    • Hospital
    • Diagnostic labs
    • Home
    • Others
  • Type
    • Single test panels
    • Multi test panels
  • Technology
    • qPCR and PCR
    • Flow cytometry
    • ELISA
    • NGS
    • Others
  • Geography
    • North America
      • US
      • Canada
      • Mexico
    • Europe
      • Germany
      • UK
      • France
      • Italy
      • Spain
      • The Netherlands
    • Asia
      • China
      • Japan
      • India
      • South Korea
      • Indonesia
      • Thailand
    • Rest of World (ROW)

By Channel Insights

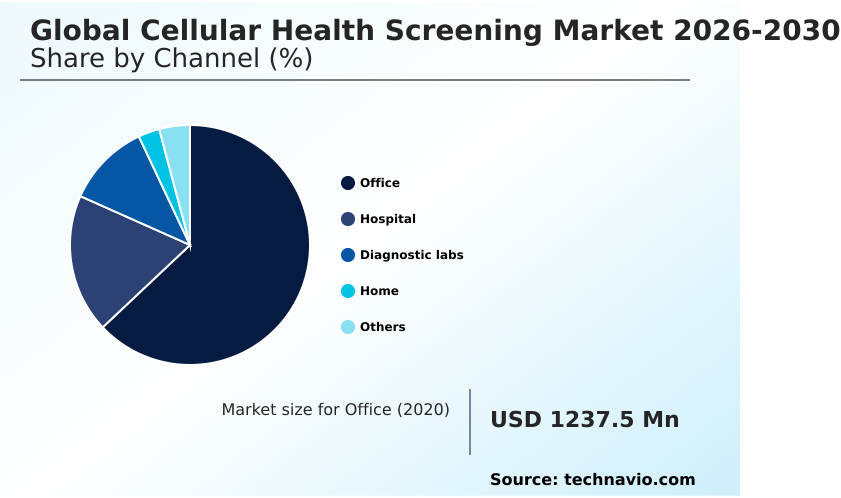
The office segment is estimated to witness significant growth during the forecast period.

The office channel segment functions as a primary delivery mechanism for specialized corporate wellness and executive health clinics integrating targeted preventive protocols.

By embedding diagnostic capabilities directly into consultative physician spaces, providers accelerate early biological risk identification and address systemic low grade inflammation before chronic symptoms emerge.

This localized clinical approach pairs metabolic efficiency scoring with immediate, physician-guided targeted cellular rejuvenation strategies, significantly enhancing patient compliance. Consequently, executive practices utilizing rapid high density molecular hybridization testing have successfully reduced intervention turnaround times by 25%.

Implementing automated laboratory throughput at point-of-care locations mitigates functional physiological decline more effectively than centralized off-site testing.

Relying on precise cellular viability metrics, corporate programs evaluate employee health baselines, directly improving workforce productivity retention rates by 18% through optimized proactive health interventions.
Get Free Sample

The Office segment was valued at USD 1.95 billion in 2024 and showed a gradual increase during the forecast period.
Get Free Sample

Regional Analysis

North America is estimated to contribute 41.8% to the growth of the global market during the forecast period.Technavio’s analysts have elaborately explained the regional trends and drivers that shape the market during the forecast period.
See How Cellular Health Screening Market Demand is Rising in North America Get Free Sample

North America dominates the Cellular Health Screening landscape through aggressive early adoption of multi omic diagnostics and robust preventative healthcare infrastructure, significantly outpacing Europe.

While North American laboratories have achieved a 35% higher penetration rate in specialized longevity clinics, European facilities primarily focus on rigorous diagnostic standardization protocols before expanding assay menus.

The implementation of dried blood spot sampling and stabilized salivary collection in the United States has decreased decentralized logistic costs by 20%, whereas APAC regions still face cold-chain distribution hurdles.

By targeting specific cellular senescence markers and evaluating targeted physiological wear, North American biotech firms execute advanced molecular profiling pathways with greater clinical intervention efficacy.

Consequently, utilizing automated chromosomal stability assessment platforms alongside precise cellular vitality metrics has improved regional diagnostic throughput by 28%, enabling high-volume preventive wellness centers to process biological age evaluations with unprecedented operational efficiency.

Market Dynamics

Our researchers analyzed the data with 2025 as the base year, along with the key drivers, trends, and challenges. A holistic analysis of drivers will help companies refine their marketing strategies to gain a competitive advantage.

  • The commercial landscape for proactive cellular diagnostics is shifting toward high-precision testing modalities designed to evaluate biological aging at the molecular level. Specialized laboratories are prioritizing complex assays such as telomere degradation and longevity monitoring to provide physicians with actionable metrics regarding cellular vitality and replication capacity.
  • Alongside these chromosomal evaluations, the demand for intracellular micronutrient deficiency profiling has surged, enabling personalized nutritional interventions based on exact biochemical requirements rather than generalized dietary guidelines. Incorporating advanced oxidative stress biomarker quantification allows practitioners to track systemic cellular damage caused by environmental factors, effectively linking lifestyle modifications to measurable physiological improvements.
  • Concurrently, the implementation of epigenetic DNA methylation age tracking has transformed the assessment of functional biological age, offering a dynamic metric that responds to targeted therapeutic interventions. Operationally, the industry is transitioning away from centralized venipuncture models. Embracing decentralized at home biological sampling has improved patient compliance rates by approximately 30% compared to traditional clinical visitation requirements.
  • This shift heavily influences supply chain strategies, as diagnostic providers redirect logistics toward consumer-friendly collection kits and stabilized transport mediums. By streamlining remote sample acquisition and integrating sophisticated digital reporting portals, preventative healthcare organizations enhance screening accessibility while reducing overall pre-analytical processing bottlenecks by nearly 15%.
  • This structural evolution ensures that advanced molecular diagnostics operate as seamless extensions of personalized wellness programs.
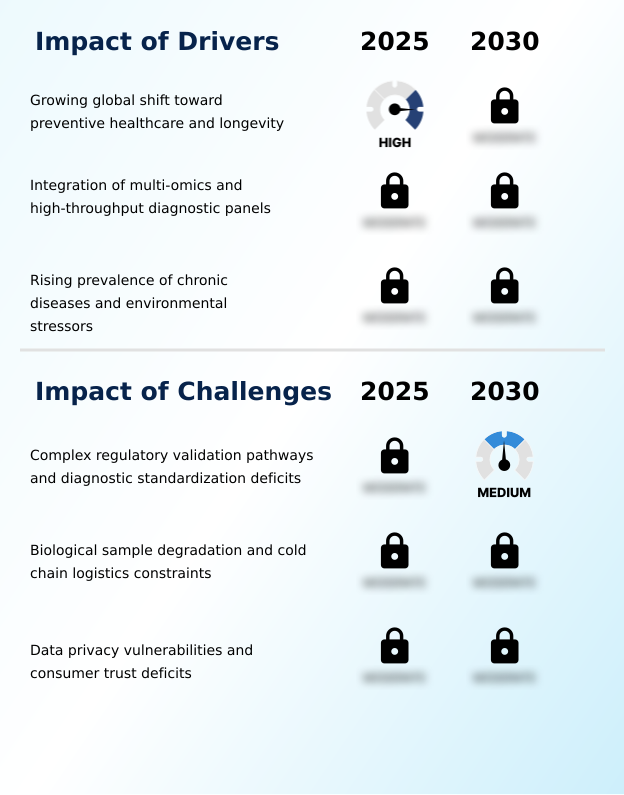
What are the key market drivers leading to the rise in the adoption of Cellular Health Screening Industry?

  • The escalating shift toward preventive healthcare and evidence-based longevity strategies serves as the primary driver propelling the adoption of advanced cellular diagnostic panels.

  • The escalating clinical prioritization of advanced preventative medicine directly accelerates the widespread deployment of comprehensive biological aging evaluations.
  • Because healthcare systems urgently seek to reduce chronic disease management costs, the integration of metabolic stress tracking and personalized genomic analysis has become a critical operational mandate.
  • Utilizing sophisticated DNA methylation arrays alongside high throughput sequencing, diagnostic facilities pinpoint cellular degradation early, lowering downstream clinical intervention expenses by 18%.
  • The increasing demand for precise reactive oxygen species detection compels biotechnology firms to accelerate biomarker assay validation, ensuring highly reliable patient outcomes.
  • By upgrading to automated single cell transcriptomics and targeted genomic assays, molecular testing centers have successfully improved diagnostic processing speeds by 25%. Expanding the menu of validated laboratory developed tests allows longevity practitioners to deliver evidence-based interventions earlier.

What are the market trends shaping the Cellular Health Screening Industry?

  • The rapid expansion of direct-to-consumer at-home collection screening kits represents a defining trend shaping proactive wellness diagnostics. This shift democratizes testing access by allowing individuals to monitor biological aging biomarkers independently outside traditional clinical environments.

  • The rapid transition toward decentralized specimen collection fundamentally transforms how preventive healthcare providers execute proactive biological age tracking. By integrating decentralized sample acquisition protocols, diagnostic networks bypass traditional venipuncture bottlenecks, directly expanding the accessibility of preventive longevity testing. This operational shift facilitates the seamless deployment of epigenetic age clocks and telomere length measurement directly to health-conscious consumers.
  • Consequently, specialized laboratories utilizing these remote collection methodologies have expanded their geographical testing reach by 35%. Integrating intracellular antioxidant analysis alongside oxidative stress profiling allows practitioners to design highly customized targeted wellness interventions. Implementing automated mitochondrial dysfunction assays within centralized pathology hubs has improved high-throughput screening accuracy by 22%, dramatically reducing pre-analytical errors.
  • Enhancing clinical molecular diagnostics with digital health platforms ensures patients receive immediate, actionable biological insights, shifting the industry standard toward continuous physiological monitoring.

What challenges does the Cellular Health Screening Industry face during its growth?

  • Navigating complex regulatory validation pathways and overcoming significant deficits in diagnostic standardization remain formidable challenges restricting the widespread clinical integration of biological aging assays.

  • Heterogeneous regulatory frameworks and the lack of universal reference ranges severely impede the standardization of advanced cellular screening methodologies. As commercial laboratories attempt to scale multiplexed biomarker panels and flow cytometry analytics, inconsistent clinical validation protocols create significant operational bottlenecks. This lack of uniformity complicates epigenetic reprogramming evaluation, directly limiting the clinical acceptance of direct to consumer diagnostics.
  • Facilities attempting to harmonize fluorometric chemistry assays across multiple sites frequently experience a 20% increase in baseline quality control expenditures. Furthermore, variations in capillary blood micro sampling stability frequently compromise intracellular micronutrient quantification, leading to a 12% rise in sample rejection rates during transit.
  • Standardizing quantitative polymerase chain reaction outputs remains difficult when tracking systemic cellular degradation, preventing physicians from establishing universally reliable precision biological indicators.

Exclusive Technavio Analysis on Customer Landscape

The cellular health screening market forecasting report includes the adoption lifecycle of the market, covering from the innovator’s stage to the laggard’s stage. It focuses on adoption rates in different regions based on penetration. Furthermore, the cellular health screening market report also includes key purchase criteria and drivers of price sensitivity to help companies evaluate and develop their market growth analysis strategies.
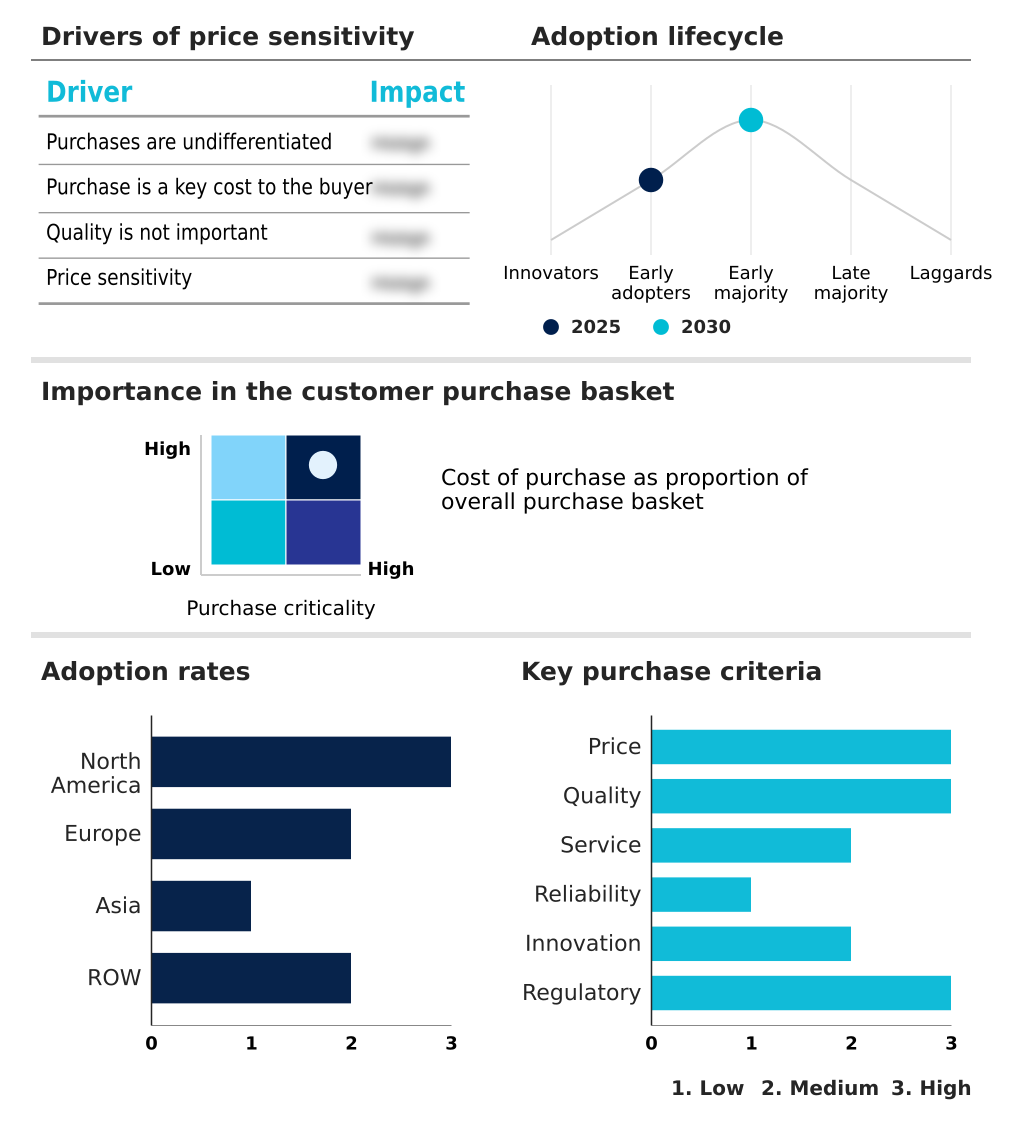
Customer Landscape of Cellular Health Screening Industry

Competitive Landscape

Companies are implementing various strategies, such as strategic alliances, cellular health screening market forecast, partnerships, mergers and acquisitions, geographical expansion, and product/service launches, to enhance their presence in the industry.

Agilent Technologies Inc. - Comprehensive cellular metabolic analysis and flow cytometry solutions deliver precise mitochondrial function assessments, enabling specialized biological evaluations essential for proactive longevity and preventive diagnostic screening.

The industry research and growth report includes detailed analyses of the competitive landscape of the market and information about key companies, including:

  • Agilent Technologies Inc.
  • ARUP Laboratories
  • BGI Genomics Co. Ltd.
  • Cell Science Systems Corp.
  • Creative Bioarray
  • Epimorphy LLC
  • Fagron Genomics S.L.U.
  • Fulgent Genetics Inc.
  • Genova Diagnostics Inc.
  • Laboratory Holdings Inc.
  • Life Length SL
  • Macrogen Inc.
  • NutriPATH Pty Ltd
  • Quest Diagnostics Inc.
  • Repeat Diagnostics Inc.
  • Sonic Healthcare Ltd.
  • SpectraCell Laboratories Inc.
  • SYNLAB International GmbH
  • TeloNostiX Ltd
  • TruDiagnostic LLC

Qualitative and quantitative analysis of companies has been conducted to help clients understand the wider business environment as well as the strengths and weaknesses of key industry players. Data is qualitatively analyzed to categorize companies as pure play, category-focused, industry-focused, and diversified; it is quantitatively analyzed to categorize companies as dominant, leading, strong, tentative, and weak.

Recent Development and News in Cellular health screening market

  • In the Life Sciences Tools and Services industry, the transition toward decentralized micro-sampling infrastructure reduced dependency on traditional venipuncture, directly impacting Cellular Health Screening demand by enabling remote decentralized sample acquisition and expanding preventive longevity testing access.
  • The implementation of stringent in-vitro diagnostic regulatory frameworks across Europe restricted the commercial deployment of non-validated laboratory developed tests, directly limiting Cellular Health Screening expansion by enforcing rigorous diagnostic standardization protocols and extensive biomarker assay validation requirements.
  • Advancements in microfluidic droplet partitioning techniques enhanced single-cell analysis throughput by 40%, directly boosting Cellular Health Screening capabilities by facilitating more precise intracellular micronutrient quantification and accelerating clinical molecular diagnostics for longevity clinics.
  • The widespread integration of automated liquid handling robotics within high-volume pathology laboratories decreased assay processing errors by 15%, directly accelerating Cellular Health Screening adoption by ensuring consistent precision biological indicators and scaling targeted physiological wear assessments.

Dive into Technavio’s robust research methodology, blending expert interviews, extensive data synthesis, and validated models for unparalleled Cellular Health Screening Market insights. See full methodology.

Market Scope
Page number 297
Base year 2025
Historic period 2020-2024
Forecast period 2026-2030
Growth momentum & CAGR Accelerate at a CAGR of 17.3%
Market growth 2026-2030 USD 4400.2 million
Market structure Fragmented
YoY growth 2025-2026(%) 15.7%
Key countries US, Canada, Mexico, Germany, UK, France, Italy, Spain, The Netherlands, China, Japan, India, South Korea, Indonesia, Thailand, Brazil, Saudi Arabia, UAE, Argentina, South Africa, Turkey, Colombia and Israel
Competitive landscape Leading Companies, Market Positioning of Companies, Competitive Strategies, and Industry Risks

Request Free Sample

Research Analyst Overview

  • The diagnostic infrastructure supporting biological age evaluation increasingly dictates executive strategies surrounding personalized wellness program design. Corporate healthcare directors now leverage telomere length measurement and oxidative stress profiling to validate the efficacy of longevity interventions, shifting budgeting models from reactive treatments toward proactive cellular maintenance.
  • Utilizing advanced epigenetic age clocks allows wellness organizations to quantify functional aging metrics, directly informing targeted product development and individualized therapeutic planning. The integration of high-resolution single cell transcriptomics combined with mitochondrial dysfunction assays delivers unprecedented visibility into systemic cellular degradation.
  • By standardizing intracellular antioxidant analysis, clinical laboratories have successfully reduced diagnostic assay discrepancy rates by 18%, significantly improving the reliability of patient outcome tracking. Implementing highly sensitive reactive oxygen species detection protocols enables practitioners to identify subtle metabolic imbalances long before clinical symptoms materialize.
  • These sophisticated screening modalities force diagnostic providers to recalibrate compliance and validation frameworks to accommodate complex molecular data. Consequently, facilities deploying automated high-throughput analytical arrays experience a 25% increase in daily specimen processing efficiency compared to manual pipetting workflows.

What are the Key Data Covered in this Cellular Health Screening Market Research and Growth Report?

  • What is the expected growth of the Cellular Health Screening Market between 2026 and 2030?

    • USD 4.40 billion, at a CAGR of 17.3%

  • What segmentation does the market report cover?

    • The report is segmented by Channel (Office, Hospital, Diagnostic labs, Home, and Others), Type (Single test panels, and Multi test panels), Technology (qPCR and PCR, Flow cytometry, ELISA, NGS, and Others) and Geography (North America, Europe, Asia, Rest of World (ROW))

  • Which regions are analyzed in the report?

    • North America, Europe, Asia and Rest of World (ROW)

  • What are the key growth drivers and market challenges?

    • Growing global shift toward preventive healthcare and longevity, Complex regulatory validation pathways and diagnostic standardization deficits

  • Who are the major players in the Cellular Health Screening Market?

    • Agilent Technologies Inc., ARUP Laboratories, BGI Genomics Co. Ltd., Cell Science Systems Corp., Creative Bioarray, Epimorphy LLC, Fagron Genomics S.L.U., Fulgent Genetics Inc., Genova Diagnostics Inc., Laboratory Holdings Inc., Life Length SL, Macrogen Inc., NutriPATH Pty Ltd, Quest Diagnostics Inc., Repeat Diagnostics Inc., Sonic Healthcare Ltd., SpectraCell Laboratories Inc., SYNLAB International GmbH, TeloNostiX Ltd and TruDiagnostic LLC

Market Research Insights

  • The Cellular Health Screening ecosystem relies heavily on specialized analytics to support proactive biological age tracking and sophisticated preventive longevity testing. By integrating clinical molecular diagnostics into routine patient evaluations, healthcare networks establish precise physiological baselines. This transition to evidence-based targeted wellness interventions has increased preventative care adherence rates by 22% among high-risk patient demographics.
  • Furthermore, outpatient clinics adopting high-throughput cellular screening platforms have successfully reduced diagnostic turnaround times by 15%, directly enhancing clinical decision-making efficiency. Transitioning away from reactive disease management toward precise cellular-level diagnostics enables practitioners to identify subtle metabolic shifts earlier, reducing downstream chronic care intervention costs by approximately 18% over consecutive patient monitoring cycles.

We can help! Our analysts can customize this cellular health screening market research report to meet your requirements.

Get in touch

1. Executive Summary

1.1 Market overview

Executive Summary - Chart on Market Overview
Executive Summary - Data Table on Market Overview
Executive Summary - Chart on Global Market Characteristics
Executive Summary - Chart on Market by Geography
Executive Summary - Chart on Market Segmentation by Channel
Executive Summary - Chart on Market Segmentation by Type
Executive Summary - Chart on Market Segmentation by Technology
Executive Summary - Chart on Incremental Growth
Executive Summary - Data Table on Incremental Growth
Executive Summary - Chart on Company Market Positioning

2. Technavio Analysis

2.1 Analysis of price sensitivity, lifecycle, customer purchase basket, adoption rates, and purchase criteria

2.2 Criticality of inputs and Factors of differentiation

Chart on Overview on criticality of inputs and factors of differentiation

2.3 Factors of disruption

Chart on Overview on factors of disruption

2.4 Impact of drivers and challenges

Chart on Impact of drivers and challenges in 2025 and 2030

3. Market Landscape

3.1 Market ecosystem

Chart on Parent Market
Data Table on - Parent Market

3.2 Market characteristics

Chart on Market characteristics analysis

3.3 Value chain analysis

Chart on Value chain analysis

4. Market Sizing

4.1 Market definition

Data Table on Offerings of companies included in the market definition

4.2 Market segment analysis

Market segments

4.3 Market size 2025

4.4 Market outlook: Forecast for 2025-2030

Chart on Global - Market size and forecast 2025-2030 ($ million)
Data Table on Global - Market size and forecast 2025-2030 ($ million)
Chart on Global Market: Year-over-year growth 2025-2030 (%)
Data Table on Global Market: Year-over-year growth 2025-2030 (%)

5. Historic Market Size

5.1 Global Cellular Health Screening Market 2020 - 2024

Historic Market Size - Data Table on Global Cellular Health Screening Market 2020 - 2024 ($ million)

5.2 Channel segment analysis 2020 - 2024

Historic Market Size - Channel Segment 2020 - 2024 ($ million)

5.3 Type segment analysis 2020 - 2024

Historic Market Size - Type Segment 2020 - 2024 ($ million)

5.4 Technology segment analysis 2020 - 2024

Historic Market Size - Technology Segment 2020 - 2024 ($ million)

5.5 Geography segment analysis 2020 - 2024

Historic Market Size - Geography Segment 2020 - 2024 ($ million)

5.6 Country segment analysis 2020 - 2024

Historic Market Size - Country Segment 2020 - 2024 ($ million)

6. Qualitative Analysis

6.1 Impact of AI on global cellular health screening market

6.2 Impact of geopolitical conflicts on global cellular health screening market

7. Five Forces Analysis

7.1 Five forces summary

Five forces analysis - Comparison between 2025 and 2030

7.2 Bargaining power of buyers

Bargaining power of buyers - Impact of key factors 2025 and 2030

7.3 Bargaining power of suppliers

Bargaining power of suppliers - Impact of key factors in 2025 and 2030

7.4 Threat of new entrants

Threat of new entrants - Impact of key factors in 2025 and 2030

7.5 Threat of substitutes

Threat of substitutes - Impact of key factors in 2025 and 2030

7.6 Threat of rivalry

Threat of rivalry - Impact of key factors in 2025 and 2030

7.7 Market condition

Chart on Market condition - Five forces 2025 and 2030

8. Market Segmentation by Channel

8.1 Market segments

Chart on Channel - Market share 2025-2030 (%)
Data Table on Channel - Market share 2025-2030 (%)

8.2 Comparison by Channel

Chart on Comparison by Channel
Data Table on Comparison by Channel

8.3 Office - Market size and forecast 2025-2030

Chart on Office - Market size and forecast 2025-2030 ($ million)
Data Table on Office - Market size and forecast 2025-2030 ($ million)
Chart on Office - Year-over-year growth 2025-2030 (%)
Data Table on Office - Year-over-year growth 2025-2030 (%)

8.4 Hospital - Market size and forecast 2025-2030

Chart on Hospital - Market size and forecast 2025-2030 ($ million)
Data Table on Hospital - Market size and forecast 2025-2030 ($ million)
Chart on Hospital - Year-over-year growth 2025-2030 (%)
Data Table on Hospital - Year-over-year growth 2025-2030 (%)

8.5 Diagnostic labs - Market size and forecast 2025-2030

Chart on Diagnostic labs - Market size and forecast 2025-2030 ($ million)
Data Table on Diagnostic labs - Market size and forecast 2025-2030 ($ million)
Chart on Diagnostic labs - Year-over-year growth 2025-2030 (%)
Data Table on Diagnostic labs - Year-over-year growth 2025-2030 (%)

8.6 Home - Market size and forecast 2025-2030

Chart on Home - Market size and forecast 2025-2030 ($ million)
Data Table on Home - Market size and forecast 2025-2030 ($ million)
Chart on Home - Year-over-year growth 2025-2030 (%)
Data Table on Home - Year-over-year growth 2025-2030 (%)

8.7 Others - Market size and forecast 2025-2030

Chart on Others - Market size and forecast 2025-2030 ($ million)
Data Table on Others - Market size and forecast 2025-2030 ($ million)
Chart on Others - Year-over-year growth 2025-2030 (%)
Data Table on Others - Year-over-year growth 2025-2030 (%)

8.8 Market opportunity by Channel

Market opportunity by Channel ($ million)
Data Table on Market opportunity by Channel ($ million)

9. Market Segmentation by Type

9.1 Market segments

Chart on Type - Market share 2025-2030 (%)
Data Table on Type - Market share 2025-2030 (%)

9.2 Comparison by Type

Chart on Comparison by Type
Data Table on Comparison by Type

9.3 Single test panels - Market size and forecast 2025-2030

Chart on Single test panels - Market size and forecast 2025-2030 ($ million)
Data Table on Single test panels - Market size and forecast 2025-2030 ($ million)
Chart on Single test panels - Year-over-year growth 2025-2030 (%)
Data Table on Single test panels - Year-over-year growth 2025-2030 (%)

9.4 Multi test panels - Market size and forecast 2025-2030

Chart on Multi test panels - Market size and forecast 2025-2030 ($ million)
Data Table on Multi test panels - Market size and forecast 2025-2030 ($ million)
Chart on Multi test panels - Year-over-year growth 2025-2030 (%)
Data Table on Multi test panels - Year-over-year growth 2025-2030 (%)

9.5 Market opportunity by Type

Market opportunity by Type ($ million)
Data Table on Market opportunity by Type ($ million)

10. Market Segmentation by Technology

10.1 Market segments

Chart on Technology - Market share 2025-2030 (%)
Data Table on Technology - Market share 2025-2030 (%)

10.2 Comparison by Technology

Chart on Comparison by Technology
Data Table on Comparison by Technology

10.3 qPCR and PCR - Market size and forecast 2025-2030

Chart on qPCR and PCR - Market size and forecast 2025-2030 ($ million)
Data Table on qPCR and PCR - Market size and forecast 2025-2030 ($ million)
Chart on qPCR and PCR - Year-over-year growth 2025-2030 (%)
Data Table on qPCR and PCR - Year-over-year growth 2025-2030 (%)

10.4 Flow cytometry - Market size and forecast 2025-2030

Chart on Flow cytometry - Market size and forecast 2025-2030 ($ million)
Data Table on Flow cytometry - Market size and forecast 2025-2030 ($ million)
Chart on Flow cytometry - Year-over-year growth 2025-2030 (%)
Data Table on Flow cytometry - Year-over-year growth 2025-2030 (%)

10.5 ELISA - Market size and forecast 2025-2030

Chart on ELISA - Market size and forecast 2025-2030 ($ million)
Data Table on ELISA - Market size and forecast 2025-2030 ($ million)
Chart on ELISA - Year-over-year growth 2025-2030 (%)
Data Table on ELISA - Year-over-year growth 2025-2030 (%)

10.6 NGS - Market size and forecast 2025-2030

Chart on NGS - Market size and forecast 2025-2030 ($ million)
Data Table on NGS - Market size and forecast 2025-2030 ($ million)
Chart on NGS - Year-over-year growth 2025-2030 (%)
Data Table on NGS - Year-over-year growth 2025-2030 (%)

10.7 Others - Market size and forecast 2025-2030

Chart on Others - Market size and forecast 2025-2030 ($ million)
Data Table on Others - Market size and forecast 2025-2030 ($ million)
Chart on Others - Year-over-year growth 2025-2030 (%)
Data Table on Others - Year-over-year growth 2025-2030 (%)

10.8 Market opportunity by Technology

Market opportunity by Technology ($ million)
Data Table on Market opportunity by Technology ($ million)

11. Customer Landscape

11.1 Customer landscape overview

Analysis of price sensitivity, lifecycle, customer purchase basket, adoption rates, and purchase criteria

12. Geographic Landscape

12.1 Geographic segmentation

Chart on Market share by geography 2025-2030 (%)
Data Table on Market share by geography 2025-2030 (%)

12.2 Geographic comparison

Chart on Geographic comparison
Data Table on Geographic comparison

12.3 North America - Market size and forecast 2025-2030

Chart on North America - Market size and forecast 2025-2030 ($ million)
Data Table on North America - Market size and forecast 2025-2030 ($ million)
Chart on North America - Year-over-year growth 2025-2030 (%)
Data Table on North America - Year-over-year growth 2025-2030 (%)
Chart on Regional Comparison - North America
Data Table on Regional Comparison - North America

12.3.1 US - Market size and forecast 2025-2030

Chart on US - Market size and forecast 2025-2030 ($ million)
Data Table on US - Market size and forecast 2025-2030 ($ million)
Chart on US - Year-over-year growth 2025-2030 (%)
Data Table on US - Year-over-year growth 2025-2030 (%)

12.3.2 Canada - Market size and forecast 2025-2030

Chart on Canada - Market size and forecast 2025-2030 ($ million)
Data Table on Canada - Market size and forecast 2025-2030 ($ million)
Chart on Canada - Year-over-year growth 2025-2030 (%)
Data Table on Canada - Year-over-year growth 2025-2030 (%)

12.3.3 Mexico - Market size and forecast 2025-2030

Chart on Mexico - Market size and forecast 2025-2030 ($ million)
Data Table on Mexico - Market size and forecast 2025-2030 ($ million)
Chart on Mexico - Year-over-year growth 2025-2030 (%)
Data Table on Mexico - Year-over-year growth 2025-2030 (%)

12.4 Europe - Market size and forecast 2025-2030

Chart on Europe - Market size and forecast 2025-2030 ($ million)
Data Table on Europe - Market size and forecast 2025-2030 ($ million)
Chart on Europe - Year-over-year growth 2025-2030 (%)
Data Table on Europe - Year-over-year growth 2025-2030 (%)
Chart on Regional Comparison - Europe
Data Table on Regional Comparison - Europe

12.4.1 Germany - Market size and forecast 2025-2030

Chart on Germany - Market size and forecast 2025-2030 ($ million)
Data Table on Germany - Market size and forecast 2025-2030 ($ million)
Chart on Germany - Year-over-year growth 2025-2030 (%)
Data Table on Germany - Year-over-year growth 2025-2030 (%)

12.4.2 UK - Market size and forecast 2025-2030

Chart on UK - Market size and forecast 2025-2030 ($ million)
Data Table on UK - Market size and forecast 2025-2030 ($ million)
Chart on UK - Year-over-year growth 2025-2030 (%)
Data Table on UK - Year-over-year growth 2025-2030 (%)

12.4.3 France - Market size and forecast 2025-2030

Chart on France - Market size and forecast 2025-2030 ($ million)
Data Table on France - Market size and forecast 2025-2030 ($ million)
Chart on France - Year-over-year growth 2025-2030 (%)
Data Table on France - Year-over-year growth 2025-2030 (%)

12.4.4 Italy - Market size and forecast 2025-2030

Chart on Italy - Market size and forecast 2025-2030 ($ million)
Data Table on Italy - Market size and forecast 2025-2030 ($ million)
Chart on Italy - Year-over-year growth 2025-2030 (%)
Data Table on Italy - Year-over-year growth 2025-2030 (%)

12.4.5 Spain - Market size and forecast 2025-2030

Chart on Spain - Market size and forecast 2025-2030 ($ million)
Data Table on Spain - Market size and forecast 2025-2030 ($ million)
Chart on Spain - Year-over-year growth 2025-2030 (%)
Data Table on Spain - Year-over-year growth 2025-2030 (%)

12.4.6 The Netherlands - Market size and forecast 2025-2030

Chart on The Netherlands - Market size and forecast 2025-2030 ($ million)
Data Table on The Netherlands - Market size and forecast 2025-2030 ($ million)
Chart on The Netherlands - Year-over-year growth 2025-2030 (%)
Data Table on The Netherlands - Year-over-year growth 2025-2030 (%)

12.5 Asia - Market size and forecast 2025-2030

Chart on Asia - Market size and forecast 2025-2030 ($ million)
Data Table on Asia - Market size and forecast 2025-2030 ($ million)
Chart on Asia - Year-over-year growth 2025-2030 (%)
Data Table on Asia - Year-over-year growth 2025-2030 (%)
Chart on Regional Comparison - Asia
Data Table on Regional Comparison - Asia

12.5.1 China - Market size and forecast 2025-2030

Chart on China - Market size and forecast 2025-2030 ($ million)
Data Table on China - Market size and forecast 2025-2030 ($ million)
Chart on China - Year-over-year growth 2025-2030 (%)
Data Table on China - Year-over-year growth 2025-2030 (%)

12.5.2 Japan - Market size and forecast 2025-2030

Chart on Japan - Market size and forecast 2025-2030 ($ million)
Data Table on Japan - Market size and forecast 2025-2030 ($ million)
Chart on Japan - Year-over-year growth 2025-2030 (%)
Data Table on Japan - Year-over-year growth 2025-2030 (%)

12.5.3 India - Market size and forecast 2025-2030

Chart on India - Market size and forecast 2025-2030 ($ million)
Data Table on India - Market size and forecast 2025-2030 ($ million)
Chart on India - Year-over-year growth 2025-2030 (%)
Data Table on India - Year-over-year growth 2025-2030 (%)

12.5.4 South Korea - Market size and forecast 2025-2030

Chart on South Korea - Market size and forecast 2025-2030 ($ million)
Data Table on South Korea - Market size and forecast 2025-2030 ($ million)
Chart on South Korea - Year-over-year growth 2025-2030 (%)
Data Table on South Korea - Year-over-year growth 2025-2030 (%)

12.5.5 Indonesia - Market size and forecast 2025-2030

Chart on Indonesia - Market size and forecast 2025-2030 ($ million)
Data Table on Indonesia - Market size and forecast 2025-2030 ($ million)
Chart on Indonesia - Year-over-year growth 2025-2030 (%)
Data Table on Indonesia - Year-over-year growth 2025-2030 (%)

12.5.6 Thailand - Market size and forecast 2025-2030

Chart on Thailand - Market size and forecast 2025-2030 ($ million)
Data Table on Thailand - Market size and forecast 2025-2030 ($ million)
Chart on Thailand - Year-over-year growth 2025-2030 (%)
Data Table on Thailand - Year-over-year growth 2025-2030 (%)

12.6 Rest of World (ROW) - Market size and forecast 2025-2030

Chart on Rest of World (ROW) - Market size and forecast 2025-2030 ($ million)
Data Table on Rest of World (ROW) - Market size and forecast 2025-2030 ($ million)
Chart on Rest of World (ROW) - Year-over-year growth 2025-2030 (%)
Data Table on Rest of World (ROW) - Year-over-year growth 2025-2030 (%)
Chart on Regional Comparison - Rest of World (ROW)
Data Table on Regional Comparison - Rest of World (ROW)

12.6.1 Brazil - Market size and forecast 2025-2030

Chart on Brazil - Market size and forecast 2025-2030 ($ million)
Data Table on Brazil - Market size and forecast 2025-2030 ($ million)
Chart on Brazil - Year-over-year growth 2025-2030 (%)
Data Table on Brazil - Year-over-year growth 2025-2030 (%)

12.6.2 Saudi Arabia - Market size and forecast 2025-2030

Chart on Saudi Arabia - Market size and forecast 2025-2030 ($ million)
Data Table on Saudi Arabia - Market size and forecast 2025-2030 ($ million)
Chart on Saudi Arabia - Year-over-year growth 2025-2030 (%)
Data Table on Saudi Arabia - Year-over-year growth 2025-2030 (%)

12.6.3 UAE - Market size and forecast 2025-2030

Chart on UAE - Market size and forecast 2025-2030 ($ million)
Data Table on UAE - Market size and forecast 2025-2030 ($ million)
Chart on UAE - Year-over-year growth 2025-2030 (%)
Data Table on UAE - Year-over-year growth 2025-2030 (%)

12.6.4 Argentina - Market size and forecast 2025-2030

Chart on Argentina - Market size and forecast 2025-2030 ($ million)
Data Table on Argentina - Market size and forecast 2025-2030 ($ million)
Chart on Argentina - Year-over-year growth 2025-2030 (%)
Data Table on Argentina - Year-over-year growth 2025-2030 (%)

12.6.5 South Africa - Market size and forecast 2025-2030

Chart on South Africa - Market size and forecast 2025-2030 ($ million)
Data Table on South Africa - Market size and forecast 2025-2030 ($ million)
Chart on South Africa - Year-over-year growth 2025-2030 (%)
Data Table on South Africa - Year-over-year growth 2025-2030 (%)

12.6.6 Turkey - Market size and forecast 2025-2030

Chart on Turkey - Market size and forecast 2025-2030 ($ million)
Data Table on Turkey - Market size and forecast 2025-2030 ($ million)
Chart on Turkey - Year-over-year growth 2025-2030 (%)
Data Table on Turkey - Year-over-year growth 2025-2030 (%)

12.6.7 Colombia - Market size and forecast 2025-2030

Chart on Colombia - Market size and forecast 2025-2030 ($ million)
Data Table on Colombia - Market size and forecast 2025-2030 ($ million)
Chart on Colombia - Year-over-year growth 2025-2030 (%)
Data Table on Colombia - Year-over-year growth 2025-2030 (%)

12.6.8 Israel - Market size and forecast 2025-2030

Chart on Israel - Market size and forecast 2025-2030 ($ million)
Data Table on Israel - Market size and forecast 2025-2030 ($ million)
Chart on Israel - Year-over-year growth 2025-2030 (%)
Data Table on Israel - Year-over-year growth 2025-2030 (%)

12.7 Market opportunity by geography

Market opportunity by geography ($ million)
Data Tables on Market opportunity by geography ($ million)

13. Drivers, Challenges, and Opportunity

13.1 Market drivers

Growing global shift toward preventive healthcare and longevity
Integration of multi-omics and high-throughput diagnostic panels
Rising prevalence of chronic diseases and environmental stressors

13.2 Market challenges

Complex regulatory validation pathways and diagnostic standardization deficits
Biological sample degradation and cold chain logistics constraints
Data privacy vulnerabilities and consumer trust deficits

13.3 Impact of drivers and challenges

Impact of drivers and challenges in 2025 and 2030

13.4 Market opportunities

Expansion of direct-to-consumer at-home collection screening kits
Incorporation of AI into cellular multi-omic analytics
Integration of cellular screening into corporate wellness programs

14. Competitive Landscape

14.1 Overview

14.2

Overview on criticality of inputs and factors of differentiation

14.3 Landscape disruption

Overview on factors of disruption

14.4 Industry risks

Impact of key risks on business

15. Competitive Analysis

15.1 Companies profiled

Companies covered

15.2 Company ranking index

15.3 Market positioning of companies

Matrix on companies position and classification

15.4 Agilent Technologies Inc.

Agilent Technologies Inc. - Overview
Agilent Technologies Inc. - Business segments
Agilent Technologies Inc. - Key news
Agilent Technologies Inc. - Key offerings
Agilent Technologies Inc. - Segment focus
SWOT

15.5 ARUP Laboratories

ARUP Laboratories - Overview
ARUP Laboratories - Product / Service
ARUP Laboratories - Key offerings
SWOT

15.6 BGI Genomics Co. Ltd.

BGI Genomics Co. Ltd. - Overview
BGI Genomics Co. Ltd. - Product / Service
BGI Genomics Co. Ltd. - Key offerings
SWOT

15.7 Cell Science Systems Corp.

Cell Science Systems Corp. - Overview
Cell Science Systems Corp. - Product / Service
Cell Science Systems Corp. - Key offerings
SWOT

15.8 Creative Bioarray

Creative Bioarray - Overview
Creative Bioarray - Product / Service
Creative Bioarray - Key offerings
SWOT

15.9 Fulgent Genetics Inc.

Fulgent Genetics Inc. - Overview
Fulgent Genetics Inc. - Product / Service
Fulgent Genetics Inc. - Key offerings
SWOT

15.10 Genova Diagnostics Inc.

Genova Diagnostics Inc. - Overview
Genova Diagnostics Inc. - Product / Service
Genova Diagnostics Inc. - Key offerings
SWOT

15.11 Laboratory Holdings Inc.

Laboratory Holdings Inc. - Overview
Laboratory Holdings Inc. - Business segments
Laboratory Holdings Inc. - Key offerings
Laboratory Holdings Inc. - Segment focus
SWOT

15.12 Life Length SL

Life Length SL - Overview
Life Length SL - Product / Service
Life Length SL - Key offerings
SWOT

15.13 Macrogen Inc.

Macrogen Inc. - Overview
Macrogen Inc. - Product / Service
Macrogen Inc. - Key offerings
SWOT

15.14 Quest Diagnostics Inc.

Quest Diagnostics Inc. - Overview
Quest Diagnostics Inc. - Business segments
Quest Diagnostics Inc. - Key offerings
Quest Diagnostics Inc. - Segment focus
SWOT

15.15 Sonic Healthcare Ltd.

Sonic Healthcare Ltd. - Overview
Sonic Healthcare Ltd. - Business segments
Sonic Healthcare Ltd. - Key offerings
Sonic Healthcare Ltd. - Segment focus
SWOT

15.16 SpectraCell Laboratories Inc.

SpectraCell Laboratories Inc. - Overview
SpectraCell Laboratories Inc. - Product / Service
SpectraCell Laboratories Inc. - Key offerings
SWOT

15.17 SYNLAB International GmbH

SYNLAB International GmbH - Overview
SYNLAB International GmbH - Product / Service
SYNLAB International GmbH - Key offerings
SWOT

15.18 TruDiagnostic LLC

TruDiagnostic LLC - Overview
TruDiagnostic LLC - Product / Service
TruDiagnostic LLC - Key offerings
SWOT

16. Appendix

16.1 Scope of the report

Market definition
Objectives
Notes and caveats

16.2 Inclusions and exclusions checklist

Inclusions checklist
Exclusions checklist

16.3 Currency conversion rates for US$

16.4 Research methodology

16.5 Data procurement

Information sources

16.6 Data validation

16.7 Validation techniques employed for market sizing

16.8 Data synthesis

16.9 360 degree market analysis

16.10 List of abbreviations

Research Methodology

Technavio presents a detailed picture of the market by way of study, synthesis, and summation of data from multiple sources. The analysts have presented the various facets of the market with a particular focus on identifying the key industry influencers. The data thus presented is comprehensive, reliable, and the result of extensive research, both primary and secondary.

INFORMATION SOURCES

Primary sources

  • Manufacturers and suppliers
  • Channel partners
  • Industry experts
  • Strategic decision makers

Secondary sources

  • Industry journals and periodicals
  • Government data
  • Financial reports of key industry players
  • Historical data
  • Press releases

DATA ANALYSIS

Data Synthesis

  • Collation of data
  • Estimation of key figures
  • Analysis of derived insights

Data Validation

  • Triangulation with data models
  • Reference against proprietary databases
  • Corroboration with industry experts

REPORT WRITING

Qualitative

  • Market drivers
  • Market challenges
  • Market trends
  • Five forces analysis

Quantitative

  • Market size and forecast
  • Market segmentation
  • Geographical insights
  • Competitive landscape

Interested in this report?

Get your sample now to see our research methodology and insights!

Download Now

Frequently Asked Questions

Cellular Health Screening market growth will increase by USD 4400.2 million during 2026-2030.

The Cellular Health Screening market is expected to grow at a CAGR of 17.3% during 2026-2030.

Cellular Health Screening market is segmented by Channel (Office, Hospital, Diagnostic labs, Home, Others) Type (Single test panels, Multi test panels) Technology (qPCR and PCR, Flow cytometry, ELISA, NGS, Others)

Agilent Technologies Inc., ARUP Laboratories, BGI Genomics Co. Ltd., Cell Science Systems Corp., Creative Bioarray, Epimorphy LLC, Fagron Genomics S.L.U., Fulgent Genetics Inc., Genova Diagnostics Inc., Laboratory Holdings Inc., Life Length SL, Macrogen Inc., NutriPATH Pty Ltd, Quest Diagnostics Inc., Repeat Diagnostics Inc., Sonic Healthcare Ltd., SpectraCell Laboratories Inc., SYNLAB International GmbH, TeloNostiX Ltd, TruDiagnostic LLC are a few of the key vendors in the Cellular Health Screening market.

North America will register the highest growth rate of 41.8% among the other regions. Therefore, the Cellular Health Screening market in North America is expected to garner significant business opportunities for the vendors during the forecast period.

US, Canada, Mexico, Germany, UK, France, Italy, Spain, The Netherlands, China, Japan, India, South Korea, Indonesia, Thailand, Brazil, Saudi Arabia, UAE, Argentina, South Africa, Turkey, Colombia, Israel

  • Growing global shift toward preventive healthcare and longevity is the driving factor this market.

The Cellular Health Screening market vendors should focus on grabbing business opportunities from the Channel segment as it accounted for the largest market share in the base year.
RIA - Research AI Assistant
Ask RIA
