Certificate Authority Market Analysis, Size, and Forecast 2026-2030: North America (US, Canada, and Mexico), Europe (Germany, UK, and France), APAC (China, India, and Japan), Middle East and Africa (Saudi Arabia, UAE, and South Africa), South America (Brazil, Argentina, and Colombia), and Rest of World (ROW)

Certificate Authority Market Analysis, Size, and Forecast 2026-2030:
North America (US, Canada, and Mexico), Europe (Germany, UK, and France), APAC (China, India, and Japan), Middle East and Africa (Saudi Arabia, UAE, and South Africa), South America (Brazil, Argentina, and Colombia), and Rest of World (ROW)

Published: Dec 2025 315 Pages SKU: IRTNTR81210

Market Overview at a Glance

$205.7 Mn
Market Opportunity
13.9%
CAGR 2025 - 2030
33.6%
North America Growth
$127.4 Mn
Certificate type segment 2024

Certificate Authority Market Size 2026-2030

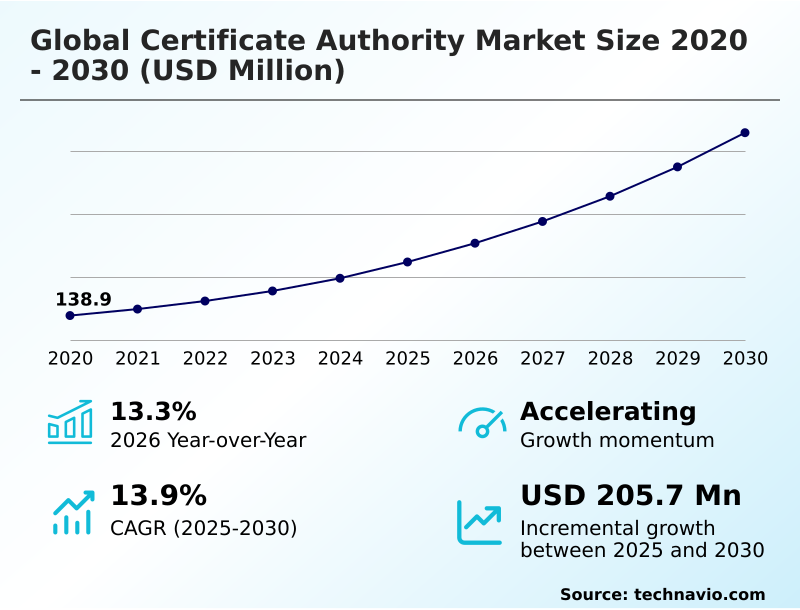
The certificate authority market size is valued to increase by USD 205.7 million, at a CAGR of 13.9% from 2025 to 2030. Escalating sophistication of cyber threats and heightened security awareness will drive the certificate authority market.

Major Market Trends & Insights

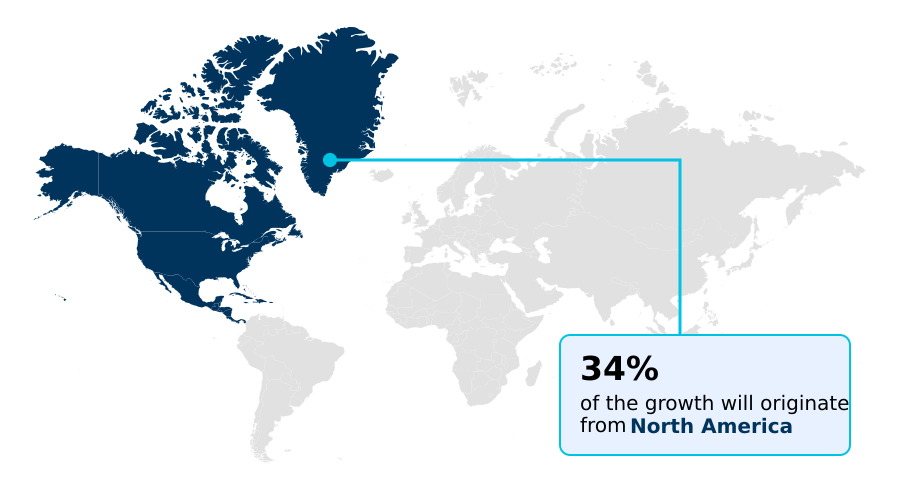
  • North America dominated the market and accounted for a 33.6% growth during the forecast period.
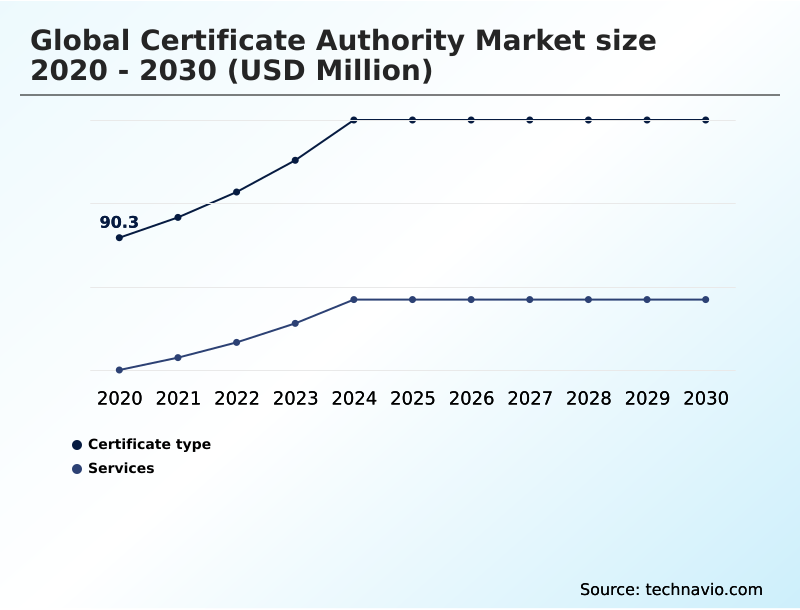
  • By Component - Certificate type segment was valued at USD 127.4 million in 2024
  • By Organization Size - SMEs segment accounted for the largest market revenue share in 2024

Market Size & Forecast

  • Market Opportunities: USD 290.9 million
  • Market Future Opportunities: USD 205.7 million
  • CAGR from 2025 to 2030 : 13.9%

Market Summary

  • The certificate authority market provides the foundational layer of digital trust essential for the modern economy. Its relevance is amplified by the unrelenting pace of digital transformation, which expands the attack surface for cyber threats and necessitates robust encryption and verified digital identities.
  • Key drivers include the exponential growth of the Internet of Things (IoT), where each device requires a unique identity, and stringent regulatory mandates for data protection. A dominant trend is the industry-wide push toward shorter certificate lifecycles, which, while enhancing security, compels the adoption of automated certificate lifecycle management (clm) to handle the increased operational complexity.
  • For instance, in a complex software supply chain, a reliance on automated code signing certificates is critical to ensure the integrity of continuous software updates, a process that would be untenable with manual intervention.
  • This imperative for automation, coupled with the strategic preparation for post-quantum cryptography, is reshaping the competitive landscape, moving the focus from selling individual certificates to delivering comprehensive, scalable trust management platforms.

What will be the Size of the Certificate Authority Market during the forecast period?

Get Key Insights on Market Forecast (PDF) Request Free Sample

How is the Certificate Authority Market Segmented?

The certificate authority industry research report provides comprehensive data (region-wise segment analysis), with forecasts and estimates in "USD million" for the period 2026-2030, as well as historical data from 2020-2024 for the following segments.

  • Component
    • Certificate type
    • Services
  • Organization size
    • SMEs
    • Large enterprises
  • Type
    • Domain validation
    • Organization validation
    • Extended validation
  • Geography
    • North America
      • US
      • Canada
      • Mexico
    • Europe
      • Germany
      • UK
      • France
    • APAC
      • China
      • India
      • Japan
    • Middle East and Africa
      • Saudi Arabia
      • UAE
      • South Africa
    • South America
      • Brazil
      • Argentina
      • Colombia
    • Rest of World (ROW)

By Component Insights

The certificate type segment is estimated to witness significant growth during the forecast period.

The certificate authority market is segmented by certificate type, differentiated by the level of identity validation and intended use case.

This ranges from domain validation (dv) certificates, which provide basic encryption, to organization validation (ov) certificates that confirm a business's legal identity. At the highest tier, extended validation (ev) certificates require rigorous vetting, offering maximum assurance.

Beyond website security, the market includes critical products for securing software supply chains and enabling digital identity frameworks.

For example, the mandate requiring private keys for all new code signing certificates to be stored on hardware-compliant tokens enhances key security by over 99% compared to software-based storage.

This evolution underscores a market shifting from simple encryption to providing foundational trust for diverse digital interactions, including public key infrastructure (pki) and the transition to post-quantum cryptography.

Request Free Sample

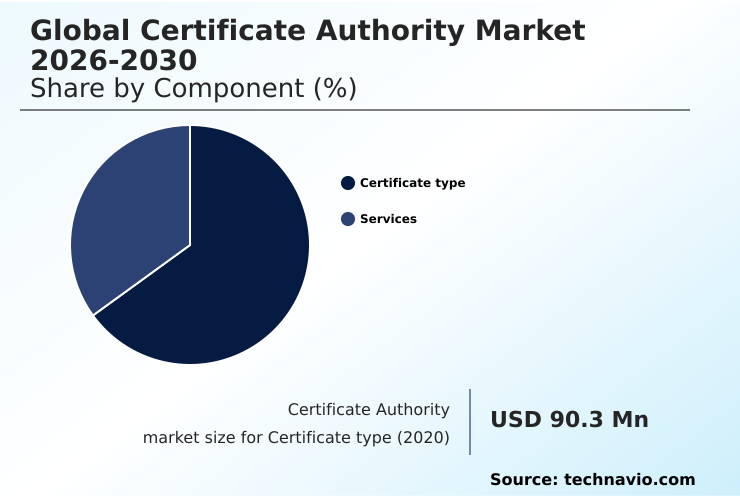
The Certificate type segment was valued at USD 127.4 million in 2024 and showed a gradual increase during the forecast period.

Request Free Sample

Regional Analysis

North America is estimated to contribute 33.6% to the growth of the global market during the forecast period.Technavio’s analysts have elaborately explained the regional trends and drivers that shape the market during the forecast period.

See How Certificate Authority Market Demand is Rising in North America Request Free Sample

The geographic landscape of the certificate authority market is diverse, with North America representing the largest market opportunity at approximately 34% due to its mature digital economy and high concentration of technology firms.

Europe's market is heavily influenced by stringent regulations like eIDAS and GDPR, which mandate high-assurance identity verification and create a strong demand for qualified trust services.

Meanwhile, the APAC region, accounting for over 28% of market opportunity, is the fastest-growing due to rapid digitalization, mobile-first economies, and evolving data protection legislation.

In South America, government mandates for e-invoicing using digital signatures have created a unique and substantial market foundation; these initiatives have been credited with reducing certain types of tax fraud by up to 15%.

This regional diversity requires providers to tailor their strategies, balancing global trust standards with local regulatory and compliance demands.

Market Dynamics

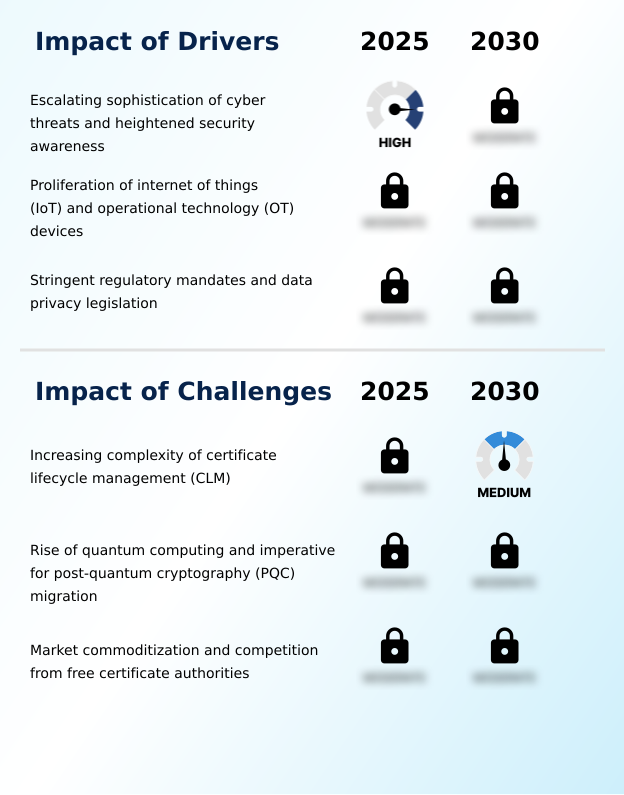
Our researchers analyzed the data with 2025 as the base year, along with the key drivers, trends, and challenges. A holistic analysis of drivers will help companies refine their marketing strategies to gain a competitive advantage.

  • Navigating the future of web pki and digital trust requires a strategic approach to several converging challenges. Enterprises are grappling with managing certificate sprawl in multi-cloud environments, a complexity that is magnified by the industry-wide impact of shorter certificate lifecycles. This reality makes automating pki for devops environments not just a best practice but an operational necessity.
  • Firms with mature automation strategies report certificate renewal times that are ten times faster than those relying on manual processes, directly impacting operational planning and risk mitigation. The scope of pki is also expanding far beyond websites.
  • Securing iot devices with digital certificates is now crucial for industries from manufacturing to healthcare, while specialized use cases like pki for electric vehicle charging infrastructure are creating new ecosystems of trust. Concurrently, the entire industry is focused on transitioning to post-quantum cryptography standards to counter future threats.
  • This involves a complex migration away from legacy systems and necessitates a focus on cryptographic agility. Understanding the security of code signing in ci/cd pipelines and managing the certificate management for iot devices are now boardroom-level conversations.
  • Enterprises must address certificate discovery in hybrid clouds and implement robust certificate revocation policies to maintain a secure and resilient posture against advanced threats.

What are the key market drivers leading to the rise in the adoption of Certificate Authority Industry?

  • The escalating sophistication of cyber threats, coupled with heightened security awareness among enterprises and consumers, serves as a primary driver for the market.

  • The market is propelled by the escalating sophistication of cyber threats and stringent regulatory mandates.
  • High-profile incidents like the moveit software vulnerability, which affected over 2,000 organizations, serve as stark reminders of the need for authenticated, encrypted communication channels at every data exchange point.
  • This hostile environment has elevated cybersecurity to a boardroom priority, driving sustained demand for transport layer security (tls) certificates as a foundational element of digital trust.
  • Furthermore, regulations like the gdpr in Europe and hipaa in the US, along with the sec's new cybersecurity disclosure rules, compel organizations to adopt strong encryption and authentication.
  • This compliance pressure directly fuels investment in public key infrastructure (pki) and high-assurance certificates, as failure to comply can result in severe financial penalties and reputational damage.

What are the market trends shaping the Certificate Authority Industry?

  • A defining market trend is the acceleration of certificate lifecycles toward shorter validity periods. This shift creates a compelling imperative for enterprises to adopt automated management solutions.

  • A transformative trend in the certificate authority market is the proactive industry-wide mobilization toward post-quantum cryptography (pqc). Driven by the threat from quantum computers, this shift is compelling organizations to adopt crypto-agility and plan for a complex, multi-year migration. This transition creates new revenue streams from specialized pqc certificates and advanced certificate lifecycle management (clm) tools.
  • Simultaneously, the diversification of use cases beyond traditional ssl/tls for websites is accelerating. The proliferation of iot devices, the need for secure software supply chains with robust code signing practices, and the development of digital identity frameworks like the eu's eidas 2.0 are creating massive new markets.
  • For instance, the matter smart home standard mandates a unique device attestation certificate for 100% of compliant products, creating predictable, high-volume demand.

What challenges does the Certificate Authority Industry face during its growth?

  • The increasing complexity of certificate lifecycle management (CLM) across hybrid and multi-cloud environments presents a significant challenge to the industry.

  • A formidable challenge is the increasing complexity of certificate lifecycle management (clm) as enterprises navigate hybrid, multi-cloud environments. The proliferation of certificates for web servers, apis, and iot devices leads to 'certificate sprawl,' a critical visibility gap that increases risk. Manual management is untenable, leading to service outages in over 50% of large enterprises annually.
  • This complexity is intensified by the commoditization of domain validation (dv) certificates, driven by free providers like lets encrypt, which now account for over 70% of active web certificates.
  • This forces commercial certificate authorities to differentiate through high-assurance certificates like organization validation (ov) and extended validation (ev) and by offering comprehensive, enterprise-grade trust management platforms that provide robust automation and solve the critical pain point of certificate sprawl.

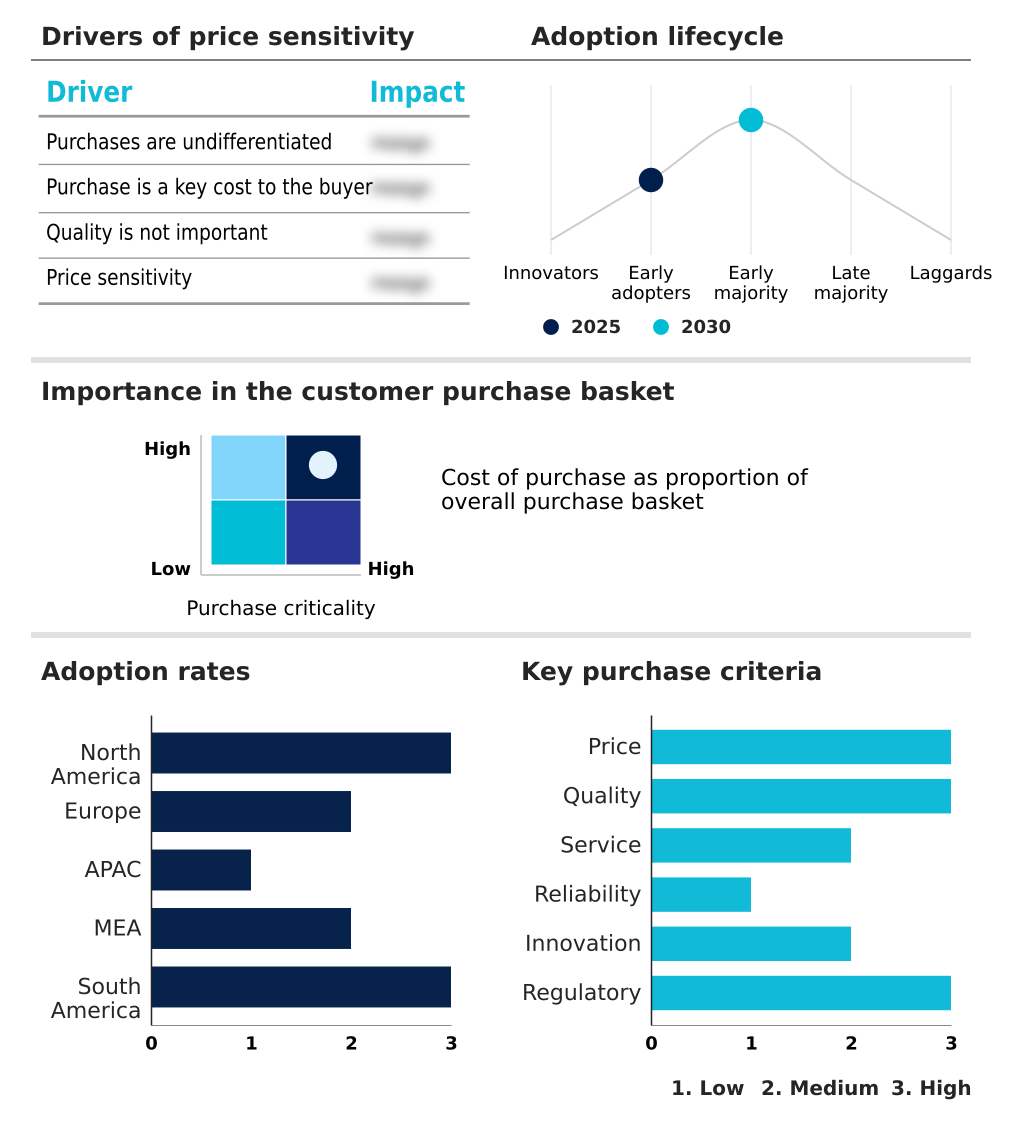
Exclusive Technavio Analysis on Customer Landscape

The certificate authority market forecasting report includes the adoption lifecycle of the market, covering from the innovator’s stage to the laggard’s stage. It focuses on adoption rates in different regions based on penetration. Furthermore, the certificate authority market report also includes key purchase criteria and drivers of price sensitivity to help companies evaluate and develop their market growth analysis strategies.

Customer Landscape of Certificate Authority Industry

Competitive Landscape

Companies are implementing various strategies, such as strategic alliances, certificate authority market forecast, partnerships, mergers and acquisitions, geographical expansion, and product/service launches, to enhance their presence in the industry.

AC Camerfirma SA - Provides digital certificates and legally compliant electronic signature solutions, enabling secure commercial and administrative transactions for businesses and public entities.

The industry research and growth report includes detailed analyses of the competitive landscape of the market and information about key companies, including:

  • AC Camerfirma SA
  • Alphabet Inc.
  • Amazon Web Services Inc.
  • Aruba Spa
  • Buypass AS
  • Cloudflare Inc.
  • DigiCert Inc.
  • D-Trust GmbH
  • Entrust Corp.
  • E-Tugra
  • GlobalSign Ltd.
  • GoDaddy Inc.
  • IdenTrust Inc.
  • Microsoft Corp.
  • Sectigo Ltd.
  • SSL.com
  • SwissSign AG

Qualitative and quantitative analysis of companies has been conducted to help clients understand the wider business environment as well as the strengths and weaknesses of key industry players. Data is qualitatively analyzed to categorize companies as pure play, category-focused, industry-focused, and diversified; it is quantitatively analyzed to categorize companies as dominant, leading, strong, tentative, and weak.

Recent Development and News in Certificate authority market

  • In August, 2024, the National Institute of Standards and Technology (NIST) finalizes its post-quantum cryptography (PQC) standards, initiating a multi-year migration cycle for enterprises to develop crypto-agility.
  • In November, 2024, QuantumSafe Inc. launched its 'Crypto-Agility Suite,' a platform designed to help organizations inventory cryptographic assets and automate the transition to PQC-ready hybrid certificates.
  • In February, 2025, AutoTrust Corp. announced a strategic partnership with a global automaker to deploy a large-scale public key infrastructure (PKI) for securing vehicle-to-everything (V2X) communications across its new vehicle lineup.
  • In May, 2025, the Connectivity Standards Alliance reported that the Matter smart home standard now requires all certified devices to include a device attestation certificate (DAC), significantly boosting demand for high-volume certificate issuance.

Dive into Technavio’s robust research methodology, blending expert interviews, extensive data synthesis, and validated models for unparalleled Certificate Authority Market insights. See full methodology.

Market Scope
Page number 315
Base year 2025
Historic period 2020-2024
Forecast period 2026-2030
Growth momentum & CAGR Accelerate at a CAGR of 13.9%
Market growth 2026-2030 USD 205.7 million
Market structure Fragmented
YoY growth 2025-2026(%) 13.3%
Key countries US, Canada, Mexico, Germany, UK, France, Italy, The Netherlands, Spain, China, India, Japan, Australia, South Korea, Indonesia, Saudi Arabia, UAE, South Africa, Israel, Turkey, Brazil, Argentina and Colombia
Competitive landscape Leading Companies, Market Positioning of Companies, Competitive Strategies, and Industry Risks

Request Free Sample

Research Analyst Overview

  • The certificate authority market is fundamental to digital trust, moving beyond simple website encryption to enable secure interactions across a vast digital ecosystem. This evolution is driven by the need for robust public key infrastructure (pki) and crypto-agility to address a complex threat landscape.
  • The market is defined by various validation levels, from domain validation and organization validation to the high-assurance extended validation, each serving different trust requirements. Key technologies like transport layer security (tls) and its predecessor, secure sockets layer (ssl), are foundational.
  • However, the growth is now in advanced use cases such as iot device certificates, secure email (s/mime), and legally binding document signing certificates. The entire ecosystem is preparing for the transition to post-quantum cryptography (pqc). This shift requires a strategic focus on cryptographic agility and a move toward hybrid certificate models.
  • A critical boardroom focus is the imperative for automated certificate lifecycle management (clm). Enterprises with centralized clm platforms have demonstrated a 40% improvement in compliance reporting accuracy, a vital metric in an era of stringent regulations and zero trust architecture. This trend underscores the shift from discrete certificate purchases to integrated trust management.

What are the Key Data Covered in this Certificate Authority Market Research and Growth Report?

  • What is the expected growth of the Certificate Authority Market between 2026 and 2030?

    • USD 205.7 million, at a CAGR of 13.9%

  • What segmentation does the market report cover?

    • The report is segmented by Component (Certificate type, and Services), Organization Size (SMEs, and Large enterprises), Type (Domain validation, Organization validation, and Extended validation) and Geography (North America, Europe, APAC, Middle East and Africa, South America)

  • Which regions are analyzed in the report?

    • North America, Europe, APAC, Middle East and Africa and South America

  • What are the key growth drivers and market challenges?

    • Escalating sophistication of cyber threats and heightened security awareness, Increasing complexity of certificate lifecycle management (CLM)

  • Who are the major players in the Certificate Authority Market?

    • AC Camerfirma SA, Alphabet Inc., Amazon Web Services Inc., Aruba Spa, Buypass AS, Cloudflare Inc., DigiCert Inc., D-Trust GmbH, Entrust Corp., E-Tugra, GlobalSign Ltd., GoDaddy Inc., IdenTrust Inc., Microsoft Corp., Sectigo Ltd., SSL.com and SwissSign AG

Market Research Insights

  • The certificate authority market is shaped by dynamic security and operational demands. The adoption of automated certificate management is critical, as it can reduce certificate-related service outages by up to 90%, bolstering operational resilience. This shift is driven by the move to shorter lifecycles and the complexity of hybrid cloud deployments.
  • The foundational security provided by a secure sockets layer (ssl) is now table stakes, with enterprises focusing on higher-assurance credentials and managing certificate sprawl. Implementing strong authentication methods beyond basic certificates, such as those used in a zero trust model, can decrease the success rate of phishing attacks by over 75%.
  • As organizations adopt DevOps, the integration of public key infrastructure into developer workflows is becoming standard, ensuring security is built-in rather than applied as an afterthought, thus improving both security posture and development velocity.

We can help! Our analysts can customize this certificate authority market research report to meet your requirements.

Get in touch

1. Executive Summary

1.1 Market overview

Executive Summary - Chart on Market Overview
Executive Summary - Data Table on Market Overview
Executive Summary - Chart on Global Market Characteristics
Executive Summary - Chart on Market by Geography
Executive Summary - Chart on Market Segmentation by Component
Executive Summary - Chart on Market Segmentation by Organization Size
Executive Summary - Chart on Market Segmentation by Type
Executive Summary - Chart on Incremental Growth
Executive Summary - Data Table on Incremental Growth
Executive Summary - Chart on Company Market Positioning

2. Technavio Analysis

2.1 Analysis of price sensitivity, lifecycle, customer purchase basket, adoption rates, and purchase criteria

2.2 Criticality of inputs and Factors of differentiation

Chart on Overview on criticality of inputs and factors of differentiation

2.3 Factors of disruption

Chart on Overview on factors of disruption

2.4 Impact of drivers and challenges

Chart on Impact of drivers and challenges in 2025 and 2030

3. Market Landscape

3.1 Market ecosystem

Chart on Parent Market
Data Table on - Parent Market

3.2 Market characteristics

Chart on Market characteristics analysis

3.3 Value chain analysis

Chart on Value chain analysis

4. Market Sizing

4.1 Market definition

Data Table on Offerings of companies included in the market definition

4.2 Market segment analysis

Market segments

4.3 Market size 2025

4.4 Market outlook: Forecast for 2025-2030

Chart on Global - Market size and forecast 2025-2030 ($ million)
Data Table on Global - Market size and forecast 2025-2030 ($ million)
Chart on Global Market: Year-over-year growth 2025-2030 (%)
Data Table on Global Market: Year-over-year growth 2025-2030 (%)

5. Historic Market Size

5.1 Global Certificate Authority Market 2020 - 2024

Historic Market Size - Data Table on Global Certificate Authority Market 2020 - 2024 ($ million)

5.2 Component segment analysis 2020 - 2024

Historic Market Size - Component Segment 2020 - 2024 ($ million)

5.3 Organization Size segment analysis 2020 - 2024

Historic Market Size - Organization Size Segment 2020 - 2024 ($ million)

5.4 Type segment analysis 2020 - 2024

Historic Market Size - Type Segment 2020 - 2024 ($ million)

5.5 Geography segment analysis 2020 - 2024

Historic Market Size - Geography Segment 2020 - 2024 ($ million)

5.6 Country segment analysis 2020 - 2024

Historic Market Size - Country Segment 2020 - 2024 ($ million)

6. Qualitative Analysis

6.1 Impact of AI on the Global Certificate Authority Market

7. Five Forces Analysis

7.1 Five forces summary

Five forces analysis - Comparison between 2025 and 2030

7.2 Bargaining power of buyers

Bargaining power of buyers - Impact of key factors 2025 and 2030

7.3 Bargaining power of suppliers

Bargaining power of suppliers - Impact of key factors in 2025 and 2030

7.4 Threat of new entrants

Threat of new entrants - Impact of key factors in 2025 and 2030

7.5 Threat of substitutes

Threat of substitutes - Impact of key factors in 2025 and 2030

7.6 Threat of rivalry

Threat of rivalry - Impact of key factors in 2025 and 2030

7.7 Market condition

Chart on Market condition - Five forces 2025 and 2030

8. Market Segmentation by Component

8.1 Market segments

Chart on Component - Market share 2025-2030 (%)
Data Table on Component - Market share 2025-2030 (%)

8.2 Comparison by Component

Chart on Comparison by Component
Data Table on Comparison by Component

8.3 Certificate type - Market size and forecast 2025-2030

Chart on Certificate type - Market size and forecast 2025-2030 ($ million)
Data Table on Certificate type - Market size and forecast 2025-2030 ($ million)
Chart on Certificate type - Year-over-year growth 2025-2030 (%)
Data Table on Certificate type - Year-over-year growth 2025-2030 (%)

8.4 Services - Market size and forecast 2025-2030

Chart on Services - Market size and forecast 2025-2030 ($ million)
Data Table on Services - Market size and forecast 2025-2030 ($ million)
Chart on Services - Year-over-year growth 2025-2030 (%)
Data Table on Services - Year-over-year growth 2025-2030 (%)

8.5 Market opportunity by Component

Market opportunity by Component ($ million)
Data Table on Market opportunity by Component ($ million)

9. Market Segmentation by Organization Size

9.1 Market segments

Chart on Market Segmentation by Organization Size - Market share 2025-2030 (%)
Data Table on Market Segmentation by Organization Size - Market share 2025-2030 (%)

9.2 Comparison by Market Segmentation by Organization Size

Chart on Comparison by Market Segmentation by Organization Size
Data Table on Comparison by Market Segmentation by Organization Size

9.3 SMEs - Market size and forecast 2025-2030

Chart on SMEs - Market size and forecast 2025-2030 ($ million)
Data Table on SMEs - Market size and forecast 2025-2030 ($ million)
Chart on SMEs - Year-over-year growth 2025-2030 (%)
Data Table on SMEs - Year-over-year growth 2025-2030 (%)

9.4 Large enterprises - Market size and forecast 2025-2030

Chart on Large enterprises - Market size and forecast 2025-2030 ($ million)
Data Table on Large enterprises - Market size and forecast 2025-2030 ($ million)
Chart on Large enterprises - Year-over-year growth 2025-2030 (%)
Data Table on Large enterprises - Year-over-year growth 2025-2030 (%)

9.5 Market opportunity by Market Segmentation by Organization Size

Market opportunity by Market Segmentation by Organization Size ($ million)
Data Table on Market opportunity by Market Segmentation by Organization Size ($ million)

10. Market Segmentation by Type

10.1 Market segments

Chart on Type - Market share 2025-2030 (%)
Data Table on Type - Market share 2025-2030 (%)

10.2 Comparison by Type

Chart on Comparison by Type
Data Table on Comparison by Type

10.3 Domain validation - Market size and forecast 2025-2030

Chart on Domain validation - Market size and forecast 2025-2030 ($ million)
Data Table on Domain validation - Market size and forecast 2025-2030 ($ million)
Chart on Domain validation - Year-over-year growth 2025-2030 (%)
Data Table on Domain validation - Year-over-year growth 2025-2030 (%)

10.4 Organization validation - Market size and forecast 2025-2030

Chart on Organization validation - Market size and forecast 2025-2030 ($ million)
Data Table on Organization validation - Market size and forecast 2025-2030 ($ million)
Chart on Organization validation - Year-over-year growth 2025-2030 (%)
Data Table on Organization validation - Year-over-year growth 2025-2030 (%)

10.5 Extended validation - Market size and forecast 2025-2030

Chart on Extended validation - Market size and forecast 2025-2030 ($ million)
Data Table on Extended validation - Market size and forecast 2025-2030 ($ million)
Chart on Extended validation - Year-over-year growth 2025-2030 (%)
Data Table on Extended validation - Year-over-year growth 2025-2030 (%)

10.6 Market opportunity by Type

Market opportunity by Type ($ million)
Data Table on Market opportunity by Type ($ million)

11. Customer Landscape

11.1 Customer landscape overview

Analysis of price sensitivity, lifecycle, customer purchase basket, adoption rates, and purchase criteria

12. Geographic Landscape

12.1 Geographic segmentation

Chart on Market share by geography 2025-2030 (%)
Data Table on Market share by geography 2025-2030 (%)

12.2 Geographic comparison

Chart on Geographic comparison
Data Table on Geographic comparison

12.3 North America - Market size and forecast 2025-2030

Chart on North America - Market size and forecast 2025-2030 ($ million)
Data Table on North America - Market size and forecast 2025-2030 ($ million)
Chart on North America - Year-over-year growth 2025-2030 (%)
Data Table on North America - Year-over-year growth 2025-2030 (%)
Chart on Regional Comparison - North America
Data Table on Regional Comparison - North America

12.3.1 US - Market size and forecast 2025-2030

Chart on US - Market size and forecast 2025-2030 ($ million)
Data Table on US - Market size and forecast 2025-2030 ($ million)
Chart on US - Year-over-year growth 2025-2030 (%)
Data Table on US - Year-over-year growth 2025-2030 (%)

12.3.2 Canada - Market size and forecast 2025-2030

Chart on Canada - Market size and forecast 2025-2030 ($ million)
Data Table on Canada - Market size and forecast 2025-2030 ($ million)
Chart on Canada - Year-over-year growth 2025-2030 (%)
Data Table on Canada - Year-over-year growth 2025-2030 (%)

12.3.3 Mexico - Market size and forecast 2025-2030

Chart on Mexico - Market size and forecast 2025-2030 ($ million)
Data Table on Mexico - Market size and forecast 2025-2030 ($ million)
Chart on Mexico - Year-over-year growth 2025-2030 (%)
Data Table on Mexico - Year-over-year growth 2025-2030 (%)

12.4 Europe - Market size and forecast 2025-2030

Chart on Europe - Market size and forecast 2025-2030 ($ million)
Data Table on Europe - Market size and forecast 2025-2030 ($ million)
Chart on Europe - Year-over-year growth 2025-2030 (%)
Data Table on Europe - Year-over-year growth 2025-2030 (%)
Chart on Regional Comparison - Europe
Data Table on Regional Comparison - Europe

12.4.1 Germany - Market size and forecast 2025-2030

Chart on Germany - Market size and forecast 2025-2030 ($ million)
Data Table on Germany - Market size and forecast 2025-2030 ($ million)
Chart on Germany - Year-over-year growth 2025-2030 (%)
Data Table on Germany - Year-over-year growth 2025-2030 (%)

12.4.2 UK - Market size and forecast 2025-2030

Chart on UK - Market size and forecast 2025-2030 ($ million)
Data Table on UK - Market size and forecast 2025-2030 ($ million)
Chart on UK - Year-over-year growth 2025-2030 (%)
Data Table on UK - Year-over-year growth 2025-2030 (%)

12.4.3 France - Market size and forecast 2025-2030

Chart on France - Market size and forecast 2025-2030 ($ million)
Data Table on France - Market size and forecast 2025-2030 ($ million)
Chart on France - Year-over-year growth 2025-2030 (%)
Data Table on France - Year-over-year growth 2025-2030 (%)

12.4.4 Italy - Market size and forecast 2025-2030

Chart on Italy - Market size and forecast 2025-2030 ($ million)
Data Table on Italy - Market size and forecast 2025-2030 ($ million)
Chart on Italy - Year-over-year growth 2025-2030 (%)
Data Table on Italy - Year-over-year growth 2025-2030 (%)

12.4.5 The Netherlands - Market size and forecast 2025-2030

Chart on The Netherlands - Market size and forecast 2025-2030 ($ million)
Data Table on The Netherlands - Market size and forecast 2025-2030 ($ million)
Chart on The Netherlands - Year-over-year growth 2025-2030 (%)
Data Table on The Netherlands - Year-over-year growth 2025-2030 (%)

12.4.6 Spain - Market size and forecast 2025-2030

Chart on Spain - Market size and forecast 2025-2030 ($ million)
Data Table on Spain - Market size and forecast 2025-2030 ($ million)
Chart on Spain - Year-over-year growth 2025-2030 (%)
Data Table on Spain - Year-over-year growth 2025-2030 (%)

12.5 APAC - Market size and forecast 2025-2030

Chart on APAC - Market size and forecast 2025-2030 ($ million)
Data Table on APAC - Market size and forecast 2025-2030 ($ million)
Chart on APAC - Year-over-year growth 2025-2030 (%)
Data Table on APAC - Year-over-year growth 2025-2030 (%)
Chart on Regional Comparison - APAC
Data Table on Regional Comparison - APAC

12.5.1 China - Market size and forecast 2025-2030

Chart on China - Market size and forecast 2025-2030 ($ million)
Data Table on China - Market size and forecast 2025-2030 ($ million)
Chart on China - Year-over-year growth 2025-2030 (%)
Data Table on China - Year-over-year growth 2025-2030 (%)

12.5.2 India - Market size and forecast 2025-2030

Chart on India - Market size and forecast 2025-2030 ($ million)
Data Table on India - Market size and forecast 2025-2030 ($ million)
Chart on India - Year-over-year growth 2025-2030 (%)
Data Table on India - Year-over-year growth 2025-2030 (%)

12.5.3 Japan - Market size and forecast 2025-2030

Chart on Japan - Market size and forecast 2025-2030 ($ million)
Data Table on Japan - Market size and forecast 2025-2030 ($ million)
Chart on Japan - Year-over-year growth 2025-2030 (%)
Data Table on Japan - Year-over-year growth 2025-2030 (%)

12.5.4 Australia - Market size and forecast 2025-2030

Chart on Australia - Market size and forecast 2025-2030 ($ million)
Data Table on Australia - Market size and forecast 2025-2030 ($ million)
Chart on Australia - Year-over-year growth 2025-2030 (%)
Data Table on Australia - Year-over-year growth 2025-2030 (%)

12.5.5 South Korea - Market size and forecast 2025-2030

Chart on South Korea - Market size and forecast 2025-2030 ($ million)
Data Table on South Korea - Market size and forecast 2025-2030 ($ million)
Chart on South Korea - Year-over-year growth 2025-2030 (%)
Data Table on South Korea - Year-over-year growth 2025-2030 (%)

12.5.6 Indonesia - Market size and forecast 2025-2030

Chart on Indonesia - Market size and forecast 2025-2030 ($ million)
Data Table on Indonesia - Market size and forecast 2025-2030 ($ million)
Chart on Indonesia - Year-over-year growth 2025-2030 (%)
Data Table on Indonesia - Year-over-year growth 2025-2030 (%)

12.6 Middle East and Africa - Market size and forecast 2025-2030

Chart on Middle East and Africa - Market size and forecast 2025-2030 ($ million)
Data Table on Middle East and Africa - Market size and forecast 2025-2030 ($ million)
Chart on Middle East and Africa - Year-over-year growth 2025-2030 (%)
Data Table on Middle East and Africa - Year-over-year growth 2025-2030 (%)
Chart on Regional Comparison - Middle East and Africa
Data Table on Regional Comparison - Middle East and Africa

12.6.1 Saudi Arabia - Market size and forecast 2025-2030

Chart on Saudi Arabia - Market size and forecast 2025-2030 ($ million)
Data Table on Saudi Arabia - Market size and forecast 2025-2030 ($ million)
Chart on Saudi Arabia - Year-over-year growth 2025-2030 (%)
Data Table on Saudi Arabia - Year-over-year growth 2025-2030 (%)

12.6.2 UAE - Market size and forecast 2025-2030

Chart on UAE - Market size and forecast 2025-2030 ($ million)
Data Table on UAE - Market size and forecast 2025-2030 ($ million)
Chart on UAE - Year-over-year growth 2025-2030 (%)
Data Table on UAE - Year-over-year growth 2025-2030 (%)

12.6.3 South Africa - Market size and forecast 2025-2030

Chart on South Africa - Market size and forecast 2025-2030 ($ million)
Data Table on South Africa - Market size and forecast 2025-2030 ($ million)
Chart on South Africa - Year-over-year growth 2025-2030 (%)
Data Table on South Africa - Year-over-year growth 2025-2030 (%)

12.6.4 Israel - Market size and forecast 2025-2030

Chart on Israel - Market size and forecast 2025-2030 ($ million)
Data Table on Israel - Market size and forecast 2025-2030 ($ million)
Chart on Israel - Year-over-year growth 2025-2030 (%)
Data Table on Israel - Year-over-year growth 2025-2030 (%)

12.6.5 Turkey - Market size and forecast 2025-2030

Chart on Turkey - Market size and forecast 2025-2030 ($ million)
Data Table on Turkey - Market size and forecast 2025-2030 ($ million)
Chart on Turkey - Year-over-year growth 2025-2030 (%)
Data Table on Turkey - Year-over-year growth 2025-2030 (%)

12.7 South America - Market size and forecast 2025-2030

Chart on South America - Market size and forecast 2025-2030 ($ million)
Data Table on South America - Market size and forecast 2025-2030 ($ million)
Chart on South America - Year-over-year growth 2025-2030 (%)
Data Table on South America - Year-over-year growth 2025-2030 (%)
Chart on Regional Comparison - South America
Data Table on Regional Comparison - South America

12.7.1 Brazil - Market size and forecast 2025-2030

Chart on Brazil - Market size and forecast 2025-2030 ($ million)
Data Table on Brazil - Market size and forecast 2025-2030 ($ million)
Chart on Brazil - Year-over-year growth 2025-2030 (%)
Data Table on Brazil - Year-over-year growth 2025-2030 (%)

12.7.2 Argentina - Market size and forecast 2025-2030

Chart on Argentina - Market size and forecast 2025-2030 ($ million)
Data Table on Argentina - Market size and forecast 2025-2030 ($ million)
Chart on Argentina - Year-over-year growth 2025-2030 (%)
Data Table on Argentina - Year-over-year growth 2025-2030 (%)

12.7.3 Colombia - Market size and forecast 2025-2030

Chart on Colombia - Market size and forecast 2025-2030 ($ million)
Data Table on Colombia - Market size and forecast 2025-2030 ($ million)
Chart on Colombia - Year-over-year growth 2025-2030 (%)
Data Table on Colombia - Year-over-year growth 2025-2030 (%)

12.8 Market opportunity by geography

Market opportunity by geography ($ million)
Data Tables on Market opportunity by geography ($ million)

13. Drivers, Challenges, and Opportunity

13.1 Market drivers

Escalating sophistication of cyber threats and heightened security awareness
Proliferation of internet of things (IoT) and operational technology (OT) devices
Stringent regulatory mandates and data privacy legislation

13.2 Market challenges

Increasing complexity of certificate lifecycle management (CLM)
Rise of quantum computing and imperative for post-quantum cryptography (PQC) migration
Market commoditization and competition from free certificate authorities

13.3 Impact of drivers and challenges

Impact of drivers and challenges in 2025 and 2030

13.4 Market opportunities

Accelerated certificate lifecycles and imperative for automation
Proactive transition to post-quantum cryptography
Diversification of certificate use cases into IoT, code signing, and digital identity ecosystems

14. Competitive Landscape

14.1 Overview

14.2

Overview on criticality of inputs and factors of differentiation

14.3 Landscape disruption

Overview on factors of disruption

14.4 Industry risks

Impact of key risks on business

15. Competitive Analysis

15.1 Companies profiled

Companies covered

15.2 Company ranking index

15.3 Market positioning of companies

Matrix on companies position and classification

15.4 AC Camerfirma SA

AC Camerfirma SA - Overview
AC Camerfirma SA - Product / Service
AC Camerfirma SA - Key offerings
SWOT

15.5 Alphabet Inc.

Alphabet Inc. - Overview
Alphabet Inc. - Business segments
Alphabet Inc. - Key offerings
Alphabet Inc. - Segment focus
SWOT

15.6 Amazon Web Services Inc.

Amazon Web Services Inc. - Overview
Amazon Web Services Inc. - Product / Service
Amazon Web Services Inc. - Key news
Amazon Web Services Inc. - Key offerings
SWOT

15.7 Aruba Spa

Aruba Spa - Overview
Aruba Spa - Product / Service
Aruba Spa - Key offerings
SWOT

15.8 Buypass AS

Buypass AS - Overview
Buypass AS - Product / Service
Buypass AS - Key offerings
SWOT

15.9 Cloudflare Inc.

Cloudflare Inc. - Overview
Cloudflare Inc. - Product / Service
Cloudflare Inc. - Key news
Cloudflare Inc. - Key offerings
SWOT

15.10 DigiCert Inc.

DigiCert Inc. - Overview
DigiCert Inc. - Product / Service
DigiCert Inc. - Key offerings
SWOT

15.11 D-Trust GmbH

D-Trust GmbH - Overview
D-Trust GmbH - Product / Service
D-Trust GmbH - Key offerings
SWOT

15.12 Entrust Corp.

Entrust Corp. - Overview
Entrust Corp. - Product / Service
Entrust Corp. - Key news
Entrust Corp. - Key offerings
SWOT

15.13 GlobalSign Ltd.

GlobalSign Ltd. - Overview
GlobalSign Ltd. - Product / Service
GlobalSign Ltd. - Key offerings
SWOT

15.14 GoDaddy Inc.

GoDaddy Inc. - Overview
GoDaddy Inc. - Business segments
GoDaddy Inc. - Key news
GoDaddy Inc. - Key offerings
GoDaddy Inc. - Segment focus
SWOT

15.15 IdenTrust Inc.

IdenTrust Inc. - Overview
IdenTrust Inc. - Product / Service
IdenTrust Inc. - Key offerings
SWOT

15.16 Sectigo Ltd.

Sectigo Ltd. - Overview
Sectigo Ltd. - Product / Service
Sectigo Ltd. - Key offerings
SWOT

15.17 SSL.com

SSL.com - Overview
SSL.com - Product / Service
SSL.com - Key offerings
SWOT

15.18 SwissSign AG

SwissSign AG - Overview
SwissSign AG - Product / Service
SwissSign AG - Key offerings
SWOT

16. Appendix

16.1 Scope of the report

Market definition
Objectives
Notes and caveats

16.2 Inclusions and exclusions checklist

Inclusions checklist
Exclusions checklist

16.3 Currency conversion rates for US$

16.4 Research methodology

16.5 Data procurement

Information sources

16.6 Data validation

16.7 Validation techniques employed for market sizing

16.8 Data synthesis

16.9 360 degree market analysis

16.10 List of abbreviations

Research Methodology

Technavio presents a detailed picture of the market by way of study, synthesis, and summation of data from multiple sources. The analysts have presented the various facets of the market with a particular focus on identifying the key industry influencers. The data thus presented is comprehensive, reliable, and the result of extensive research, both primary and secondary.

INFORMATION SOURCES

Primary sources

  • Manufacturers and suppliers
  • Channel partners
  • Industry experts
  • Strategic decision makers

Secondary sources

  • Industry journals and periodicals
  • Government data
  • Financial reports of key industry players
  • Historical data
  • Press releases

DATA ANALYSIS

Data Synthesis

  • Collation of data
  • Estimation of key figures
  • Analysis of derived insights

Data Validation

  • Triangulation with data models
  • Reference against proprietary databases
  • Corroboration with industry experts

REPORT WRITING

Qualitative

  • Market drivers
  • Market challenges
  • Market trends
  • Five forces analysis

Quantitative

  • Market size and forecast
  • Market segmentation
  • Geographical insights
  • Competitive landscape

Interested in this report?

Get your sample now to see our research methodology and insights!

Download Now

Frequently Asked Questions

Certificate Authority market growth will increase by USD 205.7 million during 2026-2030 .

The Certificate Authority market is expected to grow at a CAGR of 13.9% during 2026-2030 .

Certificate Authority market is segmented by Component (Certificate type, Services) Organization size (SMEs, Large enterprises) Type (Domain validation, Organization validation, Extended validation)

AC Camerfirma SA, Alphabet Inc., Amazon Web Services Inc., Aruba Spa, Buypass AS, Cloudflare Inc., DigiCert Inc., D-Trust GmbH, Entrust Corp., E-Tugra, GlobalSign Ltd., GoDaddy Inc., IdenTrust Inc., Microsoft Corp., Sectigo Ltd., SSL.com, SwissSign AG are a few of the key vendors in the Certificate Authority market.

North America will register the highest growth rate of 33.6% among the other regions. Therefore, the Certificate Authority market in North America is expected to garner significant business opportunities for the vendors during the forecast period.

US, Canada, Mexico, Germany, UK, France, Italy, The Netherlands, Spain, China, India, Japan, Australia, South Korea, Indonesia, Saudi Arabia, UAE, South Africa, Israel, Turkey, Brazil, Argentina, Colombia

  • Escalating sophistication of cyber threats and heightened security awareness is the driving factor this market.

The Certificate Authority market vendors should focus on grabbing business opportunities from the Component segment as it accounted for the largest market share in the base year.