Chatbot Market Analysis, Size, and Forecast 2026-2030: North America (US, Canada, and Mexico), APAC (China, Japan, and India), Europe (Germany, UK, and France), South America (Brazil and Argentina), Middle East and Africa (Saudi Arabia, UAE, and South Africa), and Rest of World (ROW)

Chatbot Market Analysis, Size, and Forecast 2026-2030:
North America (US, Canada, and Mexico), APAC (China, Japan, and India), Europe (Germany, UK, and France), South America (Brazil and Argentina), Middle East and Africa (Saudi Arabia, UAE, and South Africa), and Rest of World (ROW)

Published: Mar 2026 305 Pages SKU: IRTNTR41045

Market Overview at a Glance

$20.33 B
Market Opportunity
55.1%
CAGR 2025 - 2030
39%
North America Growth
$574.7 Mn
Retail segment 2024

Chatbot Market Size 2026-2030

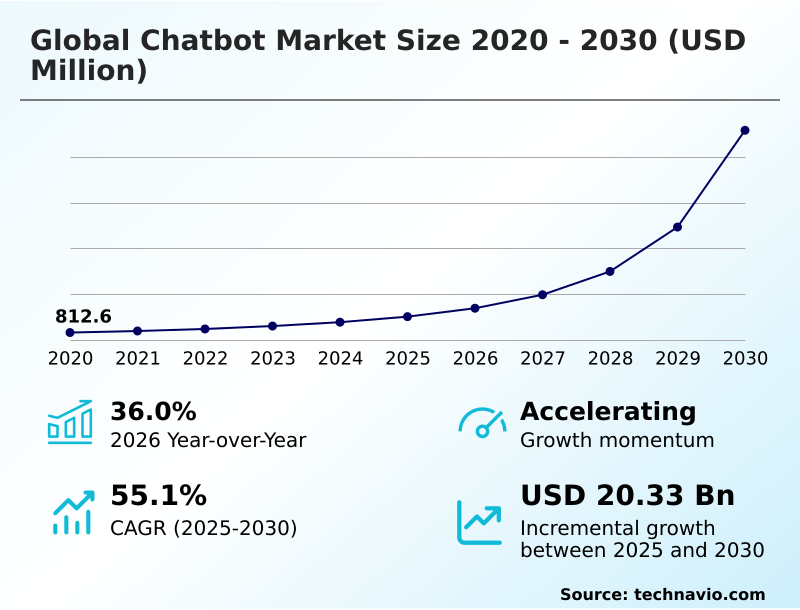
The chatbot market size is valued to increase by USD 20.33 billion, at a CAGR of 55.1% from 2025 to 2030. Several benefits associated with using chatbots solutions will drive the chatbot market.

Major Market Trends & Insights

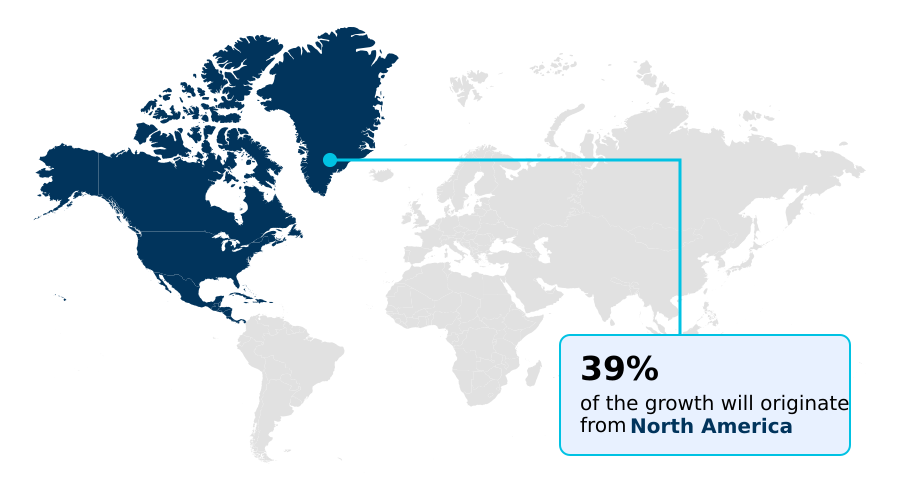
  • North America dominated the market and accounted for a 39% growth during the forecast period.
  • By End-user - Retail segment was valued at USD 574.7 million in 2024
  • By Product - Solutions segment accounted for the largest market revenue share in 2024

Market Size & Forecast

  • Market Opportunities: USD 22.06 billion
  • Market Future Opportunities: USD 20.33 billion
  • CAGR from 2025 to 2030 : 55.1%

Market Summary

  • The chatbot market has evolved from simple automated responders to highly sophisticated agentic systems, powered by advancements in generative artificial intelligence and natural language processing. This transformation is driven by enterprise demand for greater efficiency in customer service automation and lead generation.
  • The integration of large language models enables complex, multimodal interactions, allowing for nuanced, multi-turn dialogues that were previously impossible. In a typical business scenario, a financial services firm can deploy an AI-driven platform for secure biometric authentication and automated debt collections, significantly improving workflow automation while ensuring regulatory compliance.
  • Such autonomous task execution capabilities are becoming standard, with modern systems leveraging retrieval augmented generation to access verified knowledge bases, ensuring both accuracy and contextual understanding. This move toward intelligent automation is redefining operational standards and creating new opportunities for businesses to enhance engagement.
  • The focus on CRM integration and sentiment analysis further amplifies the value of these tools, making them central to modern enterprise strategy.

What will be the Size of the Chatbot Market during the forecast period?

Get Key Insights on Market Forecast (PDF) Request Free Sample

How is the Chatbot Market Segmented?

The chatbot industry research report provides comprehensive data (region-wise segment analysis), with forecasts and estimates in "USD million" for the period 2026-2030, as well as historical data from 2020-2024 for the following segments.

  • End-user
    • Retail
    • BFSI
    • Travel and hospitality
    • Government
    • Others
  • Product
    • Solutions
    • Services
  • Type
    • Standalone
    • Web-based
    • Messenger-based or third party
  • Geography
    • North America
      • US
      • Canada
      • Mexico
    • APAC
      • China
      • Japan
      • India
    • Europe
      • Germany
      • UK
      • France
    • South America
      • Brazil
      • Argentina
    • Middle East and Africa
      • Saudi Arabia
      • UAE
      • South Africa
    • Rest of World (ROW)

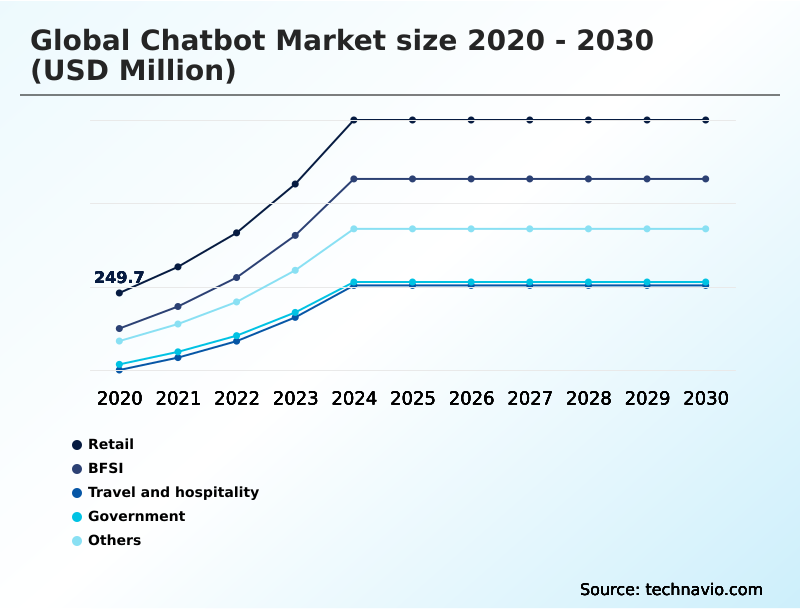
By End-user Insights

The retail segment is estimated to witness significant growth during the forecast period.

The retail segment is a primary adopter of advanced conversational AI, shifting from basic query-response systems to sophisticated conversational commerce engines.

These platforms now manage the entire sales funnel, enabling real-time inventory checks, personalized product discovery, and automated returns processing using natural language understanding.

Retailers are implementing agentic systems to autonomously handle multi-step tasks like coordinating with logistics providers, which has become a key differentiator.

The integration of generative artificial intelligence allows for unique marketing copy and styling advice, with some platforms capturing approximately 28% of total market revenue through these enhanced capabilities.

This strategic shift uses ai-powered lead qualification not just for cost-cutting but as a core tool for driving customer retention and providing a proactive self service experience.

Request Free Sample

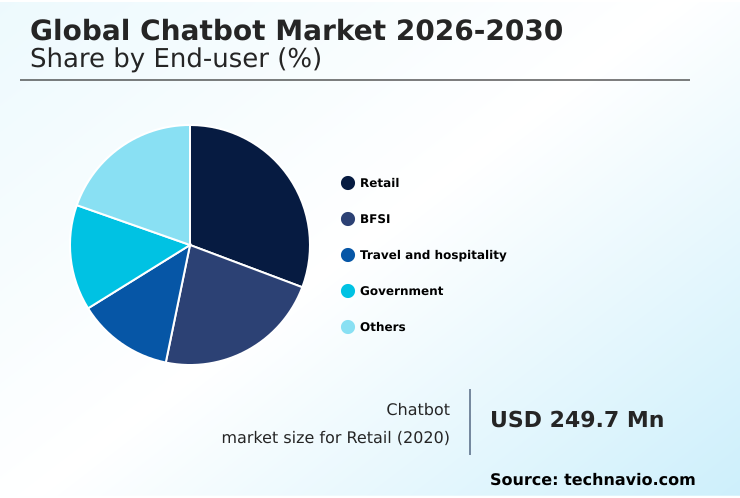
The Retail segment was valued at USD 574.7 million in 2024 and showed a gradual increase during the forecast period.

Request Free Sample

Regional Analysis

North America is estimated to contribute 39% to the growth of the global market during the forecast period.Technavio’s analysts have elaborately explained the regional trends and drivers that shape the market during the forecast period.

See How Chatbot Market Demand is Rising in North America Request Free Sample

The geographic landscape of the chatbot market is led by North America, which accounts for approximately 39% of the incremental growth, driven by a mature ecosystem of cloud providers and a high rate of enterprise AI assistant adoption.

In this region, over 60% of businesses are already utilizing or planning to implement automated chat solutions.

Meanwhile, the APAC region is the fastest-growing market, fueled by mobile-first consumer behavior and a strong demand for multilingual chatbot support for public sector services.

Europe is focusing on deploying secure, compliant AI chatbot for financial services, with Germany leading in industrial applications.

The development of voice-enabled chatbots and AI agent workflow tools is a global phenomenon, with each region adapting these technologies to meet local needs for customer support automation and enterprise efficiency.

Market Dynamics

Our researchers analyzed the data with 2025 as the base year, along with the key drivers, trends, and challenges. A holistic analysis of drivers will help companies refine their marketing strategies to gain a competitive advantage.

  • The future of conversational ai in business hinges on understanding the tangible benefits of using chatbots for crm and how to effectively measure chatbot performance and roi. As companies move beyond basic deployments, integrating chatbots with messaging apps has become standard practice, though the challenges of chatbot knowledge base integration remain a significant hurdle.
  • The impact of generative ai on chatbots is profound, enabling sophisticated applications like chatbot for automated financial advice and enhancing the capabilities of using ai chatbots for internal support. Best practices for chatbot development now emphasize creating secure enterprise chatbots, especially in regulated sectors.
  • The role of chatbots in healthcare and their deployment in travel and hospitality highlight the industry's vertical expansion. A key market trend is the clear link between strategic implementation and financial outcomes; for instance, cost reduction with customer service chatbots is often twice as effective in organizations that actively track engagement metrics versus those that do not.
  • Differentiating chatbot offerings in the market now depends less on features and more on proven value, particularly in areas like using chatbots for lead generation, where quality and conversion are paramount.

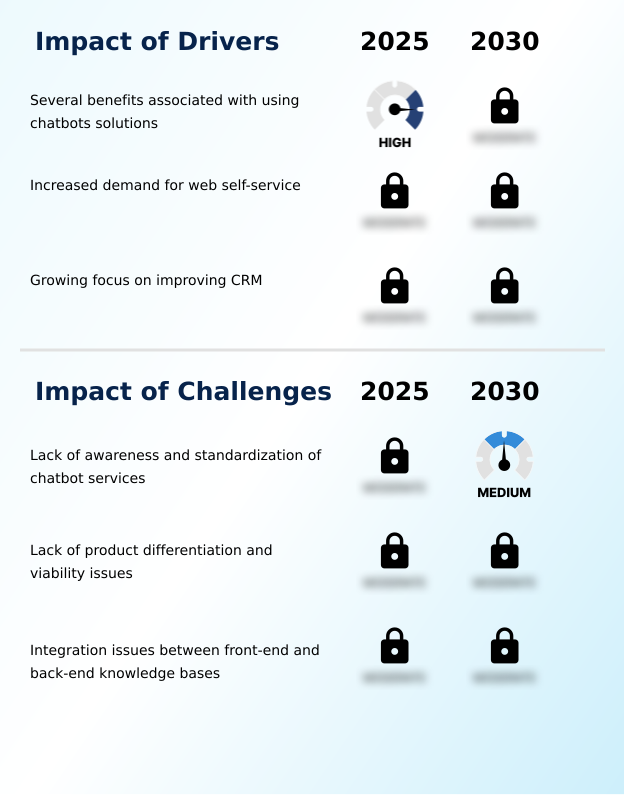
What are the key market drivers leading to the rise in the adoption of Chatbot Industry?

  • The numerous operational and strategic benefits associated with chatbot solutions are a significant driver of market adoption.

  • Market growth is primarily driven by the need for customer support automation and the clear financial benefits it delivers. By implementing an AI-driven platform, businesses are reducing operational costs by up to 30% while simultaneously improving service quality.
  • The focus on enhancing CRM is another significant factor, as chatbot analytics and metrics provide deep insights into customer behavior.
  • For example, using AI-powered lead qualification not only accelerates sales cycles but also improves data hygiene, leading to productivity gains of over 12% in marketing and sales teams.
  • The demand for enterprise chatbot solutions is also fueled by their ability to provide consistent, 24/7 support, which has become a baseline expectation for modern consumers across all industries.

What are the market trends shaping the Chatbot Industry?

  • A significant market shift is underway as organizations deploy chatbot systems that operate seamlessly across unified communication environments, ensuring consistent engagement across diverse digital touchpoints.

  • Key trends are reshaping the market, led by the adoption of voice-first interfaces and the move toward an omnichannel chatbot experience. This integration allows users to start a conversation on one platform and seamlessly continue it on another, a feature that improves user satisfaction rates by over 30% in some sectors.
  • The demand for voice-enabled chatbots is particularly high in hospitality, where over 70% of travelers now prefer properties offering self-service technology. Generative AI in customer service is another major trend, enabling more natural and effective dialogue.
  • The growth of ambient computing is also driving the development of intelligent virtual agents that can perform tasks in the background without manual input, making interactions more intuitive and efficient.

What challenges does the Chatbot Industry face during its growth?

  • A lack of buyer awareness and the absence of industry-wide standardization for chatbot services present a key challenge to market growth.

  • A primary challenge in the market is the difficulty of effective knowledge base integration, which can lead to high failure rates in query resolution. In poorly integrated systems, the percentage of unresolved issues can be over 50% higher than in well-governed ones.
  • While the availability of no-code chatbot builder platforms has lowered entry barriers, achieving reliable contextual understanding at scale remains complex. Furthermore, chatbot security best practices are often overlooked, exposing firms to significant risk; the financial impact of a data breach can be twice as high for companies that fail to implement adequate prompt safety and data governance.
  • Differentiating offerings is also becoming harder as core AI chatbot development features become commoditized, pressuring providers to compete on reliability and demonstrable ROI rather than just functionality.

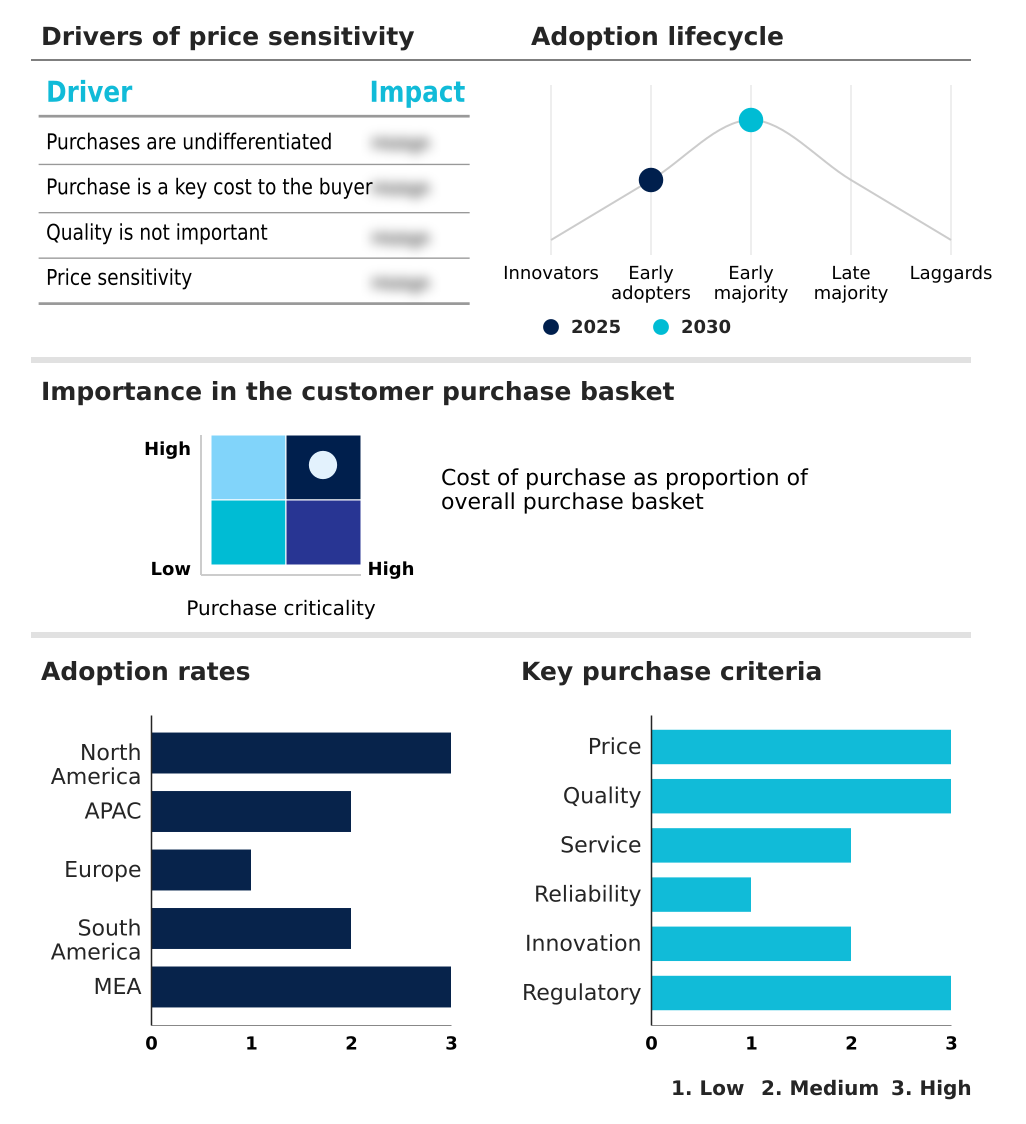
Exclusive Technavio Analysis on Customer Landscape

The chatbot market forecasting report includes the adoption lifecycle of the market, covering from the innovator’s stage to the laggard’s stage. It focuses on adoption rates in different regions based on penetration. Furthermore, the chatbot market report also includes key purchase criteria and drivers of price sensitivity to help companies evaluate and develop their market growth analysis strategies.

Customer Landscape of Chatbot Industry

Competitive Landscape

Companies are implementing various strategies, such as strategic alliances, chatbot market forecast, partnerships, mergers and acquisitions, geographical expansion, and product/service launches, to enhance their presence in the industry.

Boost.ai AS - Offers a conversational automation platform for creating advanced AI agents to handle customer and employee interactions.

The industry research and growth report includes detailed analyses of the competitive landscape of the market and information about key companies, including:

  • Boost.ai AS
  • Cognigy GmbH
  • Freshworks Inc.
  • Google LLC
  • Gupshup Inc.
  • IBM Corp.
  • Intercom Inc.
  • Jio Haptik Technologies Ltd.
  • ManyChat Inc.
  • Microsoft Corp.
  • OpenAI OpCo LLC
  • Oracle Corp.
  • Salesforce Inc.
  • Salesloft Inc.
  • SAP SE
  • SoundHound AI Inc.
  • Tidio LLC
  • Yellow Inc.
  • Zendesk Inc.

Qualitative and quantitative analysis of companies has been conducted to help clients understand the wider business environment as well as the strengths and weaknesses of key industry players. Data is qualitatively analyzed to categorize companies as pure play, category-focused, industry-focused, and diversified; it is quantitatively analyzed to categorize companies as dominant, leading, strong, tentative, and weak.

Recent Development and News in Chatbot market

  • In February, 2025, Bank of America reported that over half of its corporate clients had adopted its CashPro Chat virtual assistant, leading to a 42% reduction in traditional live chat volumes.
  • In May, 2025, Google announced a four-fold increase in the daily active user base for its Gemini platform compared to the previous year, highlighting a growing reliance on integrated productivity assistants.
  • In March, 2025, ServiceNow acquired Moveworks for $2.85 billion, aiming to transform basic information retrieval bots into autonomous task-execution agents within its ecosystem.
  • In October, 2025, Alibaba Group integrated a new artificial intelligence chatbot assistant into its Quark application to enhance shopping experiences through localized and context-aware interactions.

Dive into Technavio’s robust research methodology, blending expert interviews, extensive data synthesis, and validated models for unparalleled Chatbot Market insights. See full methodology.

Market Scope
Page number 305
Base year 2025
Historic period 2020-2024
Forecast period 2026-2030
Growth momentum & CAGR Accelerate at a CAGR of 55.1%
Market growth 2026-2030 USD 20328.5 million
Market structure Fragmented
YoY growth 2025-2026(%) 36.0%
Key countries US, Canada, Mexico, China, Japan, India, South Korea, Australia, Indonesia, Germany, UK, France, Italy, Spain, The Netherlands, Brazil, Argentina, Chile, Saudi Arabia, UAE, South Africa, Israel and Turkey
Competitive landscape Leading Companies, Market Positioning of Companies, Competitive Strategies, and Industry Risks

Request Free Sample

Research Analyst Overview

  • The market has transitioned from basic conversational AI to sophisticated agentic systems capable of autonomous task execution. This evolution is built upon foundational technologies like natural language processing, machine learning, and retrieval augmented generation, which power the modern AI-driven platform.
  • Enterprises are increasingly adopting these tools for customer service automation and lead generation, with deep CRM integration becoming a standard requirement. The rise of generative artificial intelligence and large language models is enabling complex, multimodal interactions and advanced dialogue management. This shift has elevated chatbots from tactical tools to strategic assets influencing boardroom decisions around operational efficiency and customer engagement.
  • For instance, some firms have achieved a 42% reduction in live chat volumes by deploying voice-first interfaces and virtual concierge services. As a result, capabilities such as sentiment analysis, contextual understanding, and ensuring prompt safety within unified communication platforms are now critical for delivering value, moving far beyond simple workflow automation.

What are the Key Data Covered in this Chatbot Market Research and Growth Report?

  • What is the expected growth of the Chatbot Market between 2026 and 2030?

    • USD 20.33 billion, at a CAGR of 55.1%

  • What segmentation does the market report cover?

    • The report is segmented by End-user (Retail, BFSI, Travel and hospitality, Government, and Others), Product (Solutions, and Services), Type (Standalone, Web-based, and Messenger-based or third party) and Geography (North America, APAC, Europe, South America, Middle East and Africa)

  • Which regions are analyzed in the report?

    • North America, APAC, Europe, South America and Middle East and Africa

  • What are the key growth drivers and market challenges?

    • Several benefits associated with using chatbots solutions, Lack of awareness and standardization of chatbot services

  • Who are the major players in the Chatbot Market?

    • Boost.ai AS, Cognigy GmbH, Freshworks Inc., Google LLC, Gupshup Inc., IBM Corp., Intercom Inc., Jio Haptik Technologies Ltd., ManyChat Inc., Microsoft Corp., OpenAI OpCo LLC, Oracle Corp., Salesforce Inc., Salesloft Inc., SAP SE, SoundHound AI Inc., Tidio LLC, Yellow Inc. and Zendesk Inc.

Market Research Insights

  • The market is being reshaped by the adoption of AI virtual assistants and advanced conversational marketing platforms. Businesses leveraging an omnichannel chatbot experience are seeing customer retention rates improve by over 25% compared to those using single-channel support.
  • Enterprise chatbot solutions are delivering substantial ROI, with some financial institutions automating over 90% of routine inquiries, which directly enhances both customer satisfaction and operational efficiency. Furthermore, the use of AI-powered business messaging for automated customer engagement allows companies to reduce operational costs by up to 30%.
  • This dynamic illustrates a clear shift toward strategic investments in conversational AI that yield measurable financial and experiential benefits.

We can help! Our analysts can customize this chatbot market research report to meet your requirements.

Get in touch

1. Executive Summary

1.1 Market overview

Executive Summary - Chart on Market Overview
Executive Summary - Data Table on Market Overview
Executive Summary - Chart on Global Market Characteristics
Executive Summary - Chart on Market by Geography
Executive Summary - Chart on Market Segmentation by End-user
Executive Summary - Chart on Market Segmentation by Product
Executive Summary - Chart on Market Segmentation by Type
Executive Summary - Chart on Incremental Growth
Executive Summary - Data Table on Incremental Growth
Executive Summary - Chart on Company Market Positioning

2. Technavio Analysis

2.1 Analysis of price sensitivity, lifecycle, customer purchase basket, adoption rates, and purchase criteria

2.2 Criticality of inputs and Factors of differentiation

Chart on Overview on criticality of inputs and factors of differentiation

2.3 Factors of disruption

Chart on Overview on factors of disruption

2.4 Impact of drivers and challenges

Chart on Impact of drivers and challenges in 2025 and 2030

3. Market Landscape

3.1 Market ecosystem

Chart on Parent Market
Data Table on - Parent Market

3.2 Market characteristics

Chart on Market characteristics analysis

3.3 Value chain analysis

Chart on Value chain analysis

4. Market Sizing

4.1 Market definition

Data Table on Offerings of companies included in the market definition

4.2 Market segment analysis

Market segments

4.3 Market size 2025

4.4 Market outlook: Forecast for 2025-2030

Chart on Global - Market size and forecast 2025-2030 ($ million)
Data Table on Global - Market size and forecast 2025-2030 ($ million)
Chart on Global Market: Year-over-year growth 2025-2030 (%)
Data Table on Global Market: Year-over-year growth 2025-2030 (%)

5. Historic Market Size

5.1 Global Chatbot Market 2020 - 2024

Historic Market Size - Data Table on Global Chatbot Market 2020 - 2024 ($ million)

5.2 End-user segment analysis 2020 - 2024

Historic Market Size - End-user Segment 2020 - 2024 ($ million)

5.3 Product segment analysis 2020 - 2024

Historic Market Size - Product Segment 2020 - 2024 ($ million)

5.4 Type segment analysis 2020 - 2024

Historic Market Size - Type Segment 2020 - 2024 ($ million)

5.5 Geography segment analysis 2020 - 2024

Historic Market Size - Geography Segment 2020 - 2024 ($ million)

5.6 Country segment analysis 2020 - 2024

Historic Market Size - Country Segment 2020 - 2024 ($ million)

6. Qualitative Analysis

6.1 The AI Impact on Global Chatbot Market

7. Five Forces Analysis

7.1 Five forces summary

Five forces analysis - Comparison between 2025 and 2030

7.2 Bargaining power of buyers

Bargaining power of buyers - Impact of key factors 2025 and 2030

7.3 Bargaining power of suppliers

Bargaining power of suppliers - Impact of key factors in 2025 and 2030

7.4 Threat of new entrants

Threat of new entrants - Impact of key factors in 2025 and 2030

7.5 Threat of substitutes

Threat of substitutes - Impact of key factors in 2025 and 2030

7.6 Threat of rivalry

Threat of rivalry - Impact of key factors in 2025 and 2030

7.7 Market condition

Chart on Market condition - Five forces 2025 and 2030

8. Market Segmentation by End-user

8.1 Market segments

Chart on End-user - Market share 2025-2030 (%)
Data Table on End-user - Market share 2025-2030 (%)

8.2 Comparison by End-user

Chart on Comparison by End-user
Data Table on Comparison by End-user

8.3 Retail - Market size and forecast 2025-2030

Chart on Retail - Market size and forecast 2025-2030 ($ million)
Data Table on Retail - Market size and forecast 2025-2030 ($ million)
Chart on Retail - Year-over-year growth 2025-2030 (%)
Data Table on Retail - Year-over-year growth 2025-2030 (%)

8.4 BFSI - Market size and forecast 2025-2030

Chart on BFSI - Market size and forecast 2025-2030 ($ million)
Data Table on BFSI - Market size and forecast 2025-2030 ($ million)
Chart on BFSI - Year-over-year growth 2025-2030 (%)
Data Table on BFSI - Year-over-year growth 2025-2030 (%)

8.5 Travel and hospitality - Market size and forecast 2025-2030

Chart on Travel and hospitality - Market size and forecast 2025-2030 ($ million)
Data Table on Travel and hospitality - Market size and forecast 2025-2030 ($ million)
Chart on Travel and hospitality - Year-over-year growth 2025-2030 (%)
Data Table on Travel and hospitality - Year-over-year growth 2025-2030 (%)

8.6 Government - Market size and forecast 2025-2030

Chart on Government - Market size and forecast 2025-2030 ($ million)
Data Table on Government - Market size and forecast 2025-2030 ($ million)
Chart on Government - Year-over-year growth 2025-2030 (%)
Data Table on Government - Year-over-year growth 2025-2030 (%)

8.7 Others - Market size and forecast 2025-2030

Chart on Others - Market size and forecast 2025-2030 ($ million)
Data Table on Others - Market size and forecast 2025-2030 ($ million)
Chart on Others - Year-over-year growth 2025-2030 (%)
Data Table on Others - Year-over-year growth 2025-2030 (%)

8.8 Market opportunity by End-user

Market opportunity by End-user ($ million)
Data Table on Market opportunity by End-user ($ million)

9. Market Segmentation by Product

9.1 Market segments

Chart on Product - Market share 2025-2030 (%)
Data Table on Product - Market share 2025-2030 (%)

9.2 Comparison by Product

Chart on Comparison by Product
Data Table on Comparison by Product

9.3 Solutions - Market size and forecast 2025-2030

Chart on Solutions - Market size and forecast 2025-2030 ($ million)
Data Table on Solutions - Market size and forecast 2025-2030 ($ million)
Chart on Solutions - Year-over-year growth 2025-2030 (%)
Data Table on Solutions - Year-over-year growth 2025-2030 (%)

9.4 Services - Market size and forecast 2025-2030

Chart on Services - Market size and forecast 2025-2030 ($ million)
Data Table on Services - Market size and forecast 2025-2030 ($ million)
Chart on Services - Year-over-year growth 2025-2030 (%)
Data Table on Services - Year-over-year growth 2025-2030 (%)

9.5 Market opportunity by Product

Market opportunity by Product ($ million)
Data Table on Market opportunity by Product ($ million)

10. Market Segmentation by Type

10.1 Market segments

Chart on Type - Market share 2025-2030 (%)
Data Table on Type - Market share 2025-2030 (%)

10.2 Comparison by Type

Chart on Comparison by Type
Data Table on Comparison by Type

10.3 Standalone - Market size and forecast 2025-2030

Chart on Standalone - Market size and forecast 2025-2030 ($ million)
Data Table on Standalone - Market size and forecast 2025-2030 ($ million)
Chart on Standalone - Year-over-year growth 2025-2030 (%)
Data Table on Standalone - Year-over-year growth 2025-2030 (%)

10.4 Web-based - Market size and forecast 2025-2030

Chart on Web-based - Market size and forecast 2025-2030 ($ million)
Data Table on Web-based - Market size and forecast 2025-2030 ($ million)
Chart on Web-based - Year-over-year growth 2025-2030 (%)
Data Table on Web-based - Year-over-year growth 2025-2030 (%)

10.5 Messenger-based or third party - Market size and forecast 2025-2030

Chart on Messenger-based or third party - Market size and forecast 2025-2030 ($ million)
Data Table on Messenger-based or third party - Market size and forecast 2025-2030 ($ million)
Chart on Messenger-based or third party - Year-over-year growth 2025-2030 (%)
Data Table on Messenger-based or third party - Year-over-year growth 2025-2030 (%)

10.6 Market opportunity by Type

Market opportunity by Type ($ million)
Data Table on Market opportunity by Type ($ million)

11. Customer Landscape

11.1 Customer landscape overview

Analysis of price sensitivity, lifecycle, customer purchase basket, adoption rates, and purchase criteria

12. Geographic Landscape

12.1 Geographic segmentation

Chart on Market share by geography 2025-2030 (%)
Data Table on Market share by geography 2025-2030 (%)

12.2 Geographic comparison

Chart on Geographic comparison
Data Table on Geographic comparison

12.3 North America - Market size and forecast 2025-2030

Chart on North America - Market size and forecast 2025-2030 ($ million)
Data Table on North America - Market size and forecast 2025-2030 ($ million)
Chart on North America - Year-over-year growth 2025-2030 (%)
Data Table on North America - Year-over-year growth 2025-2030 (%)
Chart on Regional Comparison - North America
Data Table on Regional Comparison - North America

12.3.1 US - Market size and forecast 2025-2030

Chart on US - Market size and forecast 2025-2030 ($ million)
Data Table on US - Market size and forecast 2025-2030 ($ million)
Chart on US - Year-over-year growth 2025-2030 (%)
Data Table on US - Year-over-year growth 2025-2030 (%)

12.3.2 Canada - Market size and forecast 2025-2030

Chart on Canada - Market size and forecast 2025-2030 ($ million)
Data Table on Canada - Market size and forecast 2025-2030 ($ million)
Chart on Canada - Year-over-year growth 2025-2030 (%)
Data Table on Canada - Year-over-year growth 2025-2030 (%)

12.3.3 Mexico - Market size and forecast 2025-2030

Chart on Mexico - Market size and forecast 2025-2030 ($ million)
Data Table on Mexico - Market size and forecast 2025-2030 ($ million)
Chart on Mexico - Year-over-year growth 2025-2030 (%)
Data Table on Mexico - Year-over-year growth 2025-2030 (%)

12.4 APAC - Market size and forecast 2025-2030

Chart on APAC - Market size and forecast 2025-2030 ($ million)
Data Table on APAC - Market size and forecast 2025-2030 ($ million)
Chart on APAC - Year-over-year growth 2025-2030 (%)
Data Table on APAC - Year-over-year growth 2025-2030 (%)
Chart on Regional Comparison - APAC
Data Table on Regional Comparison - APAC

12.4.1 China - Market size and forecast 2025-2030

Chart on China - Market size and forecast 2025-2030 ($ million)
Data Table on China - Market size and forecast 2025-2030 ($ million)
Chart on China - Year-over-year growth 2025-2030 (%)
Data Table on China - Year-over-year growth 2025-2030 (%)

12.4.2 Japan - Market size and forecast 2025-2030

Chart on Japan - Market size and forecast 2025-2030 ($ million)
Data Table on Japan - Market size and forecast 2025-2030 ($ million)
Chart on Japan - Year-over-year growth 2025-2030 (%)
Data Table on Japan - Year-over-year growth 2025-2030 (%)

12.4.3 India - Market size and forecast 2025-2030

Chart on India - Market size and forecast 2025-2030 ($ million)
Data Table on India - Market size and forecast 2025-2030 ($ million)
Chart on India - Year-over-year growth 2025-2030 (%)
Data Table on India - Year-over-year growth 2025-2030 (%)

12.4.4 South Korea - Market size and forecast 2025-2030

Chart on South Korea - Market size and forecast 2025-2030 ($ million)
Data Table on South Korea - Market size and forecast 2025-2030 ($ million)
Chart on South Korea - Year-over-year growth 2025-2030 (%)
Data Table on South Korea - Year-over-year growth 2025-2030 (%)

12.4.5 Australia - Market size and forecast 2025-2030

Chart on Australia - Market size and forecast 2025-2030 ($ million)
Data Table on Australia - Market size and forecast 2025-2030 ($ million)
Chart on Australia - Year-over-year growth 2025-2030 (%)
Data Table on Australia - Year-over-year growth 2025-2030 (%)

12.4.6 Indonesia - Market size and forecast 2025-2030

Chart on Indonesia - Market size and forecast 2025-2030 ($ million)
Data Table on Indonesia - Market size and forecast 2025-2030 ($ million)
Chart on Indonesia - Year-over-year growth 2025-2030 (%)
Data Table on Indonesia - Year-over-year growth 2025-2030 (%)

12.5 Europe - Market size and forecast 2025-2030

Chart on Europe - Market size and forecast 2025-2030 ($ million)
Data Table on Europe - Market size and forecast 2025-2030 ($ million)
Chart on Europe - Year-over-year growth 2025-2030 (%)
Data Table on Europe - Year-over-year growth 2025-2030 (%)
Chart on Regional Comparison - Europe
Data Table on Regional Comparison - Europe

12.5.1 Germany - Market size and forecast 2025-2030

Chart on Germany - Market size and forecast 2025-2030 ($ million)
Data Table on Germany - Market size and forecast 2025-2030 ($ million)
Chart on Germany - Year-over-year growth 2025-2030 (%)
Data Table on Germany - Year-over-year growth 2025-2030 (%)

12.5.2 UK - Market size and forecast 2025-2030

Chart on UK - Market size and forecast 2025-2030 ($ million)
Data Table on UK - Market size and forecast 2025-2030 ($ million)
Chart on UK - Year-over-year growth 2025-2030 (%)
Data Table on UK - Year-over-year growth 2025-2030 (%)

12.5.3 France - Market size and forecast 2025-2030

Chart on France - Market size and forecast 2025-2030 ($ million)
Data Table on France - Market size and forecast 2025-2030 ($ million)
Chart on France - Year-over-year growth 2025-2030 (%)
Data Table on France - Year-over-year growth 2025-2030 (%)

12.5.4 Italy - Market size and forecast 2025-2030

Chart on Italy - Market size and forecast 2025-2030 ($ million)
Data Table on Italy - Market size and forecast 2025-2030 ($ million)
Chart on Italy - Year-over-year growth 2025-2030 (%)
Data Table on Italy - Year-over-year growth 2025-2030 (%)

12.5.5 Spain - Market size and forecast 2025-2030

Chart on Spain - Market size and forecast 2025-2030 ($ million)
Data Table on Spain - Market size and forecast 2025-2030 ($ million)
Chart on Spain - Year-over-year growth 2025-2030 (%)
Data Table on Spain - Year-over-year growth 2025-2030 (%)

12.5.6 The Netherlands - Market size and forecast 2025-2030

Chart on The Netherlands - Market size and forecast 2025-2030 ($ million)
Data Table on The Netherlands - Market size and forecast 2025-2030 ($ million)
Chart on The Netherlands - Year-over-year growth 2025-2030 (%)
Data Table on The Netherlands - Year-over-year growth 2025-2030 (%)

12.6 South America - Market size and forecast 2025-2030

Chart on South America - Market size and forecast 2025-2030 ($ million)
Data Table on South America - Market size and forecast 2025-2030 ($ million)
Chart on South America - Year-over-year growth 2025-2030 (%)
Data Table on South America - Year-over-year growth 2025-2030 (%)
Chart on Regional Comparison - South America
Data Table on Regional Comparison - South America

12.6.1 Brazil - Market size and forecast 2025-2030

Chart on Brazil - Market size and forecast 2025-2030 ($ million)
Data Table on Brazil - Market size and forecast 2025-2030 ($ million)
Chart on Brazil - Year-over-year growth 2025-2030 (%)
Data Table on Brazil - Year-over-year growth 2025-2030 (%)

12.6.2 Argentina - Market size and forecast 2025-2030

Chart on Argentina - Market size and forecast 2025-2030 ($ million)
Data Table on Argentina - Market size and forecast 2025-2030 ($ million)
Chart on Argentina - Year-over-year growth 2025-2030 (%)
Data Table on Argentina - Year-over-year growth 2025-2030 (%)

12.6.3 Chile - Market size and forecast 2025-2030

Chart on Chile - Market size and forecast 2025-2030 ($ million)
Data Table on Chile - Market size and forecast 2025-2030 ($ million)
Chart on Chile - Year-over-year growth 2025-2030 (%)
Data Table on Chile - Year-over-year growth 2025-2030 (%)

12.7 Middle East and Africa - Market size and forecast 2025-2030

Chart on Middle East and Africa - Market size and forecast 2025-2030 ($ million)
Data Table on Middle East and Africa - Market size and forecast 2025-2030 ($ million)
Chart on Middle East and Africa - Year-over-year growth 2025-2030 (%)
Data Table on Middle East and Africa - Year-over-year growth 2025-2030 (%)
Chart on Regional Comparison - Middle East and Africa
Data Table on Regional Comparison - Middle East and Africa

12.7.1 Saudi Arabia - Market size and forecast 2025-2030

Chart on Saudi Arabia - Market size and forecast 2025-2030 ($ million)
Data Table on Saudi Arabia - Market size and forecast 2025-2030 ($ million)
Chart on Saudi Arabia - Year-over-year growth 2025-2030 (%)
Data Table on Saudi Arabia - Year-over-year growth 2025-2030 (%)

12.7.2 UAE - Market size and forecast 2025-2030

Chart on UAE - Market size and forecast 2025-2030 ($ million)
Data Table on UAE - Market size and forecast 2025-2030 ($ million)
Chart on UAE - Year-over-year growth 2025-2030 (%)
Data Table on UAE - Year-over-year growth 2025-2030 (%)

12.7.3 South Africa - Market size and forecast 2025-2030

Chart on South Africa - Market size and forecast 2025-2030 ($ million)
Data Table on South Africa - Market size and forecast 2025-2030 ($ million)
Chart on South Africa - Year-over-year growth 2025-2030 (%)
Data Table on South Africa - Year-over-year growth 2025-2030 (%)

12.7.4 Israel - Market size and forecast 2025-2030

Chart on Israel - Market size and forecast 2025-2030 ($ million)
Data Table on Israel - Market size and forecast 2025-2030 ($ million)
Chart on Israel - Year-over-year growth 2025-2030 (%)
Data Table on Israel - Year-over-year growth 2025-2030 (%)

12.7.5 Turkey - Market size and forecast 2025-2030

Chart on Turkey - Market size and forecast 2025-2030 ($ million)
Data Table on Turkey - Market size and forecast 2025-2030 ($ million)
Chart on Turkey - Year-over-year growth 2025-2030 (%)
Data Table on Turkey - Year-over-year growth 2025-2030 (%)

12.8 Market opportunity by geography

Market opportunity by geography ($ million)
Data Tables on Market opportunity by geography ($ million)

13. Drivers, Challenges, and Opportunity

13.1 Market drivers

Several benefits associated with using chatbots solutions
Increased demand for web self-service
Growing focus on improving CRM

13.2 Market challenges

Lack of awareness and standardization of chatbot services
Lack of product differentiation and viability issues
Integration issues between front-end and back-end knowledge bases

13.3 Impact of drivers and challenges

Impact of drivers and challenges in 2025 and 2030

13.4 Market opportunities

Integration of chatbots with communication channels
Increasing adoption of chatbots in smartphones
Growing adoption of voice‑first chatbot experiences

14. Competitive Landscape

14.1 Overview

14.2

Overview on criticality of inputs and factors of differentiation

14.3 Landscape disruption

Overview on factors of disruption

14.4 Industry risks

Impact of key risks on business

15. Competitive Analysis

15.1 Companies profiled

Companies covered

15.2 Company ranking index

15.3 Market positioning of companies

Matrix on companies position and classification

15.4 Boost.ai AS

Boost.ai AS - Overview
Boost.ai AS - Product / Service
Boost.ai AS - Key offerings
SWOT

15.5 Cognigy GmbH

Cognigy GmbH - Overview
Cognigy GmbH - Product / Service
Cognigy GmbH - Key offerings
SWOT

15.6 Freshworks Inc.

Freshworks Inc. - Overview
Freshworks Inc. - Product / Service
Freshworks Inc. - Key offerings
SWOT

15.7 Google LLC

Google LLC - Overview
Google LLC - Product / Service
Google LLC - Key offerings
SWOT

15.8 Gupshup Inc.

Gupshup Inc. - Overview
Gupshup Inc. - Product / Service
Gupshup Inc. - Key offerings
SWOT

15.9 IBM Corp.

IBM Corp. - Overview
IBM Corp. - Business segments
IBM Corp. - Key news
IBM Corp. - Key offerings
IBM Corp. - Segment focus
SWOT

15.10 Microsoft Corp.

Microsoft Corp. - Overview
Microsoft Corp. - Business segments
Microsoft Corp. - Key news
Microsoft Corp. - Key offerings
Microsoft Corp. - Segment focus
SWOT

15.11 OpenAI OpCo LLC

OpenAI OpCo LLC - Overview
OpenAI OpCo LLC - Product / Service
OpenAI OpCo LLC - Key offerings
SWOT

15.12 Oracle Corp.

Oracle Corp. - Overview
Oracle Corp. - Business segments
Oracle Corp. - Key news
Oracle Corp. - Key offerings
Oracle Corp. - Segment focus
SWOT

15.13 Salesforce Inc.

Salesforce Inc. - Overview
Salesforce Inc. - Product / Service
Salesforce Inc. - Key news
Salesforce Inc. - Key offerings
SWOT

15.14 SAP SE

SAP SE - Overview
SAP SE - Business segments
SAP SE - Key news
SAP SE - Key offerings
SAP SE - Segment focus
SWOT

15.15 SoundHound AI Inc.

SoundHound AI Inc. - Overview
SoundHound AI Inc. - Product / Service
SoundHound AI Inc. - Key offerings
SWOT

15.16 Tidio LLC

Tidio LLC - Overview
Tidio LLC - Product / Service
Tidio LLC - Key offerings
SWOT

15.17 Yellow Inc.

Yellow Inc. - Overview
Yellow Inc. - Product / Service
Yellow Inc. - Key offerings
SWOT

15.18 Zendesk Inc.

Zendesk Inc. - Overview
Zendesk Inc. - Product / Service
Zendesk Inc. - Key offerings
SWOT

16. Appendix

16.1 Scope of the report

Market definition
Objectives
Notes and caveats

16.2 Inclusions and exclusions checklist

Inclusions checklist
Exclusions checklist

16.3 Currency conversion rates for US$

16.4 Research methodology

16.5 Data procurement

Information sources

16.6 Data validation

16.7 Validation techniques employed for market sizing

16.8 Data synthesis

16.9 360 degree market analysis

16.10 List of abbreviations

Research Methodology

Technavio presents a detailed picture of the market by way of study, synthesis, and summation of data from multiple sources. The analysts have presented the various facets of the market with a particular focus on identifying the key industry influencers. The data thus presented is comprehensive, reliable, and the result of extensive research, both primary and secondary.

INFORMATION SOURCES

Primary sources

  • Manufacturers and suppliers
  • Channel partners
  • Industry experts
  • Strategic decision makers

Secondary sources

  • Industry journals and periodicals
  • Government data
  • Financial reports of key industry players
  • Historical data
  • Press releases

DATA ANALYSIS

Data Synthesis

  • Collation of data
  • Estimation of key figures
  • Analysis of derived insights

Data Validation

  • Triangulation with data models
  • Reference against proprietary databases
  • Corroboration with industry experts

REPORT WRITING

Qualitative

  • Market drivers
  • Market challenges
  • Market trends
  • Five forces analysis

Quantitative

  • Market size and forecast
  • Market segmentation
  • Geographical insights
  • Competitive landscape

Interested in this report?

Get your sample now to see our research methodology and insights!

Download Now

Frequently Asked Questions

Chatbot market growth will increase by USD 20328.5 million during 2026-2030.

The Chatbot market is expected to grow at a CAGR of 55.1% during 2026-2030.

Chatbot market is segmented by End-user (Retail, BFSI, Travel and hospitality, Government, Others) Product (Solutions, Services) Type (Standalone, Web-based, Messenger-based or third party)

Boost.ai AS, Cognigy GmbH, Freshworks Inc., Google LLC, Gupshup Inc., IBM Corp., Intercom Inc., Jio Haptik Technologies Ltd., ManyChat Inc., Microsoft Corp., OpenAI OpCo LLC, Oracle Corp., Salesforce Inc., Salesloft Inc., SAP SE, SoundHound AI Inc., Tidio LLC, Yellow Inc., Zendesk Inc. are a few of the key vendors in the Chatbot market.

North America will register the highest growth rate of 39% among the other regions. Therefore, the Chatbot market in North America is expected to garner significant business opportunities for the vendors during the forecast period.

US, Canada, Mexico, China, Japan, India, South Korea, Australia, Indonesia, Germany, UK, France, Italy, Spain, The Netherlands, Brazil, Argentina, Chile, Saudi Arabia, UAE, South Africa, Israel, Turkey

  • Several benefits associated with using chatbots solutions is the driving factor this market.

The Chatbot market vendors should focus on grabbing business opportunities from the End-user segment as it accounted for the largest market share in the base year.
RIA - Research AI Assistant
Ask RIA