Chemical Storage Cabinets Market Analysis North America, Europe, APAC, South America, Middle East and Africa - US, Germany, China, UK, Japan - Size and Forecast 2024-2028

Chemical Storage Cabinets Market Analysis North America, Europe, APAC, South America, Middle East and Africa - US, Germany, China, UK, Japan - Size and Forecast 2024-2028

Published: Jul 2024 161 Pages SKU: IRTNTR76021

Market Overview at a Glance

$514.3 Mn
Market Opportunity
4.11%
CAGR
3.95
YoY growth 2023-2024(%)

Chemical Storage Cabinets Market Size 2024-2028

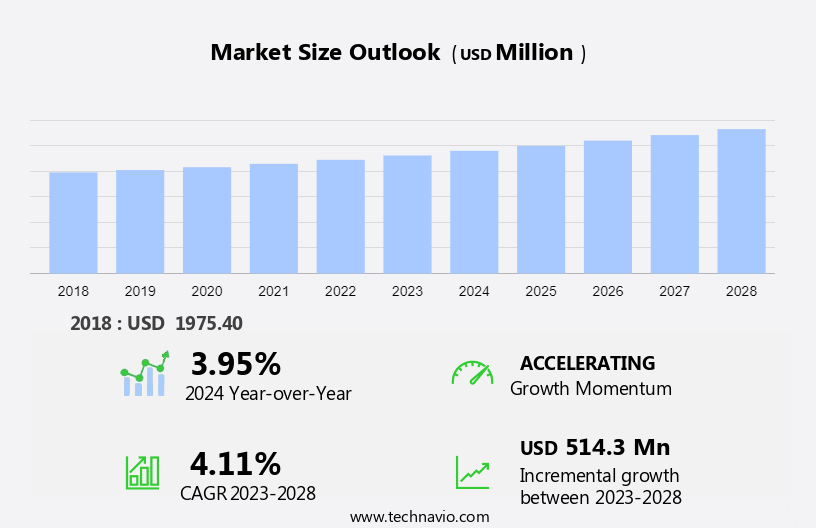
The chemical storage cabinets market size is forecast to increase by USD 514.3 million, at a CAGR of 4.11% between 2023 and 2028. The market's trajectory is influenced by various pivotal factors. Primarily, the manufacturing industries play a crucial role in driving the consumption of specialty chemicals, with diverse sectors relying on these chemicals for their production processes. Furthermore, the rise in international chemical trade facilitates the global distribution and exchange of specialty chemicals, contributing to market expansion. Additionally, the increasing demand for temperature-controlled storage cabinets for chemicals underscores the importance of proper storage and handling in ensuring product quality and safety. As industries prioritize efficiency and compliance with regulatory standards, the market for specialty chemicals continues to grow, driven by the ongoing evolution of manufacturing practices and the dynamic nature of international trade relationships. 

What will be the Size of the Market During the Forecast Period?

Chemical Storage Cabinets Market Size

Market Forecast 2024-2028

To learn more about this report,  Request Free Sample

Market Dynamic

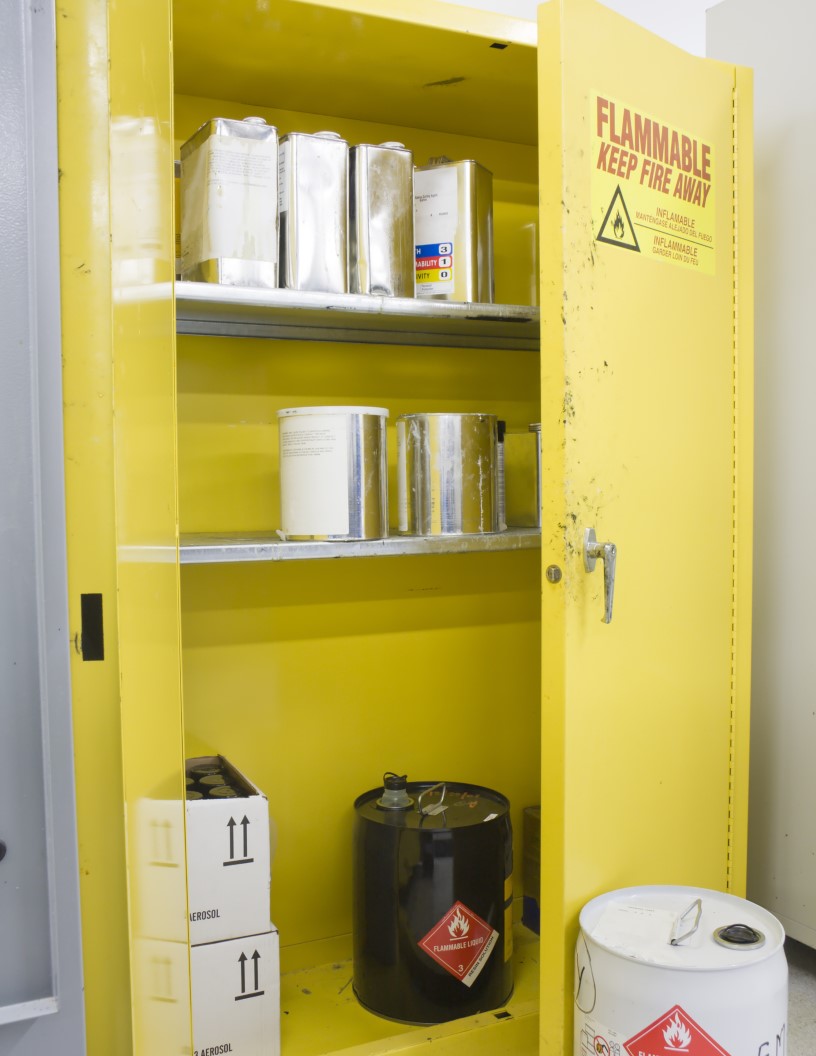
The market encompasses a wide range of storage solutions designed for the safe and compliant storage of toxic, corrosive, and hazardous chemicals. These storage cabinets are available in various sizes, including Below 30 gallon, 30-60 gallon, and Above 60 gallon capacities. Workplace safety and regulatory compliance are paramount in industries dealing with such chemicals, making fire resistance, ventilation, spill containment, and accident prevention essential features. Pharmaceuticals, laboratories, manufacturing, and research facilities are significant end-users of chemical storage cabinets. Safety standards mandate advanced technologies such as sensors, monitoring systems, and connectivity features to mitigate risks associated with chemical exposures and ensure employee well-being. Environmental sustainability is also a growing concern, driving the adoption of eco-friendly and energy-efficient storage solutions. The market for chemical storage cabinets is expected to grow significantly due to the increasing demand for safety and compliance in the handling and storage of hazardous chemicals. 

Key Market Driver - Manufacturing industries driving the consumption of specialty chemicals

Specialty chemicals are used in various industrial applications due to their functions and performance. The addition or use of these chemicals imparts performance benefits and functionality to the final product. Specialty chemicals are manufactured in small quantities and used to make personal care products and cosmetics, water chemicals, organic chemicals, polymers, plastic additives, dyes, pigments, foods, construction products, electronics, and surfactants. 

Moreover, warehousing and storage are important aspects of the specialty chemicals supply chain. It is critical that specialty chemicals are safely stored before being shipped to the end-user or the next stage of the supply chain. Therefore, the rising demand for specialty chemicals from the processing industry and their increasing distribution are expected to boost the demand for chemical storage cabinets, further driving the growth of the market during the forecast period. 

Significant Market Trends - Increasing use of flame retardants in end-user industries

Flame retardants are chemicals added to combustible materials to prevent ignition or to slow or retard combustion. Bromine, chlorine, phosphorus, aluminum, magnesium, and boron are most commonly used in the production of flame retardants used in the production of epoxy resins, paints and coatings, polyolefins, unsaturated polyesters, and polyvinyl chloride (PVC). Chemicals, and others. 

Moreover, there are different types of brominated flame retardants (BFRs), including polybrominated biphenyls (PBBs), polybrominated diphenyl ethers (PBDEs), octabromodiphenyl ether, decabromodiphenyl ether, and pentabromodiphenyl ether. BFRs are used in the production of polystyrene foams, plastics, and polymers. Thus, the growth in the polymer industry is expected to increase the consumption of BFRs, resulting in increased demand for flame retardant chemicals during the forecast period. 

Major Market Challenge - Stringent regulations associated with chemical storage cabinets

Various Regulations for Registration, Evaluation, Authorization, and Restriction of Chemicals (REACH) and Classification, Labeling, and Packaging (CLP) as well as stringent regulations of the Environmental Protection Agency (EPA) and the Biocidal Products Directive (BPD) will decline the production of specialty chemicals. For this reason, the manufacture of chemical storage cabinets requires a high degree of precision.

Moreover, storage cabinet facilities must maintain Material Safety Data Sheets (MSDSs) for all chemicals regulated under the Occupational Safety and Health Administration (OSHA) and Hazard Communication Standards (HCS) (29 CFR 1910.1200). The Safety Data Sheet should include the chemical name, physical and chemical properties of the chemical, associated health hazards, routes of entry, exposure limits, and other information. Hence, the market operates under a highly strict regulatory environment, which is expected to impede the growth of the market during the forecast period.

Market Segmentation

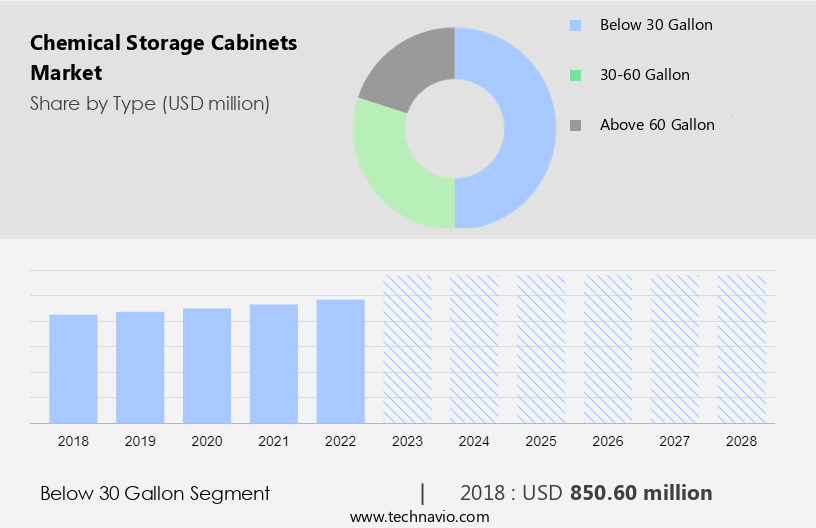
The below 30-gallon segment will account for a major share of the market's growth during the forecast period. Safety cabinets with a capacity of less than 30 gallons are the most viable option for storing a wide variety of chemicals such as flammable and non-flammable. These cabinets are designed to store small amounts of chemicals for easy maintenance. Most laboratories and research centers require small amounts of chemicals. Therefore, cabinets with a capacity of less than 30 gallons have separate cabinets inside to properly store all kinds of chemicals.

Chemical Storage Cabinets Market Size

Get a Customised Report as per your requirements for FREE!

The below 30-gallon segment was valued at USD 850.60 million in 2018. These cabinets are fitted with secure locking mechanisms to limit access to authorized personnel and these chemicals are properly labeled with warning labels.  Also, safety cabinets with a capacity of less than 30 gallons are easy to maintain. However, handling these chemicals requires regular supervision and trained workers. Therefore, safety cabinets with a capacity of less than 30 gallons are expected to grow during the forecast period, mainly due to increasing demand from various industries such as chemical, pharmaceutical, and biotechnology due to their safety benefits. Such factors will increase segment growth during the forecast period.

Application Segment Analysis:

Based on application, the market has been segmented into flammable and combustible chemicals, toxic chemicals, corrosive chemicals, and others. The flammable and combustible chemical segment will account for the largest share of this segment. Flammable and combustible chemicals ignite very easily and burn quickly. Flammable and combustible chemicals are stored in special cabinets to protect workers from exposure to these dangerous chemicals. In addition, these cabinets are well-ventilated and protected from direct sunlight, ignition sources, and heat storage. Flammable and combustible chemicals can decompose or oxidize at some point when exposed to external factors such as air, moisture, and dust particles. Thus, these storage cabinets provide a controlled environment and can also extend the stability and shelf life of these hazardous chemicals. Hence, the flammable and combustible chemicals segment in the market is expected to grow during the forecast period.

Regional Analysis

Chemical Storage Cabinets Market Share by Geography

For more insights on the market share of various regions View PDF Sample now!

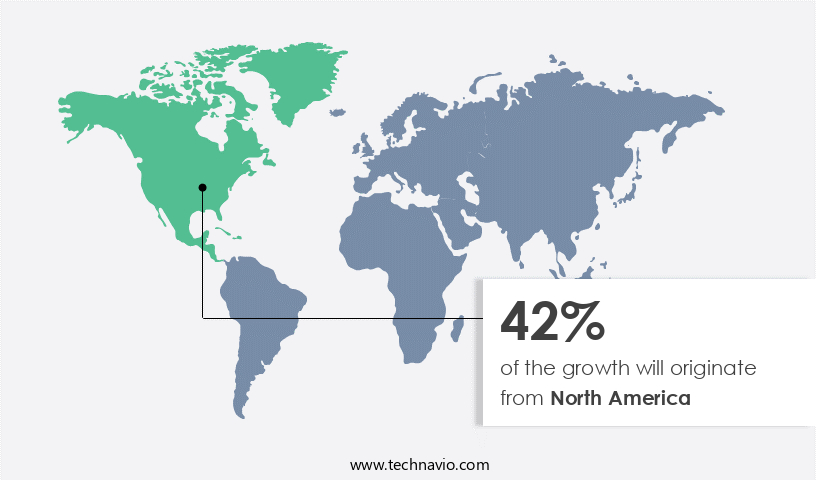
North America is estimated to contribute 42% to the growth by 2028. Technavio’s analysts have elaborately explained the regional market trends, drivers, and challenges that are expected to shape the market during the forecast period. The significant growth of the chemical industry in the region and the growing demand for specialty chemicals in various end-use industries in countries such as the US, Canada, and Mexico are some of the major factors driving the growth of the market in the region. In North America, the demand for chemical cabinets mainly comes from the US. However, there is moderate demand for chemical cabinets in Canada and Mexico.

Moreover, the increasing demand for specialty chemicals in the US, especially from the construction and agricultural industries, is driving the growth of the chemical storage cabinet market in the region. Specialty chemicals are widely used in coatings, adhesives, sealants, and elastomers. The chemical storage cabinet market is undergoing a transformation as chemical manufacturers switch to shale gas for heat and power generation. Growing demand for specialty chemicals from end-use industries such as automotive is expected to drive the growth of the chemical storage cabinet market in the region during the forecast period. 

Who are the Major Market Companies?

Companies are implementing various strategies, such as strategic alliances, partnerships, mergers and acquisitions, geographical expansion, and product/service launches, to enhance their presence in the market.

AltMet Pty Ltd.: The company offers chemical storage cabinets such as industrial and small safety cabinets, intelligent safety cabinets and big-sized outdoor chemical storage cabinets.

We also have detailed analyses of the market’s competitive landscape and offer information on 20 market companies, including asecos GmbH, DENIOS SE, Ecolab Inc., ECOSAFE SA, Fami S.r.l., Justrite Mfg. Co. LLC, Kewaunee Scientific Corp., LabGuard India Pvt. Ltd, Merck KGaA, Safety Storage Systems Ltd., Shanghai SYSBEL Industry and Technology Co. Ltd., Spectrum Laboratory Products Inc., Stericox India Pvt. Ltd., SYSPAL Ltd., and Alfa Chemistry 

Technavio's market growth and forecasting report provides an in-depth analysis of the market and its players through combined qualitative and quantitative data. The analysis classifies companies into categories based on their business approaches, including pure-play, category-focused, industry-focused, and diversified. Companies are specially categorized into dominant, leading, strong, tentative, and weak, based on their quantitative data analysis.  

Segment Overview

The market research and growth report provides comprehensive data (region wise segment analysis), with forecasts and estimates in "USD million" for the period 2024 to 2028, as well as historical data from 2018 to 2022 for the following segments.

  • Type Outlook 
    • Below 30 gallon
    • 30-60 gallon
    • Above 60 gallon
  • Application Outlook 
    • Flammable and combustible chemicals
    • Toxic chemicals
    • Corrosive chemicals
    • Others
  • Region Outlook 
    • North America
      • The U.S.
      • Canada
    • Europe
      • U.K.
      • Germany
      • France
      • Rest of Europe
    • APAC
      • China
      • India
    • South America
      • Chile 
      • Brazil 
      • Argentina
    • Middle East & Africa
      • Saudi Arabia
      • South Africa
      • Rest of the Middle East & Africa

You may also interested in below market reports:

Market Analyst Overview

The market caters to the demand for safe and compliant storage solutions for toxic, corrosive, and hazardous chemicals used in various industries such as pharmaceuticals, laboratories, manufacturing, and research facilities. The market offers a range of storage options, including those below 30 gallons, 30-60 gallons, and above 60 gallons. Safety and compliance are paramount in this market, with features like fire resistance, ventilation, spill containment, and advanced locking systems ensuring risks are minimized. Toxic and corrosive chemicals, including those used in the Petroleum Chemical Industry for dyes and solvents, require specialized storage solutions. Industry 4.0 technologies, such as smart sensors, monitoring systems, and connectivity features, are increasingly being integrated into chemical storage cabinets, providing real-time data on temperature, humidity, and chemical levels for improved operational efficiency.

In addition, fire-resistant materials and advanced safety standards further enhance employee well-being and environmental sustainability. The market is evolving with a focus on high-quality solutions integrating smart technologies for enhanced safety. These cabinets prevent accidents by securely storing chemicals such as dyes and solvents while incorporating integrated ventilation systems to manage fumes effectively. The adoption of smart technologies further enhances monitoring and control, ensuring compliance with safety standards in laboratories and industrial settings. As industries prioritize worker safety and regulatory compliance, these advancements are crucial for mitigating risks associated with chemical handling and storage.

Market Scope

Report Coverage

Details

Page number

161

Base year

2023

Historic period

2018 - 2022

Forecast period

2024-2028

Growth momentum & CAGR

Accelerate at a CAGR of 4.11%

Market growth 2024-2028

USD 514.3 million

Market structure

Fragmented

YoY growth 2023-2024(%)

3.95

Regional analysis

North America, Europe, APAC, Middle East and Africa, and South America

Performing market contribution

North America at 42%

Key countries

US, Germany, China, UK, and Janpan

Competitive landscape

Leading Companies, Market Positioning of Companies, Competitive Strategies, and Industry Risks

Key companies profiled

Alfa Chemistry, AltMet Pty Ltd., asecos GmbH, DENIOS SE, Ecolab Inc., ECOSAFE SA, Fami S.r.l., Justrite Mfg. Co. LLC, Kewaunee Scientific Corp., LabGuard India Pvt. Ltd, Merck KGaA, Safety Storage Systems Ltd., Shanghai SYSBEL Industry and Technology Co. Ltd., Spectrum Laboratory Products Inc., Stericox India Pvt. Ltd., and SYSPAL Ltd.

Market dynamics

Parent market analysis, market report , market forecast , Market growth inducers and obstacles, Fast-growing and slow-growing segment analysis, Market growth and Forecasting, COVID 19 impact and recovery analysis and future consumer dynamics, Market condition analysis for forecast period

Customization purview

If our report has not included the data that you are looking for, you can reach out to our analysts and get segments customized.

Request PDF sample

What are the Key Data Covered in this Market Research Report?

  • CAGR of the market during the forecast period
  • Detailed information on factors that will drive the growth of the market between 2024 and 2028
  • Precise estimation of the market size and its contribution to the market in focus on the parent market
  • Accurate predictions about upcoming trends and changes in consumer behavior
  • Growth of the market across North America, Europe, APAC, South America, and Middle East and Africa
  • A thorough analysis of the market’s competitive landscape and detailed information about companies
  • Comprehensive analysis of factors that will challenge the growth of market companies

We can help! Our analysts can customize this market research report to meet your requirements. Get in touch

1 Executive Summary

  • 1.1 Market overview
    • Executive Summary - Chart on Market Overview
    • Executive Summary - Data Table on Market Overview
    • Executive Summary - Chart on Global Market Characteristics
    • Executive Summary - Chart on Market by Geography
    • Executive Summary - Chart on Market Segmentation by Type
    • Executive Summary - Chart on Market Segmentation by Application
    • Executive Summary - Chart on Incremental Growth
    • Executive Summary - Data Table on Incremental Growth
    • Executive Summary - Chart on Company Market Positioning

2 Market Landscape

  • 2.1 Market ecosystem
    • Parent Market
    • Data Table on - Parent Market
  • 2.2 Market characteristics
    • Market characteristics analysis
  • 2.3 Value chain analysis
    • Value Chain Analysis

3 Market Sizing

  • 3.1 Market definition
    • Offerings of companies included in the market definition
  • 3.2 Market segment analysis
    • Market segments
  • 3.3 Market size 2023
    • 3.4 Market outlook: Forecast for 2023-2028
      • Chart on Global - Market size and forecast 2023-2028 ($ million)
      • Data Table on Global - Market size and forecast 2023-2028 ($ million)
      • Chart on Global Market: Year-over-year growth 2023-2028 (%)
      • Data Table on Global Market: Year-over-year growth 2023-2028 (%)

    4 Historic Market Size

    • 4.1 Global Chemical Storage Cabinets Market 2018 - 2022
      • Historic Market Size - Data Table on Global Chemical Storage Cabinets Market 2018 - 2022 ($ million)
    • 4.2 Type segment analysis 2018 - 2022
      • Historic Market Size - Type Segment 2018 - 2022 ($ million)
    • 4.3 Application segment analysis 2018 - 2022
      • Historic Market Size - Application Segment 2018 - 2022 ($ million)
    • 4.4 Geography segment analysis 2018 - 2022
      • Historic Market Size - Geography Segment 2018 - 2022 ($ million)
    • 4.5 Country segment analysis 2018 - 2022
      • Historic Market Size - Country Segment 2018 - 2022 ($ million)

    5 Five Forces Analysis

    • 5.1 Five forces summary
      • Five forces analysis - Comparison between 2023 and 2028
    • 5.2 Bargaining power of buyers
      • Bargaining power of buyers - Impact of key factors 2023 and 2028
    • 5.3 Bargaining power of suppliers
      • Bargaining power of suppliers - Impact of key factors in 2023 and 2028
    • 5.4 Threat of new entrants
      • Threat of new entrants - Impact of key factors in 2023 and 2028
    • 5.5 Threat of substitutes
      • Threat of substitutes - Impact of key factors in 2023 and 2028
    • 5.6 Threat of rivalry
      • Threat of rivalry - Impact of key factors in 2023 and 2028
    • 5.7 Market condition
      • Chart on Market condition - Five forces 2023 and 2028

    6 Market Segmentation by Type

    • 6.1 Market segments
      • Chart on Type - Market share 2023-2028 (%)
      • Data Table on Type - Market share 2023-2028 (%)
    • 6.2 Comparison by Type
      • Chart on Comparison by Type
      • Data Table on Comparison by Type
    • 6.3 Below 30 gallon - Market size and forecast 2023-2028
      • Chart on Below 30 gallon - Market size and forecast 2023-2028 ($ million)
      • Data Table on Below 30 gallon - Market size and forecast 2023-2028 ($ million)
      • Chart on Below 30 gallon - Year-over-year growth 2023-2028 (%)
      • Data Table on Below 30 gallon - Year-over-year growth 2023-2028 (%)
    • 30-60 gallon - Market size and forecast 2023-2028
      • Chart on 30-60 gallon - Market size and forecast 2023-2028 ($ million)
      • Data Table on 30-60 gallon - Market size and forecast 2023-2028 ($ million)
      • Chart on 30-60 gallon - Year-over-year growth 2023-2028 (%)
      • Data Table on 30-60 gallon - Year-over-year growth 2023-2028 (%)
    • 6.5 Above 60 gallon - Market size and forecast 2023-2028
      • Chart on Above 60 gallon - Market size and forecast 2023-2028 ($ million)
      • Data Table on Above 60 gallon - Market size and forecast 2023-2028 ($ million)
      • Chart on Above 60 gallon - Year-over-year growth 2023-2028 (%)
      • Data Table on Above 60 gallon - Year-over-year growth 2023-2028 (%)
    • 6.6 Market opportunity by Type
      • Market opportunity by Type ($ million)
      • Data Table on Market opportunity by Type ($ million)

    7 Market Segmentation by Application

    • 7.1 Market segments
      • Chart on Application - Market share 2023-2028 (%)
      • Data Table on Application - Market share 2023-2028 (%)
    • 7.2 Comparison by Application
      • Chart on Comparison by Application
      • Data Table on Comparison by Application
    • 7.3 Flammable and combustible chemicals - Market size and forecast 2023-2028
      • Chart on Flammable and combustible chemicals - Market size and forecast 2023-2028 ($ million)
      • Data Table on Flammable and combustible chemicals - Market size and forecast 2023-2028 ($ million)
      • Chart on Flammable and combustible chemicals - Year-over-year growth 2023-2028 (%)
      • Data Table on Flammable and combustible chemicals - Year-over-year growth 2023-2028 (%)
    • 7.4 Toxic chemicals - Market size and forecast 2023-2028
      • Chart on Toxic chemicals - Market size and forecast 2023-2028 ($ million)
      • Data Table on Toxic chemicals - Market size and forecast 2023-2028 ($ million)
      • Chart on Toxic chemicals - Year-over-year growth 2023-2028 (%)
      • Data Table on Toxic chemicals - Year-over-year growth 2023-2028 (%)
    • 7.5 Corrosive chemicals - Market size and forecast 2023-2028
      • Chart on Corrosive chemicals - Market size and forecast 2023-2028 ($ million)
      • Data Table on Corrosive chemicals - Market size and forecast 2023-2028 ($ million)
      • Chart on Corrosive chemicals - Year-over-year growth 2023-2028 (%)
      • Data Table on Corrosive chemicals - Year-over-year growth 2023-2028 (%)
    • 7.6 Others - Market size and forecast 2023-2028
      • Chart on Others - Market size and forecast 2023-2028 ($ million)
      • Data Table on Others - Market size and forecast 2023-2028 ($ million)
      • Chart on Others - Year-over-year growth 2023-2028 (%)
      • Data Table on Others - Year-over-year growth 2023-2028 (%)
    • 7.7 Market opportunity by Application
      • Market opportunity by Application ($ million)
      • Data Table on Market opportunity by Application ($ million)

    8 Customer Landscape

    • 8.1 Customer landscape overview
      • Analysis of price sensitivity, lifecycle, customer purchase basket, adoption rates, and purchase criteria

    9 Geographic Landscape

    • 9.1 Geographic segmentation
      • Chart on Market share by geography 2023-2028 (%)
      • Data Table on Market share by geography 2023-2028 (%)
    • 9.2 Geographic comparison
      • Chart on Geographic comparison
      • Data Table on Geographic comparison
    • 9.3 North America - Market size and forecast 2023-2028
      • Chart on North America - Market size and forecast 2023-2028 ($ million)
      • Data Table on North America - Market size and forecast 2023-2028 ($ million)
      • Chart on North America - Year-over-year growth 2023-2028 (%)
      • Data Table on North America - Year-over-year growth 2023-2028 (%)
    • 9.4 Europe - Market size and forecast 2023-2028
      • Chart on Europe - Market size and forecast 2023-2028 ($ million)
      • Data Table on Europe - Market size and forecast 2023-2028 ($ million)
      • Chart on Europe - Year-over-year growth 2023-2028 (%)
      • Data Table on Europe - Year-over-year growth 2023-2028 (%)
    • 9.5 APAC - Market size and forecast 2023-2028
      • Chart on APAC - Market size and forecast 2023-2028 ($ million)
      • Data Table on APAC - Market size and forecast 2023-2028 ($ million)
      • Chart on APAC - Year-over-year growth 2023-2028 (%)
      • Data Table on APAC - Year-over-year growth 2023-2028 (%)
    • 9.6 South America - Market size and forecast 2023-2028
      • Chart on South America - Market size and forecast 2023-2028 ($ million)
      • Data Table on South America - Market size and forecast 2023-2028 ($ million)
      • Chart on South America - Year-over-year growth 2023-2028 (%)
      • Data Table on South America - Year-over-year growth 2023-2028 (%)
    • 9.7 Middle East and Africa - Market size and forecast 2023-2028
      • Chart on Middle East and Africa - Market size and forecast 2023-2028 ($ million)
      • Data Table on Middle East and Africa - Market size and forecast 2023-2028 ($ million)
      • Chart on Middle East and Africa - Year-over-year growth 2023-2028 (%)
      • Data Table on Middle East and Africa - Year-over-year growth 2023-2028 (%)
    • 9.8 US - Market size and forecast 2023-2028
      • Chart on US - Market size and forecast 2023-2028 ($ million)
      • Data Table on US - Market size and forecast 2023-2028 ($ million)
      • Chart on US - Year-over-year growth 2023-2028 (%)
      • Data Table on US - Year-over-year growth 2023-2028 (%)
    • 9.9 Germany - Market size and forecast 2023-2028
      • Chart on Germany - Market size and forecast 2023-2028 ($ million)
      • Data Table on Germany - Market size and forecast 2023-2028 ($ million)
      • Chart on Germany - Year-over-year growth 2023-2028 (%)
      • Data Table on Germany - Year-over-year growth 2023-2028 (%)
    • 9.10 China - Market size and forecast 2023-2028
      • Chart on China - Market size and forecast 2023-2028 ($ million)
      • Data Table on China - Market size and forecast 2023-2028 ($ million)
      • Chart on China - Year-over-year growth 2023-2028 (%)
      • Data Table on China - Year-over-year growth 2023-2028 (%)
    • 9.11 UK - Market size and forecast 2023-2028
      • Chart on UK - Market size and forecast 2023-2028 ($ million)
      • Data Table on UK - Market size and forecast 2023-2028 ($ million)
      • Chart on UK - Year-over-year growth 2023-2028 (%)
      • Data Table on UK - Year-over-year growth 2023-2028 (%)
    • 9.12 Japan - Market size and forecast 2023-2028
      • Chart on Japan - Market size and forecast 2023-2028 ($ million)
      • Data Table on Japan - Market size and forecast 2023-2028 ($ million)
      • Chart on Japan - Year-over-year growth 2023-2028 (%)
      • Data Table on Japan - Year-over-year growth 2023-2028 (%)
    • 9.13 Market opportunity by geography
      • Market opportunity by geography ($ million)
      • Data Tables on Market opportunity by geography ($ million)

    10 Drivers, Challenges, and Opportunity/Restraints

    • 10.1 Market drivers
      • 10.2 Market challenges
        • 10.3 Impact of drivers and challenges
          • Impact of drivers and challenges in 2023 and 2028
        • 10.4 Market opportunities/restraints

          11 Competitive Landscape

          • 11.1 Overview
            • 11.2 Competitive Landscape
              • Overview on criticality of inputs and factors of differentiation
            • 11.3 Landscape disruption
              • Overview on factors of disruption
            • 11.4 Industry risks
              • Impact of key risks on business

            12 Competitive Analysis

            • 12.1 Companies profiled
              • Companies covered
            • 12.2 Market positioning of companies
              • Matrix on companies position and classification
            • 12.3 Alfa Chemistry
              • Alfa Chemistry - Overview
              • Alfa Chemistry - Product / Service
              • Alfa Chemistry - Key offerings
            • 12.4 AltMet Pty Ltd.
              • AltMet Pty Ltd. - Overview
              • AltMet Pty Ltd. - Product / Service
              • AltMet Pty Ltd. - Key offerings
            • 12.5 asecos GmbH
              • asecos GmbH - Overview
              • asecos GmbH - Product / Service
              • asecos GmbH - Key offerings
            • 12.6 DENIOS SE
              • DENIOS SE - Overview
              • DENIOS SE - Product / Service
              • DENIOS SE - Key offerings
            • 12.7 Ecolab Inc.
              • Ecolab Inc. - Overview
              • Ecolab Inc. - Business segments
              • Ecolab Inc. - Key news
              • Ecolab Inc. - Key offerings
              • Ecolab Inc. - Segment focus
            • 12.8 ECOSAFE SA
              • ECOSAFE SA - Overview
              • ECOSAFE SA - Product / Service
              • ECOSAFE SA - Key offerings
            • 12.9 Fami S.r.l.
              • Fami S.r.l. - Overview
              • Fami S.r.l. - Product / Service
              • Fami S.r.l. - Key offerings
            • 12.10 Justrite Mfg. Co. LLC
              • Justrite Mfg. Co. LLC - Overview
              • Justrite Mfg. Co. LLC - Product / Service
              • Justrite Mfg. Co. LLC - Key offerings
            • 12.11 Kewaunee Scientific Corp.
              • Kewaunee Scientific Corp. - Overview
              • Kewaunee Scientific Corp. - Business segments
              • Kewaunee Scientific Corp. - Key offerings
              • Kewaunee Scientific Corp. - Segment focus
            • 12.12 LabGuard India Pvt. Ltd
              • LabGuard India Pvt. Ltd - Overview
              • LabGuard India Pvt. Ltd - Product / Service
              • LabGuard India Pvt. Ltd - Key offerings
            • 12.13 Merck KGaA
              • Merck KGaA - Overview
              • Merck KGaA - Business segments
              • Merck KGaA - Key news
              • Merck KGaA - Key offerings
              • Merck KGaA - Segment focus
            • 12.14 Shanghai SYSBEL Industry and Technology Co. Ltd.
              • Shanghai SYSBEL Industry and Technology Co. Ltd. - Overview
              • Shanghai SYSBEL Industry and Technology Co. Ltd. - Product / Service
              • Shanghai SYSBEL Industry and Technology Co. Ltd. - Key offerings
            • 12.15 Spectrum Laboratory Products Inc.
              • Spectrum Laboratory Products Inc. - Overview
              • Spectrum Laboratory Products Inc. - Product / Service
              • Spectrum Laboratory Products Inc. - Key news
              • Spectrum Laboratory Products Inc. - Key offerings
            • 12.16 Stericox India Pvt. Ltd.
              • Stericox India Pvt. Ltd. - Overview
              • Stericox India Pvt. Ltd. - Product / Service
              • Stericox India Pvt. Ltd. - Key offerings
            • 12.17 SYSPAL Ltd.
              • SYSPAL Ltd. - Overview
              • SYSPAL Ltd. - Product / Service
              • SYSPAL Ltd. - Key offerings

            13 Appendix

            • 13.1 Scope of the report
              • 13.2 Inclusions and exclusions checklist
                • Inclusions checklist
                • Exclusions checklist
              • 13.3 Currency conversion rates for US$
                • Currency conversion rates for US$
              • 13.4 Research methodology
                • Research methodology
              • 13.5 Data procurement
                • Information sources
              • 13.6 Data validation
                • Data validation
              • 13.7 Validation techniques employed for market sizing
                • Validation techniques employed for market sizing
              • 13.8 Data synthesis
                • Data synthesis
              • 13.9 360 degree market analysis
                • 360 degree market analysis
              • 13.10 List of abbreviations
                • List of abbreviations

              Research Methodology

              Technavio presents a detailed picture of the market by way of study, synthesis, and summation of data from multiple sources. The analysts have presented the various facets of the market with a particular focus on identifying the key industry influencers. The data thus presented is comprehensive, reliable, and the result of extensive research, both primary and secondary.

              INFORMATION SOURCES

              Primary sources

              • Manufacturers and suppliers
              • Channel partners
              • Industry experts
              • Strategic decision makers

              Secondary sources

              • Industry journals and periodicals
              • Government data
              • Financial reports of key industry players
              • Historical data
              • Press releases

              DATA ANALYSIS

              Data Synthesis

              • Collation of data
              • Estimation of key figures
              • Analysis of derived insights

              Data Validation

              • Triangulation with data models
              • Reference against proprietary databases
              • Corroboration with industry experts

              REPORT WRITING

              Qualitative

              • Market drivers
              • Market challenges
              • Market trends
              • Five forces analysis

              Quantitative

              • Market size and forecast
              • Market segmentation
              • Geographical insights
              • Competitive landscape

              Interested in this report?

              Get your sample now to see our research methodology and insights!

              Download Now

              Frequently Asked Questions

              Chemical Storage Cabinets market growth will increase by $ 514.3 mn during 2024-2028.

              The Chemical Storage Cabinets market is expected to grow at a CAGR of 4.11% during 2024-2028.

              Chemical Storage Cabinets market is segmented by Type( Below 30 gallon, 30-60 gallon, Above 60 gallon) Application( Flammable and combustible chemicals, Toxic chemicals, Corrosive chemicals, Others)

              Alfa Chemistry, AltMet Pty Ltd., asecos GmbH, DENIOS SE, Ecolab Inc., ECOSAFE SA, Fami S.r.l., Justrite Mfg. Co. LLC, Kewaunee Scientific Corp., LabGuard India Pvt. Ltd, Merck KGaA, Safety Storage Systems Ltd., Shanghai SYSBEL Industry and Technology Co. Ltd., Spectrum Laboratory Products Inc., Stericox India Pvt. Ltd., SYSPAL Ltd. are a few of the key vendors in the Chemical Storage Cabinets market.

              North America will register the highest growth rate of 42% among the other regions. Therefore, the Chemical Storage Cabinets market in North America is expected to garner significant business opportunities for the vendors during the forecast period.

              US, Germany, China, UK, Japan

              • Manufacturing industries driving the consumption of specialty chemicalsThe specialty chemicals segment is one of the key segments of the global chemical storage cabinets industry and is expected to witness significant growth during the forecast period. Currently is the driving factor this market.
              • the specialty chemical industry is in the transition phase. Factors such as shifting economics and the widespread adoption of process technologies are boosting the demand for specialty chemicals. Specialty chemicals are used in various industrial applications based on their function or performance. The addition or use of these chemicals imparts performance benefits and functionality to the final products. Specialty chemicals are produced in small volumes and are used in the manufacturing of personal care products and cosmetics is the driving factor this market.
              • water chemicals is the driving factor this market.
              • organic chemicals is the driving factor this market.
              • polymers is the driving factor this market.
              • plastic additives is the driving factor this market.
              • dyes is the driving factor this market.
              • pigments is the driving factor this market.
              • food items is the driving factor this market.
              • construction-related products is the driving factor this market.
              • electronics is the driving factor this market.
              • and surfactants. A major amount of the specialty chemical business is generated from the cosmetics is the driving factor this market.
              • personal care is the driving factor this market.
              • food and beverage is the driving factor this market.
              • electronics is the driving factor this market.
              • and construction segments. The warehousing and storage of specialty chemicals mainly follow the consumption of specialty chemicals is the driving factor this market.
              • which mainly trails economic growth. The consumption of specialty chemicals is witnessing substantial growth is the driving factor this market.
              • especially in pulp and paper is the driving factor this market.
              • agriculture is the driving factor this market.
              • textile is the driving factor this market.
              • paints and coatings is the driving factor this market.
              • personal care is the driving factor this market.
              • food and beverage is the driving factor this market.
              • and construction industries. The increasing global industrialization and the flourishing end-user industries are encouraging the distribution and logistics of specialty chemicals is the driving factor this market.
              • which also involve warehousing and storage. Warehousing and storage are important aspects of the specialty chemical supply chain. It is important to store specialty chemicals safely before dispatching them to end-users or the next phase of the supply chain. Therefore is the driving factor this market.
              • the increasing demand for specialty chemicals from manufacturing industries and their rising distribution is expected to propel the demand for chemical storage cabinets is the driving factor this market.
              • further boosting the growth of market in focus in the region during the forecast period. is the driving factor this market.

              The Chemical Storage Cabinets market vendors should focus on grabbing business opportunities from the Below 30 gallon segment as it accounted for the largest market share in the base year.