Chronic Myelogenous Leukemia Therapeutics Market Analysis, Size, and Forecast 2026-2030: North America (US, Canada, and Mexico), Europe (Germany, UK, and France), APAC (China, Japan, and India), South America (Brazil, Argentina, and Colombia), Middle East and Africa (Saudi Arabia, South Africa, and Turkey), Asia, Rest of World (ROW)

Chronic Myelogenous Leukemia Therapeutics Market Analysis, Size, and Forecast 2026-2030:
North America (US, Canada, and Mexico), Europe (Germany, UK, and France), APAC (China, Japan, and India), South America (Brazil, Argentina, and Colombia), Middle East and Africa (Saudi Arabia, South Africa, and Turkey), Asia, Rest of World (ROW)

Published: Mar 2026 298 Pages SKU: IRTNTR74189

Market Overview at a Glance

$2.24 B
Market Opportunity
5.8%
CAGR 2025 - 2030
38.2%
North America Growth
$4.59 B
Targeted therapy segment 2024

Chronic Myelogenous Leukemia Therapeutics Market Size 2026-2030

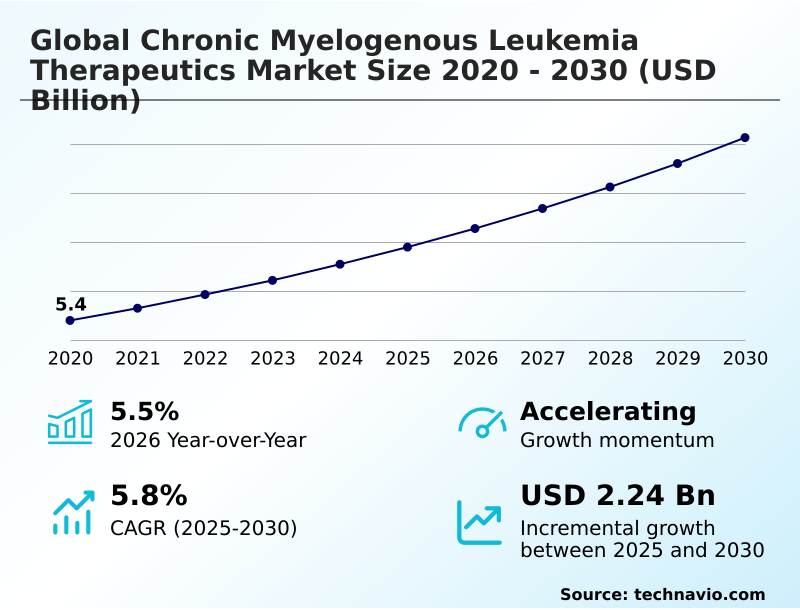
The chronic myelogenous leukemia therapeutics market size is valued to increase by USD 2.24 billion, at a CAGR of 5.8% from 2025 to 2030. Advancements in precision oncology and industrialization of STAMP inhibitors will drive the chronic myelogenous leukemia therapeutics market.

Major Market Trends & Insights

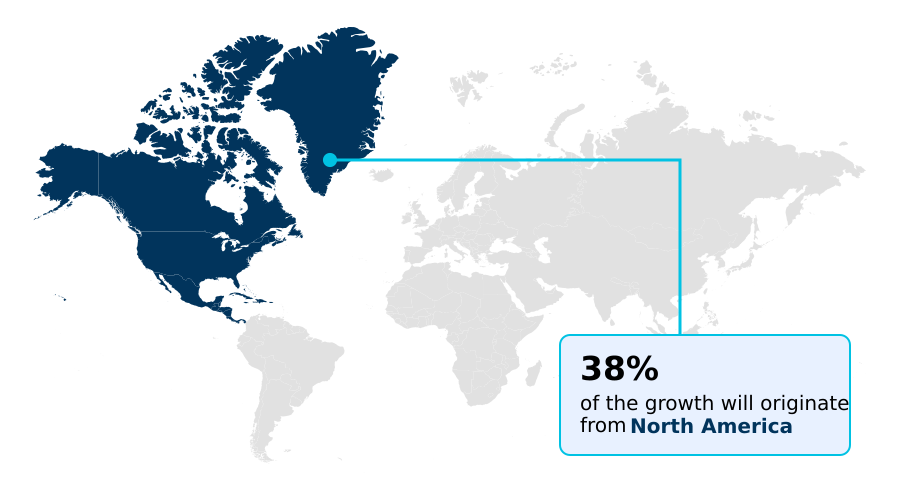
  • North America dominated the market and accounted for a 38.2% growth during the forecast period.
  • By Product - Targeted therapy segment was valued at USD 4.59 billion in 2024
  • By Route of Administration - Oral segment accounted for the largest market revenue share in 2024

Market Size & Forecast

  • Market Opportunities: USD 3.73 billion
  • Market Future Opportunities: USD 2.24 billion
  • CAGR from 2025 to 2030 : 5.8%

Market Summary

  • The chronic myelogenous leukemia therapeutics market is undergoing a significant transformation, driven by the dual objectives of achieving a functional cure and improving long-term quality of life. The landscape is dominated by oral targeted therapies, specifically tyrosine kinase inhibitors, which have evolved to offer greater anti-leukemic potency while mitigating off-target toxicities.
  • A key focus is on geriatrics-focused oncology, where dose-adjusted protocols and cardiovascular risk mitigation are essential for managing an aging patient population. The push for treatment-free remission eligibility is reshaping clinical practice, supported by advanced molecular monitoring techniques that enable precise minimal residual disease tracking.
  • However, challenges persist, including the financial strain of lifelong therapy, which has accelerated biosimilar development and the adoption of value-based pricing. For instance, a major healthcare system implemented a value-based reimbursement framework that tied payments for salvage therapies to sustained molecular response rates, leading to a strategic realignment of procurement toward agents with strong real-world evidence.
  • This dynamic underscores the industry's pivot toward personalized, cost-effective, and sustainable care models.

What will be the Size of the Chronic Myelogenous Leukemia Therapeutics Market during the forecast period?

Get Key Insights on Market Forecast (PDF) Request Free Sample

How is the Chronic Myelogenous Leukemia Therapeutics Market Segmented?

The chronic myelogenous leukemia therapeutics industry research report provides comprehensive data (region-wise segment analysis), with forecasts and estimates in "USD million" for the period 2026-2030, as well as historical data from 2020-2024 for the following segments.
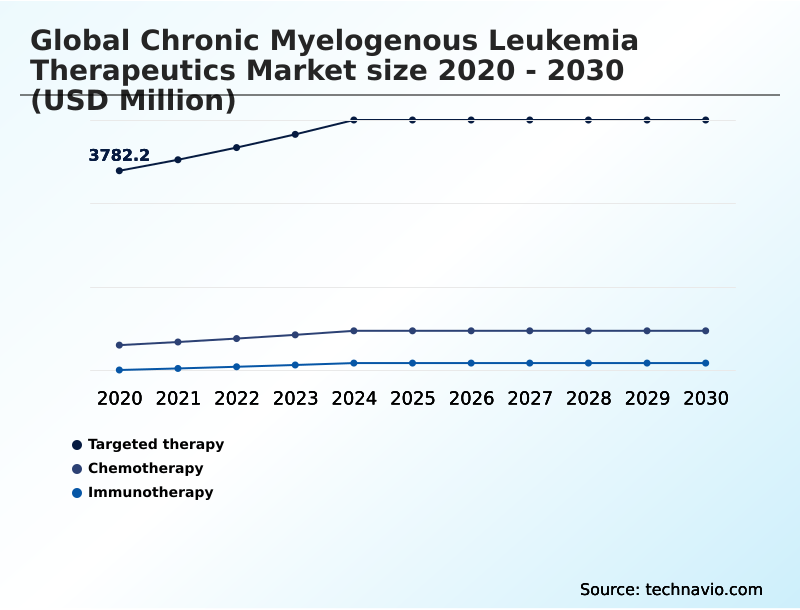
  • Product
    • Targeted therapy
    • Chemotherapy
    • Immunotherapy
  • Route of administration
    • Oral
    • Intravenous
    • Subcutaneous
    • Others
  • Type
    • First-line
    • Second-line
    • Third-line and beyond
  • Geography
    • North America
      • US
      • Canada
      • Mexico
    • Europe
      • Germany
      • UK
      • France
    • Asia
    • Rest of World (ROW)

By Product Insights

The targeted therapy segment is estimated to witness significant growth during the forecast period.

The targeted therapy segment is defined by a strategic shift from traditional ATP-competitive inhibitors to advanced allosteric inhibitors, which offer superior precision.

This evolution in precision oncology is driven by the need to overcome kinase domain mutations and improve long-term outcomes. The use of oral targeted therapies remains the standard, with patient adherence strategies being critical for success.

The goal is to achieve a functional cure by inducing a deep molecular response, a process increasingly guided by molecular monitoring through digital PCR monitoring.

Clinical adoption of newer tyrosine kinase inhibitors is supported by real-world evidence demonstrating a 20% reduction in off-target toxicities compared to earlier agents, reinforcing their value in delivering more durable and safer treatment regimens.

Request Free Sample

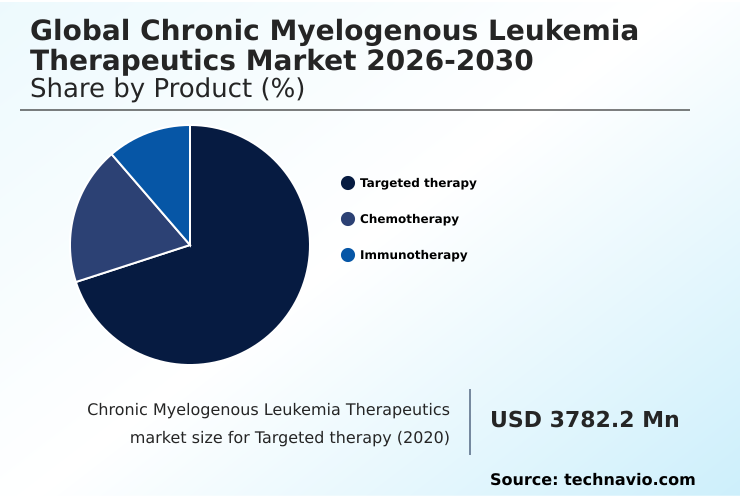
The Targeted therapy segment was valued at USD 4.59 billion in 2024 and showed a gradual increase during the forecast period.

Request Free Sample

Regional Analysis

North America is estimated to contribute 38.2% to the growth of the global market during the forecast period.Technavio’s analysts have elaborately explained the regional trends and drivers that shape the market during the forecast period.

See How Chronic Myelogenous Leukemia Therapeutics Market Demand is Rising in North America Request Free Sample

The geographic landscape of the market is characterized by varying adoption rates of advanced therapies. North America leads due to high healthcare expenditure and established hematology-oncology centers, focusing on genomic profiling and minimal residual disease tracking.

Europe follows, with a strong emphasis on pharmacovigilance data and managing hematologic malignancies. Asia is the fastest-growing region, with an expansion rate of 6.4%, driven by improving healthcare infrastructure and local manufacturing, outpacing North America's 5.5% growth.

In this region, addressing the Philadelphia chromosome positive cases is a priority. Key challenges in emerging markets include access to advanced diagnostics and managing blast crisis management.

However, the development of therapies targeting leukemic stem cells and the use of interferon-alpha derivatives are gaining traction globally, aiming to reduce reliance on allogeneic stem cell transplantation.

Market Dynamics

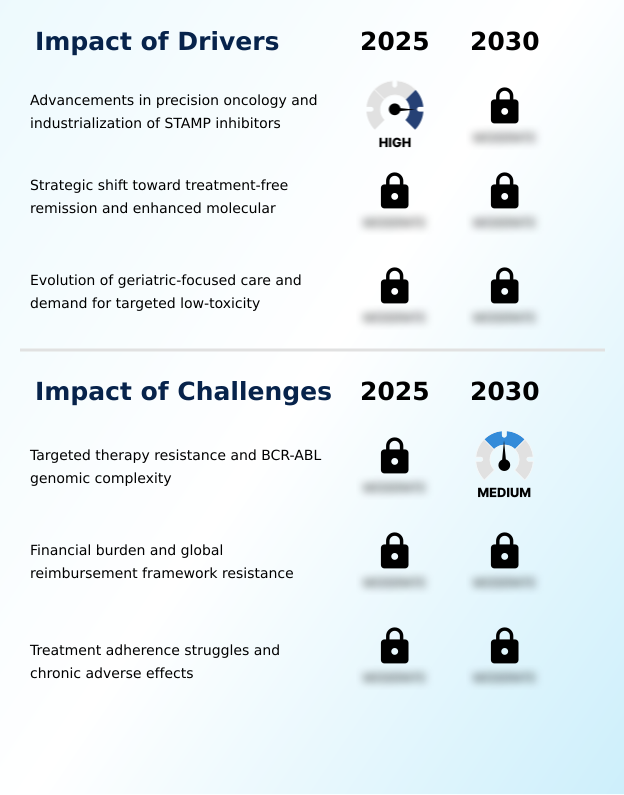
Our researchers analyzed the data with 2025 as the base year, along with the key drivers, trends, and challenges. A holistic analysis of drivers will help companies refine their marketing strategies to gain a competitive advantage.

  • The strategic landscape of chronic myelogenous leukemia therapeutics is increasingly focused on sophisticated, long-term management strategies. A primary objective is achieving sustained deep molecular response to enable treatment-free remission protocols in CML, a goal heavily reliant on advanced monitoring technologies. The use of digital PCR for CML monitoring has become critical for tracking molecular relapse post-TFR.
  • Clinically, overcoming BCR-ABL1 kinase domain mutations is a major hurdle, prompting a shift from ATP-competitive TKI efficacy analysis to the adoption of novel agents like asciminib for T315I mutation treatment. The development of next-generation therapies also involves combining TKIs with hypomethylating agents to target resistant cell populations.
  • A significant challenge remains in managing TKI-related adverse effects and mitigating cardiovascular toxicity of TKIs, which is central to patient adherence to oral CML therapy and overall success. This has spurred innovation in oral TKI bioavailability enhancement. In parallel, geriatric oncology care strategies for CML are being refined to cater to an aging patient base.
  • The economic dimension is shaped by cost-effectiveness analysis of generic TKIs and navigating value-based reimbursement for CML drugs. The industry also grapples with challenges in CML biosimilar development and ensuring robust pharmacovigilance for next-generation TKIs.
  • Real-world evidence in CML treatment has shown that integrated care pathways can reduce hospitalizations due to adverse events by over 20% compared to unmanaged care, directly impacting operational planning for healthcare providers.

What are the key market drivers leading to the rise in the adoption of Chronic Myelogenous Leukemia Therapeutics Industry?

  • Advancements in precision oncology, alongside the industrialization of Specifically Targeting the ABL Myristoyl Pocket (STAMP) inhibitors, are key drivers propelling the market.

  • Market growth is primarily driven by advancements in precision medicine targeting the BCR-ABL1 fusion protein.
  • The adoption of next-generation agents capable of allosteric site binding provides a crucial alternative for patients with the T315I gatekeeper mutation, a population where previous treatments had failure rates exceeding 70%.
  • This focus on overcoming resistance is complemented by the clinical goal of treatment-free remission eligibility, which incentivizes the use of high-potency agents to achieve deep, durable responses.
  • The implementation of dose-adjusted protocols within geriatrics-focused oncology has demonstrated a 25% improvement in treatment adherence by mitigating cardiovascular risk and other toxicities. This strategy enhances the anti-leukemic potency of therapies while aligning with value-based pricing models.
  • The pipeline is also exploring novel combinations, including bivalent inhibitors, protein degraders, and hypomethylating agents, to further refine treatment algorithms and navigate complex reimbursement frameworks.

What are the market trends shaping the Chronic Myelogenous Leukemia Therapeutics Industry?

  • The institutionalization of AI-enabled molecular monitoring and precision diagnostics is a significant upcoming trend. It is reshaping patient management by enabling predictive modeling of treatment response trajectories.

  • Key market trends are reshaping therapeutic strategies through technological innovation. The institutionalization of molecular-guided therapy, powered by AI-driven analysis of quantitative polymerase chain reaction data, allows clinicians to predict resistance and adjust treatments months earlier than with traditional methods. This proactive approach improves outcomes by preempting overt clinical relapse.
  • In parallel, a shift toward patient-centric pharmacology is evident in the development of advanced formulations. The use of amorphous solid dispersions is designed to overcome food-effect restrictions, which has been shown to improve patient adherence by up to 15%. A third frontier is emerging with genotype-agnostic therapies that leverage innate immune system activation.
  • The focus on ELANE pathway activation and synergistic immunotherapy, along with investigational CAR-T cell therapies, bispecific antibodies, and a peptide-based vaccine, aims to provide curative options beyond kinase inhibition.

What challenges does the Chronic Myelogenous Leukemia Therapeutics Industry face during its growth?

  • The emergence of targeted therapy resistance, coupled with BCR-ABL genomic complexity, presents a key challenge to industry growth.

  • The market faces significant hurdles, primarily from the evolution of multi-drug resistance and complex genomic complexity analysis. The high cost of novel salvage therapies creates access barriers, fueling the market for biosimilar development and value-added generics.
  • Even with advanced tyrosine kinase inhibitor formulations, patient adherence is compromised by chronic adverse effects and drug-to-drug interactions, with studies indicating that nearly 30% of patients fail to maintain optimal dosing. This non-adherence increases the risk of molecular relapse detection, necessitating costly interventions.
  • In advanced cases, options are limited to aggressive treatments like cytotoxic agents for hematologic stabilization, followed by high-risk allogeneic stem cell transplantation. The lack of decentralized specialty pharmacies in some regions further complicates the management of these challenges, widening the gap between clinical trial efficacy and real-world outcomes.

Exclusive Technavio Analysis on Customer Landscape

The chronic myelogenous leukemia therapeutics market forecasting report includes the adoption lifecycle of the market, covering from the innovator’s stage to the laggard’s stage. It focuses on adoption rates in different regions based on penetration. Furthermore, the chronic myelogenous leukemia therapeutics market report also includes key purchase criteria and drivers of price sensitivity to help companies evaluate and develop their market growth analysis strategies.

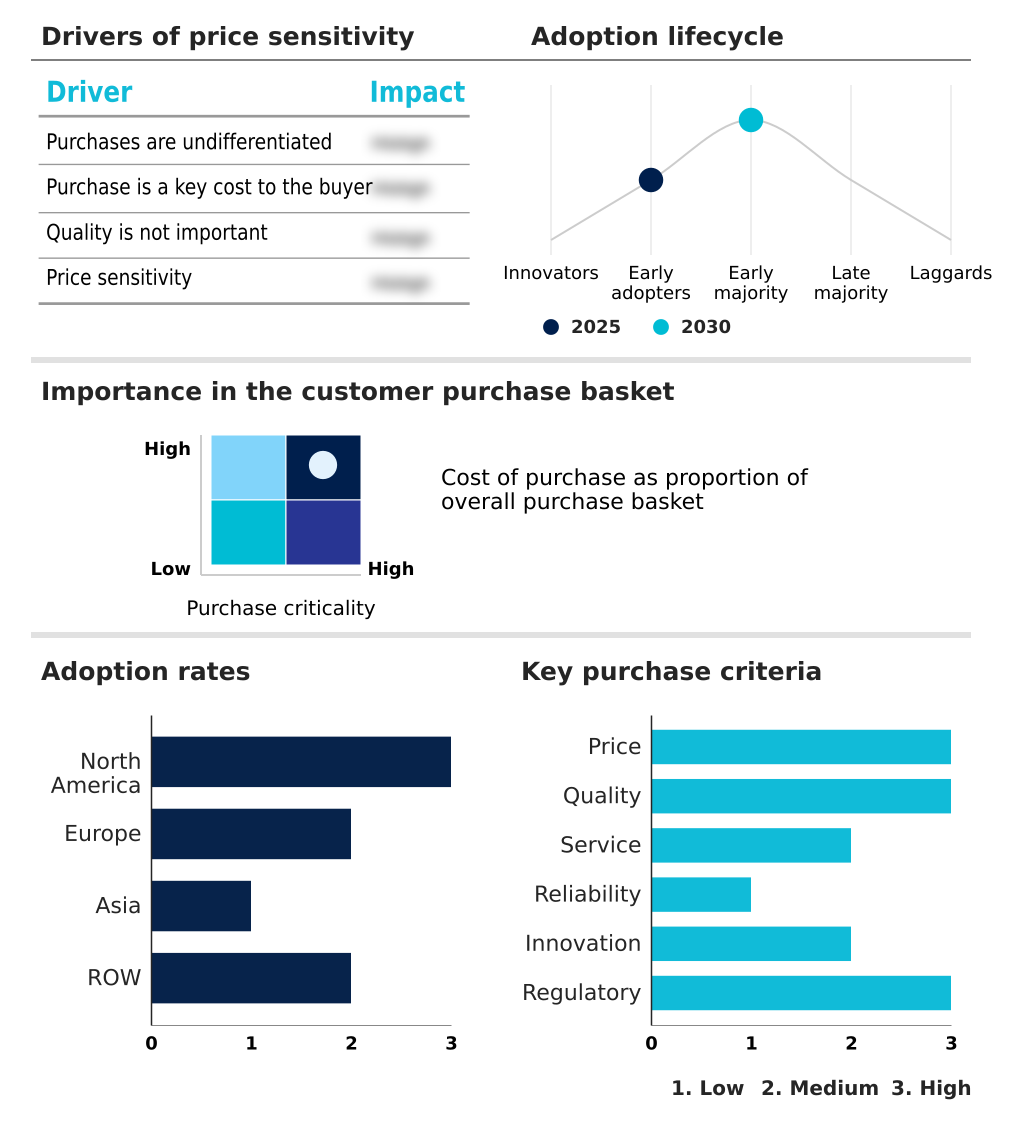
Customer Landscape of Chronic Myelogenous Leukemia Therapeutics Industry

Competitive Landscape

Companies are implementing various strategies, such as strategic alliances, chronic myelogenous leukemia therapeutics market forecast, partnerships, mergers and acquisitions, geographical expansion, and product/service launches, to enhance their presence in the industry.

Accord Healthcare Ltd. - Key offerings include advanced tyrosine kinase inhibitors like Gleevec, Tasigna, Sprycel, and Bosulif, which form the core of targeted CML therapy protocols across multiple lines of treatment.

The industry research and growth report includes detailed analyses of the competitive landscape of the market and information about key companies, including:

  • Accord Healthcare Ltd.
  • Apotex Inc.
  • Ascentage Pharma Group Intl.
  • Aurobindo Pharma Ltd.
  • Be One Medicines AG
  • Bristol Myers Squibb Co.
  • Cipla Inc.
  • Dr. Reddys Laboratories Ltd.
  • Glenmark Pharmaceuticals Ltd.
  • Hansoh Pharmaceutical Group Co. Ltd.
  • Hikma Pharmaceuticals Plc
  • Innovent Biologics Inc.
  • Lupin Ltd.
  • Natco Pharma Ltd.
  • Novartis AG
  • Pfizer Inc.
  • Sun Pharmaceutical Industries
  • Takeda Pharmaceutical Ltd.
  • Teva Pharmaceutical Ltd.
  • Zydus Lifesciences Ltd.

Qualitative and quantitative analysis of companies has been conducted to help clients understand the wider business environment as well as the strengths and weaknesses of key industry players. Data is qualitatively analyzed to categorize companies as pure play, category-focused, industry-focused, and diversified; it is quantitatively analyzed to categorize companies as dominant, leading, strong, tentative, and weak.

Recent Development and News in Chronic myelogenous leukemia therapeutics market

  • In November, 2024, the United States Food and Drug Administration granted accelerated approval for asciminib as a first-line treatment for adults with newly diagnosed Philadelphia chromosome-positive chronic myelogenous leukemia in the chronic phase.
  • In January, 2025, Handa Therapeutics completed the acquisition of the FDA-approved chronic myelogenous leukemia drug Phyrago, which consists of dasatinib tablets, for an undisclosed sum, strengthening its portfolio of oral targeted therapies.
  • In April, 2025, Xspray Pharma advanced its proprietary amorphous technology platform to support the commercialization of Dasynoc, an optimized version of dasatinib designed to enhance bioavailability and eliminate food-effect restrictions.
  • In May, 2025, the M.D. Anderson Cancer Center initiated a significant Phase II clinical trial to investigate the efficacy of a combination therapy involving decitabine, cedazuridine, and dasatinib for patients with newly diagnosed CML in the chronic phase.

Dive into Technavio’s robust research methodology, blending expert interviews, extensive data synthesis, and validated models for unparalleled Chronic Myelogenous Leukemia Therapeutics Market insights. See full methodology.

Market Scope
Page number 298
Base year 2025
Historic period 2020-2024
Forecast period 2026-2030
Growth momentum & CAGR Accelerate at a CAGR of 5.8%
Market growth 2026-2030 USD 2237.5 million
Market structure Fragmented
YoY growth 2025-2026(%) 5.5%
Key countries US, Canada, Mexico, Germany, UK, France, Italy, Spain, The Netherlands, China, Japan, India, South Korea, Thailand, Indonesia, Brazil, Saudi Arabia, South Africa, Argentina, Turkey, UAE, Israel and Colombia
Competitive landscape Leading Companies, Market Positioning of Companies, Competitive Strategies, and Industry Risks

Request Free Sample

Research Analyst Overview

  • The market is defined by a relentless pursuit of therapies that can overcome the complexities of the Philadelphia chromosome and its resultant BCR-ABL1 fusion protein. The evolution from first-generation tyrosine kinase inhibitors to highly specific allosteric inhibitors, which utilize allosteric site binding instead of being merely ATP-competitive inhibitors, marks a significant leap.
  • This addresses the T315I gatekeeper mutation and other kinase domain mutations that cause multi-drug resistance. A key boardroom focus is on patient retention, as nearly 30% of patients struggle with adherence, driving R&D toward better tyrosine kinase inhibitor formulations using amorphous solid dispersions and nanoparticle-based delivery.
  • Advanced digital PCR monitoring now allows for precise minimal residual disease detection, supporting treatment-free remission strategies. The pipeline is exploring bivalent inhibitors, protein degraders, and a novel peptide-based vaccine. Furthermore, the push for a functional cure involves genotype-agnostic therapies leveraging ELANE pathway activation and synergistic immunotherapy to eradicate leukemic stem cells.
  • This is complemented by established options like peginterferon alfa-2a, interferon-alpha derivatives, and cytotoxic agents for hematologic stabilization before allogeneic stem cell transplantation. The integration of real-world evidence, genomic profiling, and dose-adjusted protocols, alongside investigational hypomethylating agents, underscores the move toward deeply personalized medicine.

What are the Key Data Covered in this Chronic Myelogenous Leukemia Therapeutics Market Research and Growth Report?

  • What is the expected growth of the Chronic Myelogenous Leukemia Therapeutics Market between 2026 and 2030?

    • USD 2.24 billion, at a CAGR of 5.8%

  • What segmentation does the market report cover?

    • The report is segmented by Product (Targeted therapy, Chemotherapy, and Immunotherapy), Route of Administration (Oral, Intravenous, Subcutaneous, and Others), Type (First-line, Second-line, and Third-line and beyond) and Geography (North America, Europe, Asia, Rest of World (ROW))

  • Which regions are analyzed in the report?

    • North America, Europe, Asia and Rest of World (ROW)

  • What are the key growth drivers and market challenges?

    • Advancements in precision oncology and industrialization of STAMP inhibitors, Targeted therapy resistance and BCR-ABL genomic complexity

  • Who are the major players in the Chronic Myelogenous Leukemia Therapeutics Market?

    • Accord Healthcare Ltd., Apotex Inc., Ascentage Pharma Group Intl., Aurobindo Pharma Ltd., Be One Medicines AG, Bristol Myers Squibb Co., Cipla Inc., Dr. Reddys Laboratories Ltd., Glenmark Pharmaceuticals Ltd., Hansoh Pharmaceutical Group Co. Ltd., Hikma Pharmaceuticals Plc, Innovent Biologics Inc., Lupin Ltd., Natco Pharma Ltd., Novartis AG, Pfizer Inc., Sun Pharmaceutical Industries, Takeda Pharmaceutical Ltd., Teva Pharmaceutical Ltd. and Zydus Lifesciences Ltd.

Market Research Insights

  • The market is driven by a strategic pivot to precision oncology, where molecular monitoring and genomic complexity analysis guide treatment decisions. This shift emphasizes achieving a functional cure through protocols enabling treatment-free remission eligibility, a strategy shown to reduce long-term healthcare costs by over 25%.
  • Key developments in patient-centric pharmacology, such as formulations that overcome food-effect restrictions, have improved patient adherence strategies, boosting real-world efficacy. The management of chronic adverse effects and drug-to-drug interactions remains a central focus, particularly in geriatrics-focused oncology.
  • Furthermore, the adoption of value-based pricing models, where reimbursement is tied to clinical outcomes, is becoming standard, with some payers reporting a 15% improvement in cost-efficiency for high-cost salvage therapies. This focus on measurable outcomes and patient quality of life defines the current competitive landscape.

We can help! Our analysts can customize this chronic myelogenous leukemia therapeutics market research report to meet your requirements.

Get in touch

1. Executive Summary

1.1 Market overview

Executive Summary - Chart on Market Overview
Executive Summary - Data Table on Market Overview
Executive Summary - Chart on Global Market Characteristics
Executive Summary - Chart on Market by Geography
Executive Summary - Chart on Market Segmentation by Product
Executive Summary - Chart on Market Segmentation by Route of Administration
Executive Summary - Chart on Market Segmentation by Type
Executive Summary - Chart on Incremental Growth
Executive Summary - Data Table on Incremental Growth
Executive Summary - Chart on Company Market Positioning

2. Technavio Analysis

2.1 Analysis of price sensitivity, lifecycle, customer purchase basket, adoption rates, and purchase criteria

2.2 Criticality of inputs and Factors of differentiation

Chart on Overview on criticality of inputs and factors of differentiation

2.3 Factors of disruption

Chart on Overview on factors of disruption

2.4 Impact of drivers and challenges

Chart on Impact of drivers and challenges in 2025 and 2030

3. Market Landscape

3.1 Market ecosystem

Chart on Parent Market
Data Table on - Parent Market

3.2 Market characteristics

Chart on Market characteristics analysis

3.3 Value chain analysis

Chart on Value chain analysis

4. Market Sizing

4.1 Market definition

Data Table on Offerings of companies included in the market definition

4.2 Market segment analysis

Market segments

4.3 Market size 2025

4.4 Market outlook: Forecast for 2025-2030

Chart on Global - Market size and forecast 2025-2030 ($ million)
Data Table on Global - Market size and forecast 2025-2030 ($ million)
Chart on Global Market: Year-over-year growth 2025-2030 (%)
Data Table on Global Market: Year-over-year growth 2025-2030 (%)

5. Historic Market Size

5.1 Global Chronic Myelogenous Leukemia Therapeutics Market 2020 - 2024

Historic Market Size - Data Table on Global Chronic Myelogenous Leukemia Therapeutics Market 2020 - 2024 ($ million)

5.2 Product segment analysis 2020 - 2024

Historic Market Size - Product Segment 2020 - 2024 ($ million)

5.3 Route of Administration segment analysis 2020 - 2024

Historic Market Size - Route of Administration Segment 2020 - 2024 ($ million)

5.4 Type segment analysis 2020 - 2024

Historic Market Size - Type Segment 2020 - 2024 ($ million)

5.5 Geography segment analysis 2020 - 2024

Historic Market Size - Geography Segment 2020 - 2024 ($ million)

5.6 Country segment analysis 2020 - 2024

Historic Market Size - Country Segment 2020 - 2024 ($ million)

6. Qualitative Analysis

6.1 Impact of AI in global chronic myelogenous leukemia therapeutics market

6.2 Impact of geopolitical conflict for global chronic myelogenous leukemia therapeutics market

7. Five Forces Analysis

7.1 Five forces summary

Five forces analysis - Comparison between 2025 and 2030

7.2 Bargaining power of buyers

Bargaining power of buyers - Impact of key factors 2025 and 2030

7.3 Bargaining power of suppliers

Bargaining power of suppliers - Impact of key factors in 2025 and 2030

7.4 Threat of new entrants

Threat of new entrants - Impact of key factors in 2025 and 2030

7.5 Threat of substitutes

Threat of substitutes - Impact of key factors in 2025 and 2030

7.6 Threat of rivalry

Threat of rivalry - Impact of key factors in 2025 and 2030

7.7 Market condition

Chart on Market condition - Five forces 2025 and 2030

8. Market Segmentation by Product

8.1 Market segments

Chart on Product - Market share 2025-2030 (%)
Data Table on Product - Market share 2025-2030 (%)

8.2 Comparison by Product

Chart on Comparison by Product
Data Table on Comparison by Product

8.3 Targeted therapy - Market size and forecast 2025-2030

Chart on Targeted therapy - Market size and forecast 2025-2030 ($ million)
Data Table on Targeted therapy - Market size and forecast 2025-2030 ($ million)
Chart on Targeted therapy - Year-over-year growth 2025-2030 (%)
Data Table on Targeted therapy - Year-over-year growth 2025-2030 (%)

8.4 Chemotherapy - Market size and forecast 2025-2030

Chart on Chemotherapy - Market size and forecast 2025-2030 ($ million)
Data Table on Chemotherapy - Market size and forecast 2025-2030 ($ million)
Chart on Chemotherapy - Year-over-year growth 2025-2030 (%)
Data Table on Chemotherapy - Year-over-year growth 2025-2030 (%)

8.5 Immunotherapy - Market size and forecast 2025-2030

Chart on Immunotherapy - Market size and forecast 2025-2030 ($ million)
Data Table on Immunotherapy - Market size and forecast 2025-2030 ($ million)
Chart on Immunotherapy - Year-over-year growth 2025-2030 (%)
Data Table on Immunotherapy - Year-over-year growth 2025-2030 (%)

8.6 Market opportunity by Product

Market opportunity by Product ($ million)
Data Table on Market opportunity by Product ($ million)

9. Market Segmentation by Route of Administration

9.1 Market segments

Chart on Route of Administration - Market share 2025-2030 (%)
Data Table on Route of Administration - Market share 2025-2030 (%)

9.2 Comparison by Route of Administration

Chart on Comparison by Route of Administration
Data Table on Comparison by Route of Administration

9.3 Oral - Market size and forecast 2025-2030

Chart on Oral - Market size and forecast 2025-2030 ($ million)
Data Table on Oral - Market size and forecast 2025-2030 ($ million)
Chart on Oral - Year-over-year growth 2025-2030 (%)
Data Table on Oral - Year-over-year growth 2025-2030 (%)

9.4 Intravenous - Market size and forecast 2025-2030

Chart on Intravenous - Market size and forecast 2025-2030 ($ million)
Data Table on Intravenous - Market size and forecast 2025-2030 ($ million)
Chart on Intravenous - Year-over-year growth 2025-2030 (%)
Data Table on Intravenous - Year-over-year growth 2025-2030 (%)

9.5 Subcutaneous - Market size and forecast 2025-2030

Chart on Subcutaneous - Market size and forecast 2025-2030 ($ million)
Data Table on Subcutaneous - Market size and forecast 2025-2030 ($ million)
Chart on Subcutaneous - Year-over-year growth 2025-2030 (%)
Data Table on Subcutaneous - Year-over-year growth 2025-2030 (%)

9.6 Others - Market size and forecast 2025-2030

Chart on Others - Market size and forecast 2025-2030 ($ million)
Data Table on Others - Market size and forecast 2025-2030 ($ million)
Chart on Others - Year-over-year growth 2025-2030 (%)
Data Table on Others - Year-over-year growth 2025-2030 (%)

9.7 Market opportunity by Route of Administration

Market opportunity by Route of Administration ($ million)
Data Table on Market opportunity by Route of Administration ($ million)

10. Market Segmentation by Type

10.1 Market segments

Chart on Type - Market share 2025-2030 (%)
Data Table on Type - Market share 2025-2030 (%)

10.2 Comparison by Type

Chart on Comparison by Type
Data Table on Comparison by Type

10.3 First-line - Market size and forecast 2025-2030

Chart on First-line - Market size and forecast 2025-2030 ($ million)
Data Table on First-line - Market size and forecast 2025-2030 ($ million)
Chart on First-line - Year-over-year growth 2025-2030 (%)
Data Table on First-line - Year-over-year growth 2025-2030 (%)

10.4 Second-line - Market size and forecast 2025-2030

Chart on Second-line - Market size and forecast 2025-2030 ($ million)
Data Table on Second-line - Market size and forecast 2025-2030 ($ million)
Chart on Second-line - Year-over-year growth 2025-2030 (%)
Data Table on Second-line - Year-over-year growth 2025-2030 (%)

10.5 Third-line and beyond - Market size and forecast 2025-2030

Chart on Third-line and beyond - Market size and forecast 2025-2030 ($ million)
Data Table on Third-line and beyond - Market size and forecast 2025-2030 ($ million)
Chart on Third-line and beyond - Year-over-year growth 2025-2030 (%)
Data Table on Third-line and beyond - Year-over-year growth 2025-2030 (%)

10.6 Market opportunity by Type

Market opportunity by Type ($ million)
Data Table on Market opportunity by Type ($ million)

11. Customer Landscape

11.1 Customer landscape overview

Analysis of price sensitivity, lifecycle, customer purchase basket, adoption rates, and purchase criteria

12. Geographic Landscape

12.1 Geographic segmentation

Chart on Market share by geography 2025-2030 (%)
Data Table on Market share by geography 2025-2030 (%)

12.2 Geographic comparison

Chart on Geographic comparison
Data Table on Geographic comparison

12.3 North America - Market size and forecast 2025-2030

Chart on North America - Market size and forecast 2025-2030 ($ million)
Data Table on North America - Market size and forecast 2025-2030 ($ million)
Chart on North America - Year-over-year growth 2025-2030 (%)
Data Table on North America - Year-over-year growth 2025-2030 (%)
Chart on Regional Comparison - North America
Data Table on Regional Comparison - North America

12.3.1 US - Market size and forecast 2025-2030

Chart on US - Market size and forecast 2025-2030 ($ million)
Data Table on US - Market size and forecast 2025-2030 ($ million)
Chart on US - Year-over-year growth 2025-2030 (%)
Data Table on US - Year-over-year growth 2025-2030 (%)

12.3.2 Canada - Market size and forecast 2025-2030

Chart on Canada - Market size and forecast 2025-2030 ($ million)
Data Table on Canada - Market size and forecast 2025-2030 ($ million)
Chart on Canada - Year-over-year growth 2025-2030 (%)
Data Table on Canada - Year-over-year growth 2025-2030 (%)

12.3.3 Mexico - Market size and forecast 2025-2030

Chart on Mexico - Market size and forecast 2025-2030 ($ million)
Data Table on Mexico - Market size and forecast 2025-2030 ($ million)
Chart on Mexico - Year-over-year growth 2025-2030 (%)
Data Table on Mexico - Year-over-year growth 2025-2030 (%)

12.4 Europe - Market size and forecast 2025-2030

Chart on Europe - Market size and forecast 2025-2030 ($ million)
Data Table on Europe - Market size and forecast 2025-2030 ($ million)
Chart on Europe - Year-over-year growth 2025-2030 (%)
Data Table on Europe - Year-over-year growth 2025-2030 (%)
Chart on Regional Comparison - Europe
Data Table on Regional Comparison - Europe

12.4.1 Germany - Market size and forecast 2025-2030

Chart on Germany - Market size and forecast 2025-2030 ($ million)
Data Table on Germany - Market size and forecast 2025-2030 ($ million)
Chart on Germany - Year-over-year growth 2025-2030 (%)
Data Table on Germany - Year-over-year growth 2025-2030 (%)

12.4.2 UK - Market size and forecast 2025-2030

Chart on UK - Market size and forecast 2025-2030 ($ million)
Data Table on UK - Market size and forecast 2025-2030 ($ million)
Chart on UK - Year-over-year growth 2025-2030 (%)
Data Table on UK - Year-over-year growth 2025-2030 (%)

12.4.3 France - Market size and forecast 2025-2030

Chart on France - Market size and forecast 2025-2030 ($ million)
Data Table on France - Market size and forecast 2025-2030 ($ million)
Chart on France - Year-over-year growth 2025-2030 (%)
Data Table on France - Year-over-year growth 2025-2030 (%)

12.4.4 Italy - Market size and forecast 2025-2030

Chart on Italy - Market size and forecast 2025-2030 ($ million)
Data Table on Italy - Market size and forecast 2025-2030 ($ million)
Chart on Italy - Year-over-year growth 2025-2030 (%)
Data Table on Italy - Year-over-year growth 2025-2030 (%)

12.4.5 Spain - Market size and forecast 2025-2030

Chart on Spain - Market size and forecast 2025-2030 ($ million)
Data Table on Spain - Market size and forecast 2025-2030 ($ million)
Chart on Spain - Year-over-year growth 2025-2030 (%)
Data Table on Spain - Year-over-year growth 2025-2030 (%)

12.4.6 The Netherlands - Market size and forecast 2025-2030

Chart on The Netherlands - Market size and forecast 2025-2030 ($ million)
Data Table on The Netherlands - Market size and forecast 2025-2030 ($ million)
Chart on The Netherlands - Year-over-year growth 2025-2030 (%)
Data Table on The Netherlands - Year-over-year growth 2025-2030 (%)

12.5 Asia - Market size and forecast 2025-2030

Chart on Asia - Market size and forecast 2025-2030 ($ million)
Data Table on Asia - Market size and forecast 2025-2030 ($ million)
Chart on Asia - Year-over-year growth 2025-2030 (%)
Data Table on Asia - Year-over-year growth 2025-2030 (%)
Chart on Regional Comparison - Asia
Data Table on Regional Comparison - Asia

12.5.1 China - Market size and forecast 2025-2030

Chart on China - Market size and forecast 2025-2030 ($ million)
Data Table on China - Market size and forecast 2025-2030 ($ million)
Chart on China - Year-over-year growth 2025-2030 (%)
Data Table on China - Year-over-year growth 2025-2030 (%)

12.5.2 Japan - Market size and forecast 2025-2030

Chart on Japan - Market size and forecast 2025-2030 ($ million)
Data Table on Japan - Market size and forecast 2025-2030 ($ million)
Chart on Japan - Year-over-year growth 2025-2030 (%)
Data Table on Japan - Year-over-year growth 2025-2030 (%)

12.5.3 India - Market size and forecast 2025-2030

Chart on India - Market size and forecast 2025-2030 ($ million)
Data Table on India - Market size and forecast 2025-2030 ($ million)
Chart on India - Year-over-year growth 2025-2030 (%)
Data Table on India - Year-over-year growth 2025-2030 (%)

12.5.4 South Korea - Market size and forecast 2025-2030

Chart on South Korea - Market size and forecast 2025-2030 ($ million)
Data Table on South Korea - Market size and forecast 2025-2030 ($ million)
Chart on South Korea - Year-over-year growth 2025-2030 (%)
Data Table on South Korea - Year-over-year growth 2025-2030 (%)

12.5.5 Thailand - Market size and forecast 2025-2030

Chart on Thailand - Market size and forecast 2025-2030 ($ million)
Data Table on Thailand - Market size and forecast 2025-2030 ($ million)
Chart on Thailand - Year-over-year growth 2025-2030 (%)
Data Table on Thailand - Year-over-year growth 2025-2030 (%)

12.5.6 Indonesia - Market size and forecast 2025-2030

Chart on Indonesia - Market size and forecast 2025-2030 ($ million)
Data Table on Indonesia - Market size and forecast 2025-2030 ($ million)
Chart on Indonesia - Year-over-year growth 2025-2030 (%)
Data Table on Indonesia - Year-over-year growth 2025-2030 (%)

12.6 Rest of World (ROW) - Market size and forecast 2025-2030

Chart on Rest of World (ROW) - Market size and forecast 2025-2030 ($ million)
Data Table on Rest of World (ROW) - Market size and forecast 2025-2030 ($ million)
Chart on Rest of World (ROW) - Year-over-year growth 2025-2030 (%)
Data Table on Rest of World (ROW) - Year-over-year growth 2025-2030 (%)
Chart on Regional Comparison - Rest of World (ROW)
Data Table on Regional Comparison - Rest of World (ROW)

12.6.1 Brazil - Market size and forecast 2025-2030

Chart on Brazil - Market size and forecast 2025-2030 ($ million)
Data Table on Brazil - Market size and forecast 2025-2030 ($ million)
Chart on Brazil - Year-over-year growth 2025-2030 (%)
Data Table on Brazil - Year-over-year growth 2025-2030 (%)

12.6.2 Saudi Arabia - Market size and forecast 2025-2030

Chart on Saudi Arabia - Market size and forecast 2025-2030 ($ million)
Data Table on Saudi Arabia - Market size and forecast 2025-2030 ($ million)
Chart on Saudi Arabia - Year-over-year growth 2025-2030 (%)
Data Table on Saudi Arabia - Year-over-year growth 2025-2030 (%)

12.6.3 South Africa - Market size and forecast 2025-2030

Chart on South Africa - Market size and forecast 2025-2030 ($ million)
Data Table on South Africa - Market size and forecast 2025-2030 ($ million)
Chart on South Africa - Year-over-year growth 2025-2030 (%)
Data Table on South Africa - Year-over-year growth 2025-2030 (%)

12.6.4 Argentina - Market size and forecast 2025-2030

Chart on Argentina - Market size and forecast 2025-2030 ($ million)
Data Table on Argentina - Market size and forecast 2025-2030 ($ million)
Chart on Argentina - Year-over-year growth 2025-2030 (%)
Data Table on Argentina - Year-over-year growth 2025-2030 (%)

12.6.5 Turkey - Market size and forecast 2025-2030

Chart on Turkey - Market size and forecast 2025-2030 ($ million)
Data Table on Turkey - Market size and forecast 2025-2030 ($ million)
Chart on Turkey - Year-over-year growth 2025-2030 (%)
Data Table on Turkey - Year-over-year growth 2025-2030 (%)

12.6.6 UAE - Market size and forecast 2025-2030

Chart on UAE - Market size and forecast 2025-2030 ($ million)
Data Table on UAE - Market size and forecast 2025-2030 ($ million)
Chart on UAE - Year-over-year growth 2025-2030 (%)
Data Table on UAE - Year-over-year growth 2025-2030 (%)

12.6.7 Israel - Market size and forecast 2025-2030

Chart on Israel - Market size and forecast 2025-2030 ($ million)
Data Table on Israel - Market size and forecast 2025-2030 ($ million)
Chart on Israel - Year-over-year growth 2025-2030 (%)
Data Table on Israel - Year-over-year growth 2025-2030 (%)

12.6.8 Colombia - Market size and forecast 2025-2030

Chart on Colombia - Market size and forecast 2025-2030 ($ million)
Data Table on Colombia - Market size and forecast 2025-2030 ($ million)
Chart on Colombia - Year-over-year growth 2025-2030 (%)
Data Table on Colombia - Year-over-year growth 2025-2030 (%)

12.7 Market opportunity by geography

Market opportunity by geography ($ million)
Data Tables on Market opportunity by geography ($ million)

13. Drivers, Challenges, and Opportunity

13.1 Market drivers

Advancements in precision oncology and industrialization of STAMP inhibitors
Strategic shift toward treatment-free remission and enhanced molecular
Evolution of geriatric-focused care and demand for targeted low-toxicity

13.2 Market challenges

Targeted therapy resistance and BCR-ABL genomic complexity
Financial burden and global reimbursement framework resistance
Treatment adherence struggles and chronic adverse effects

13.3 Impact of drivers and challenges

Impact of drivers and challenges in 2025 and 2030

13.4 Market opportunities

Institutionalization of AI-enabled molecular monitoring and precision diagnostics
Growth of differentiated tyrosine kinase inhibitor and bioavailability
Expansion of innate immune system activation and ELANE pathway targeting

14. Competitive Landscape

14.1 Overview

14.2

Overview on criticality of inputs and factors of differentiation

14.3 Landscape disruption

Overview on factors of disruption

14.4 Industry risks

Impact of key risks on business

15. Competitive Analysis

15.1 Companies profiled

Companies covered

15.2 Company ranking index

15.3 Market positioning of companies

Matrix on companies position and classification

15.4 Ascentage Pharma Group Intl.

Ascentage Pharma Group Intl. - Overview
Ascentage Pharma Group Intl. - Product / Service
Ascentage Pharma Group Intl. - Key offerings
SWOT

15.5 Aurobindo Pharma Ltd.

Aurobindo Pharma Ltd. - Overview
Aurobindo Pharma Ltd. - Product / Service
Aurobindo Pharma Ltd. - Key news
Aurobindo Pharma Ltd. - Key offerings
SWOT

15.6 Bristol Myers Squibb Co.

Bristol Myers Squibb Co. - Overview
Bristol Myers Squibb Co. - Product / Service
Bristol Myers Squibb Co. - Key news
Bristol Myers Squibb Co. - Key offerings
SWOT

15.7 Cipla Inc.

Cipla Inc. - Overview
Cipla Inc. - Business segments
Cipla Inc. - Key news
Cipla Inc. - Key offerings
Cipla Inc. - Segment focus
SWOT

15.8 Dr. Reddys Laboratories Ltd.

Dr. Reddys Laboratories Ltd. - Overview
Dr. Reddys Laboratories Ltd. - Business segments
Dr. Reddys Laboratories Ltd. - Key news
Dr. Reddys Laboratories Ltd. - Key offerings
Dr. Reddys Laboratories Ltd. - Segment focus
SWOT

15.9 Glenmark Pharmaceuticals Ltd.

Glenmark Pharmaceuticals Ltd. - Overview
Glenmark Pharmaceuticals Ltd. - Product / Service
Glenmark Pharmaceuticals Ltd. - Key news
Glenmark Pharmaceuticals Ltd. - Key offerings
SWOT

15.10 Hikma Pharmaceuticals Plc

Hikma Pharmaceuticals Plc - Overview
Hikma Pharmaceuticals Plc - Business segments
Hikma Pharmaceuticals Plc - Key news
Hikma Pharmaceuticals Plc - Key offerings
Hikma Pharmaceuticals Plc - Segment focus
SWOT

15.11 Lupin Ltd.

Lupin Ltd. - Overview
Lupin Ltd. - Business segments
Lupin Ltd. - Key news
Lupin Ltd. - Key offerings
Lupin Ltd. - Segment focus
SWOT

15.12 Natco Pharma Ltd.

Natco Pharma Ltd. - Overview
Natco Pharma Ltd. - Product / Service
Natco Pharma Ltd. - Key news
Natco Pharma Ltd. - Key offerings
SWOT

15.13 Novartis AG

Novartis AG - Overview
Novartis AG - Business segments
Novartis AG - Key news
Novartis AG - Key offerings
Novartis AG - Segment focus
SWOT

15.14 Pfizer Inc.

Pfizer Inc. - Overview
Pfizer Inc. - Business segments
Pfizer Inc. - Key news
Pfizer Inc. - Key offerings
Pfizer Inc. - Segment focus
SWOT

15.15 Sun Pharmaceutical Industries

Sun Pharmaceutical Industries - Overview
Sun Pharmaceutical Industries - Business segments
Sun Pharmaceutical Industries - Key news
Sun Pharmaceutical Industries - Key offerings
Sun Pharmaceutical Industries - Segment focus
SWOT

15.16 Takeda Pharmaceutical Ltd.

Takeda Pharmaceutical Ltd. - Overview
Takeda Pharmaceutical Ltd. - Business segments
Takeda Pharmaceutical Ltd. - Key news
Takeda Pharmaceutical Ltd. - Key offerings
Takeda Pharmaceutical Ltd. - Segment focus
SWOT

15.17 Teva Pharmaceutical Ltd.

Teva Pharmaceutical Ltd. - Overview
Teva Pharmaceutical Ltd. - Business segments
Teva Pharmaceutical Ltd. - Key news
Teva Pharmaceutical Ltd. - Key offerings
Teva Pharmaceutical Ltd. - Segment focus
SWOT

15.18 Zydus Lifesciences Ltd.

Zydus Lifesciences Ltd. - Overview
Zydus Lifesciences Ltd. - Business segments
Zydus Lifesciences Ltd. - Key news
Zydus Lifesciences Ltd. - Key offerings
Zydus Lifesciences Ltd. - Segment focus
SWOT

16. Appendix

16.1 Scope of the report

Market definition
Objectives
Notes and caveats

16.2 Inclusions and exclusions checklist

Inclusions checklist
Exclusions checklist

16.3 Currency conversion rates for US$

16.4 Research methodology

16.5 Data procurement

Information sources

16.6 Data validation

16.7 Validation techniques employed for market sizing

16.8 Data synthesis

16.9 360 degree market analysis

16.10 List of abbreviations

Research Methodology

Technavio presents a detailed picture of the market by way of study, synthesis, and summation of data from multiple sources. The analysts have presented the various facets of the market with a particular focus on identifying the key industry influencers. The data thus presented is comprehensive, reliable, and the result of extensive research, both primary and secondary.

INFORMATION SOURCES

Primary sources

  • Manufacturers and suppliers
  • Channel partners
  • Industry experts
  • Strategic decision makers

Secondary sources

  • Industry journals and periodicals
  • Government data
  • Financial reports of key industry players
  • Historical data
  • Press releases

DATA ANALYSIS

Data Synthesis

  • Collation of data
  • Estimation of key figures
  • Analysis of derived insights

Data Validation

  • Triangulation with data models
  • Reference against proprietary databases
  • Corroboration with industry experts

REPORT WRITING

Qualitative

  • Market drivers
  • Market challenges
  • Market trends
  • Five forces analysis

Quantitative

  • Market size and forecast
  • Market segmentation
  • Geographical insights
  • Competitive landscape

Interested in this report?

Get your sample now to see our research methodology and insights!

Download Now

Frequently Asked Questions

Chronic Myelogenous Leukemia Therapeutics market growth will increase by USD 2237.5 million during 2026-2030.

The Chronic Myelogenous Leukemia Therapeutics market is expected to grow at a CAGR of 5.8% during 2026-2030.

Chronic Myelogenous Leukemia Therapeutics market is segmented by Product (Targeted therapy, Chemotherapy, Immunotherapy) Route of administration (Oral, Intravenous, Subcutaneous, Others) Type (First-line, Second-line, Third-line and beyond)

Accord Healthcare Ltd., Apotex Inc., Ascentage Pharma Group Intl., Aurobindo Pharma Ltd., Be One Medicines AG, Bristol Myers Squibb Co., Cipla Inc., Dr. Reddys Laboratories Ltd., Glenmark Pharmaceuticals Ltd., Hansoh Pharmaceutical Group Co. Ltd., Hikma Pharmaceuticals Plc, Innovent Biologics Inc., Lupin Ltd., Natco Pharma Ltd., Novartis AG, Pfizer Inc., Sun Pharmaceutical Industries, Takeda Pharmaceutical Ltd., Teva Pharmaceutical Ltd., Zydus Lifesciences Ltd. are a few of the key vendors in the Chronic Myelogenous Leukemia Therapeutics market.

North America will register the highest growth rate of 38.2% among the other regions. Therefore, the Chronic Myelogenous Leukemia Therapeutics market in North America is expected to garner significant business opportunities for the vendors during the forecast period.

US, Canada, Mexico, Germany, UK, France, Italy, Spain, The Netherlands, China, Japan, India, South Korea, Thailand, Indonesia, Brazil, Saudi Arabia, South Africa, Argentina, Turkey, UAE, Israel, Colombia

  • Advancements in precision oncology and industrialization of STAMP inhibitors is the driving factor this market.

The Chronic Myelogenous Leukemia Therapeutics market vendors should focus on grabbing business opportunities from the Product segment as it accounted for the largest market share in the base year.
RIA - Research AI Assistant
Ask RIA