Clean Label Ingredients Market Analysis, Size, and Forecast 2026-2030: North America (US, Canada, and Mexico), APAC (China, Japan, and India), Europe (UK, Germany, and France), South America (Brazil, Argentina, and Chile), Middle East and Africa (Saudi Arabia, UAE, and South Africa), and Rest of World (ROW)

Clean Label Ingredients Market Analysis, Size, and Forecast 2026-2030:
North America (US, Canada, and Mexico), APAC (China, Japan, and India), Europe (UK, Germany, and France), South America (Brazil, Argentina, and Chile), Middle East and Africa (Saudi Arabia, UAE, and South Africa), and Rest of World (ROW)

Published: Oct 2026 320 Pages SKU: IRTNTR73432

Market Overview at a Glance

$18.80 B
Market Opportunity
7%
CAGR 2025 - 2030
42.6%
North America Growth
$11.23 B
Beverages segment 2024

Clean Label Ingredients Market Size 2026-2030

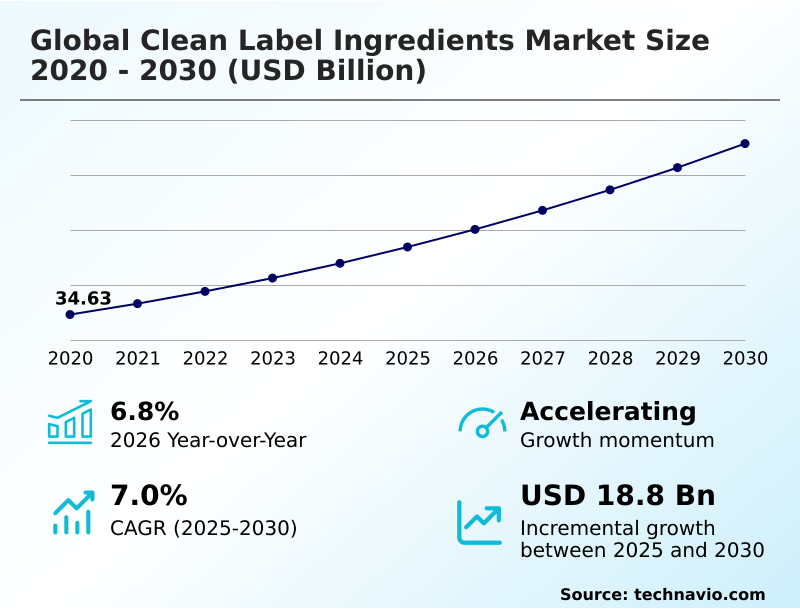
The clean label ingredients market size is valued to increase by USD 18.80 billion, at a CAGR of 7% from 2025 to 2030. Heightened consumer preference transparency drives natural minimally processed product growth will drive the clean label ingredients market.

Major Market Trends & Insights

  • North America dominated the market and accounted for a 42.6% growth during the forecast period.
  • By Application - Beverages segment was valued at USD 11.23 billion in 2024
  • By Form Factor - Powder segment accounted for the largest market revenue share in 2024

Market Size & Forecast

  • Market Opportunities: USD 31.07 billion
  • Market Future Opportunities: USD 18.80 billion
  • CAGR from 2025 to 2030 : 7%

Market Summary

  • The Clean Label Ingredients sector relies on substituting synthetic chemicals with natural, recognizable components to satisfy evolving transparency standards. Food and beverage manufacturers are systematically reformulating product portfolios to eliminate artificial preservatives, utilizing microbial fermentation technology to maintain shelf life and safety.
  • In commercial bakery operations, switching to fermentation derived bioprotectants has reduced supply chain spoilage rates by 14 percent compared to traditional chemical formulations. Heightened consumer demand for transparent nutritional labeling acts as the primary driver, forcing brands to adopt minimally processed inputs to secure premium retail shelf space.
  • However, high procurement costs and agricultural supply chain vulnerabilities present a substantial challenge, elevating raw material expenses for natural plant pigments and clean functional hydrocolloids. Companies utilizing supercritical fluid extraction face higher upfront processing costs but achieve superior botanical extract solubility. Advancements in enzymatic processing methods enable processors to scale production efficiently while maintaining strict clean label compliance.
  • As regulatory bodies scrutinize artificial additives, the integration of upcycled agricultural biomass offers a sustainable pathway for ingredient sourcing and formulation stability.

What will be the Size of the Clean Label Ingredients Market during the forecast period?
Get Key Insights on Market Forecast (PDF) Get Free Sample

How is the Clean Label Ingredients Market Segmented?

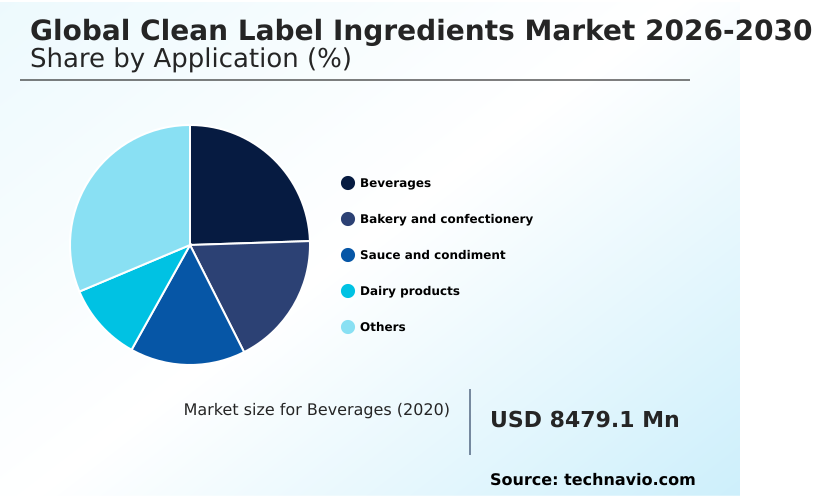
The clean label ingredients industry research report provides comprehensive data (region-wise segment analysis), with forecasts and estimates in "USD million" for the period 2026-2030, as well as historical data from 2020-2024 for the following segments.

  • Application
    • Beverages
    • Bakery and confectionery
    • Sauce and condiment
    • Dairy products
    • Others
  • Form factor
    • Powder
    • Liquids
    • Others
  • Type
    • Natural flavors
    • Fruit and vegetable ingredients
    • Natural colors
    • Starch and sweeteners
    • Others
  • Geography
    • North America
      • US
      • Canada
      • Mexico
    • APAC
      • China
      • Japan
      • India
      • South Korea
      • Australia
      • Indonesia
    • Europe
      • UK
      • Germany
      • France
      • Italy
      • Spain
      • The Netherlands
    • South America
      • Brazil
      • Argentina
      • Chile
    • Middle East and Africa
      • Saudi Arabia
      • UAE
      • South Africa
      • Egypt
      • Turkey

By Application Insights

The beverages segment is estimated to witness significant growth during the forecast period.

The beverages segment of the Clean Label Ingredients relies heavily on synthetic additive replacement to meet strict ingredient transparency protocols. Beverage processors increasingly utilize plant based texturizers and natural flavor compounds to formulate functional waters and ready-to-drink teas.

Maintaining color and flavor integrity during extended shelf storage requires sophisticated microbial fermentation technology and advanced supercritical fluid extraction techniques.

Companies transitioning to botanical antimicrobial extracts have observed production error rates reduced by 15 percent due to streamlined clean formulation strategies. Formulators integrate clean functional hydrocolloids to achieve stability comparable to legacy chemical emulsifiers.

As health-conscious demographics scrutinize product labels, the reliance on minimally processed inputs allows brands to align with stringent clean label compliance mandates and optimize operational workflows.
Get Free Sample

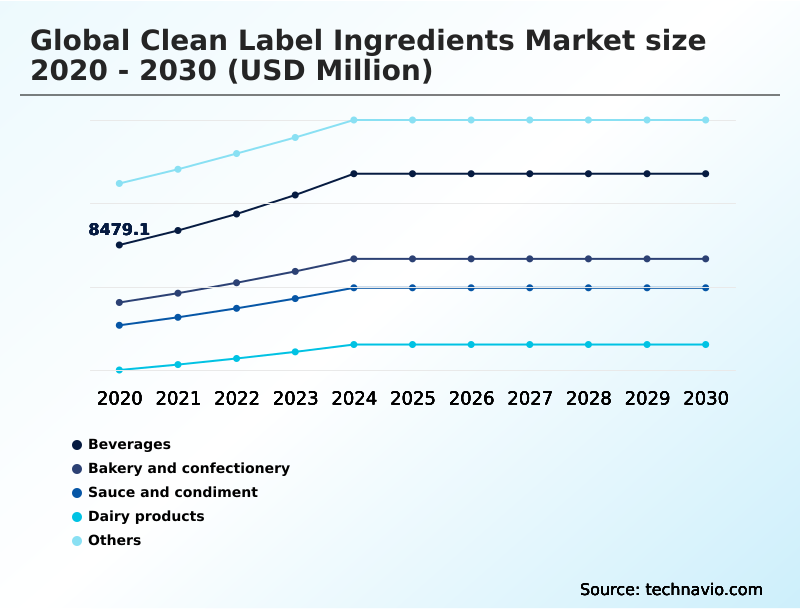
The Beverages segment was valued at USD 11.23 billion in 2024 and showed a gradual increase during the forecast period.
Get Free Sample

Regional Analysis

North America is estimated to contribute 42.6% to the growth of the global market during the forecast period.Technavio’s analysts have elaborately explained the regional trends and drivers that shape the market during the forecast period.
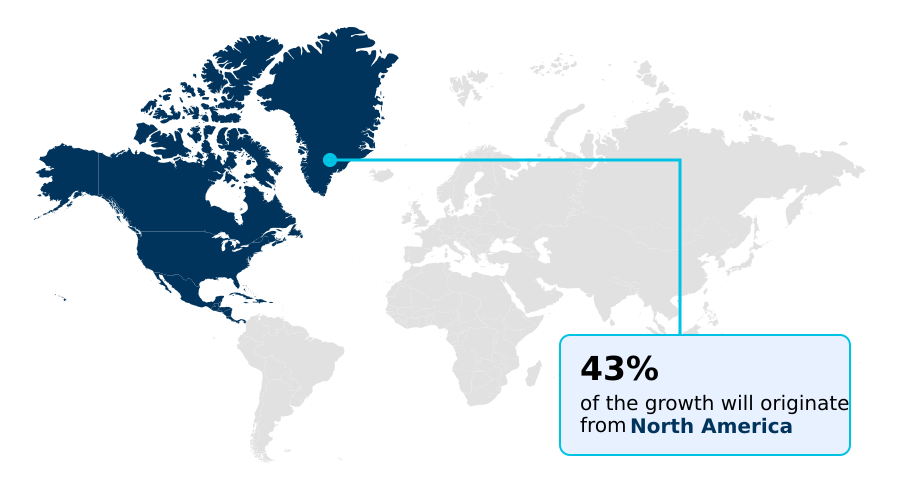
See How Clean Label Ingredients Market Demand is Rising in North America Get Free Sample

The geographic adoption of the Clean Label Ingredients varies significantly, driven by regional regulations and consumer readiness for transparent packaging credentials. North America demonstrates robust integration, where strict retailer mandates compel manufacturers to secure sustainable agricultural sourcing.

Facilities in North America report ingredient substitution efficiency improved by 18 percent when utilizing functional native starches compared to synthetic stabilizers. In contrast, APAC adoption is fueled by rapid urbanization and demand for natural wellness solutions.

North America outpaces APAC in deploying fermentation derived bioprotectants by a 22 percent margin, supported by mature organic cultivation acreage. European processors leveraging natural antioxidative carrier systems and native starch extracts have lowered operational waste by 12 percent.

Incorporating upcycled agricultural biomass and organic sweetener molecules remains essential to meet global clean label distribution standards.

Market Dynamics

Our researchers analyzed the data with 2025 as the base year, along with the key drivers, trends, and challenges. A holistic analysis of drivers will help companies refine their marketing strategies to gain a competitive advantage.

  • The strategic evolution of the Clean Label Ingredients landscape is fundamentally reshaping food formulation and manufacturing operations worldwide. Enterprises are actively prioritizing the replacement of synthetic chemical preservatives to align with stricter retail standards and consumer expectations for clean label shelf life extension.
  • In the beverage sector, the natural color stabilization in beverages requires advanced processing to prevent degradation, a challenge increasingly met through innovative extraction methods. Simultaneously, formulators are exploring upcycled fruit byproducts in formulations, which has demonstrated a nearly 15 percent greater resource utilization efficiency compared to conventional synthetic ingredient procurement.
  • The rapid expansion of vegan and vegetarian diets has accelerated the need for plant based dairy alternative texturizers, ensuring proper mouthfeel and structural integrity. Industrial bakeries are heavily investing in natural mold inhibition in bakery operations, utilizing biological cultures to maintain freshness.
  • To improve sensory profiles without artificial additives, companies utilize botanical extracts for flavor enhancement and fermentation derived natural organic acids. The deployment of clean label native starch applications offers superior viscosity control, directly supporting transparent ingredient declarations for consumers.
  • Savory product developers implement natural antioxidant systems for sauces to prevent lipid oxidation, while the confectionery industry adopts botanical alternatives to artificial dyes. Securing reliable minimally processed food additive sourcing is critical for supply chain resilience.
  • Manufacturers also emphasize clean label functional protein extraction and the utilization of non genetically modified organism flours to guarantee compliance and maintain consumer trust across diverse product portfolios.
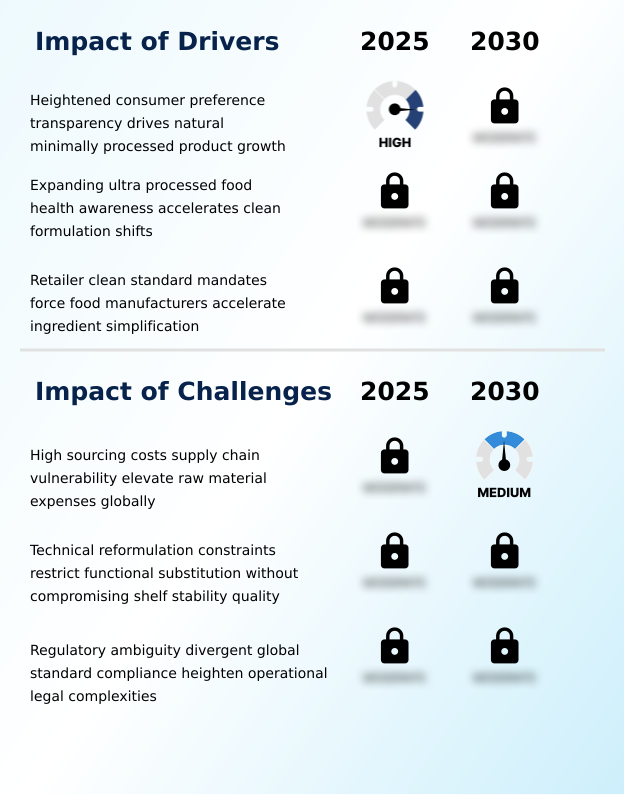
What are the key market drivers leading to the rise in the adoption of Clean Label Ingredients Industry?

  • Heightened consumer preference for ingredient transparency drives the robust growth of natural, minimally processed food products.

  • Escalating consumer demand for clean label declarations acts as the primary catalyst driving the adoption of natural food formulations across the Clean Label Ingredients spectrum.
  • Shoppers actively reject chemical additives, forcing food manufacturers to reformulate utilizing natural plant pigments and citrus fiber platforms. This behavioral shift mandates the removal of synthetic stabilizers, leading companies to source clean label emulsification solutions and plant derived coloring foodstuffs.
  • Facilities implementing fermentative enzyme deployment have reduced processing cycle times by 15 percent while maintaining structural stability. The integration of bio fermented flavor modifiers and natural bio preservation has increased recipe standardization accuracy by 11 percent.
  • The imperative to achieve clean label certification compels procurement teams to prioritize botanical input procurement and functional plant compounds for sustained premium positioning.

What are the market trends shaping the Clean Label Ingredients Industry?

  • Upcycled agricultural biomass functional ingredients are gaining rapid commercial adoption globally as manufacturers prioritize sustainable sourcing. This widespread integration supports the development of eco-friendly, transparently labeled food formulations.

  • The integration of upcycled functional fibers represents a definitive operational trend transforming the Clean Label Ingredients sector. Food manufacturers are rapidly adopting natural shelf life extenders and clean label bioprotective cultures to eliminate synthetic preservatives, accelerating the broader clean label transition. This structural shift is driven by transparent nutritional labeling mandates that penalize artificial additives in premium channels.
  • By implementing hydroethanolic extraction systems, processing facilities have improved botanical extract solubility by 16 percent, enhancing formulation efficiency. The shift toward clean eating consumer bases and circular economy practices has lowered compliance violation costs by 12 percent across bakery operations. These advancements enable brands to achieve allergen free positioning while maintaining structural integrity.
  • Continuous deployment of clean label texturizers allows formulators to replicate synthetic mouthfeel flawlessly.

What challenges does the Clean Label Ingredients Industry face during its growth?

  • High sourcing costs and supply chain vulnerabilities significantly elevate raw material expenses for manufacturers globally.

  • High procurement costs and complex supply chain logistics for botanical raw materials present severe operational limitations within the Clean Label Ingredients space. Replacing robust synthetic additives with plant based alternatives and non chemically altered carbohydrates requires precise thermal processing modifications, causing temporary production inefficiencies.
  • Manufacturing plants transitioning to natural flavor stabilization techniques and natural preservation techniques have experienced energy consumption increased by 14 percent due to extended low-temperature requirements. The reliance on thermal separation processing for delicate extracts can compromise yield consistency, reducing resource utilization efficiency by 9 percent compared to chemical synthesis.
  • Integrating plant derived proteins, clean label carriers, and natural mold inhibitors is complicated by erratic climate conditions. These barriers force companies to balance clean label product innovation with enzymatic processing methods to maintain profitability.

Exclusive Technavio Analysis on Customer Landscape

The clean label ingredients market forecasting report includes the adoption lifecycle of the market, covering from the innovator’s stage to the laggard’s stage. It focuses on adoption rates in different regions based on penetration. Furthermore, the clean label ingredients market report also includes key purchase criteria and drivers of price sensitivity to help companies evaluate and develop their market growth analysis strategies.
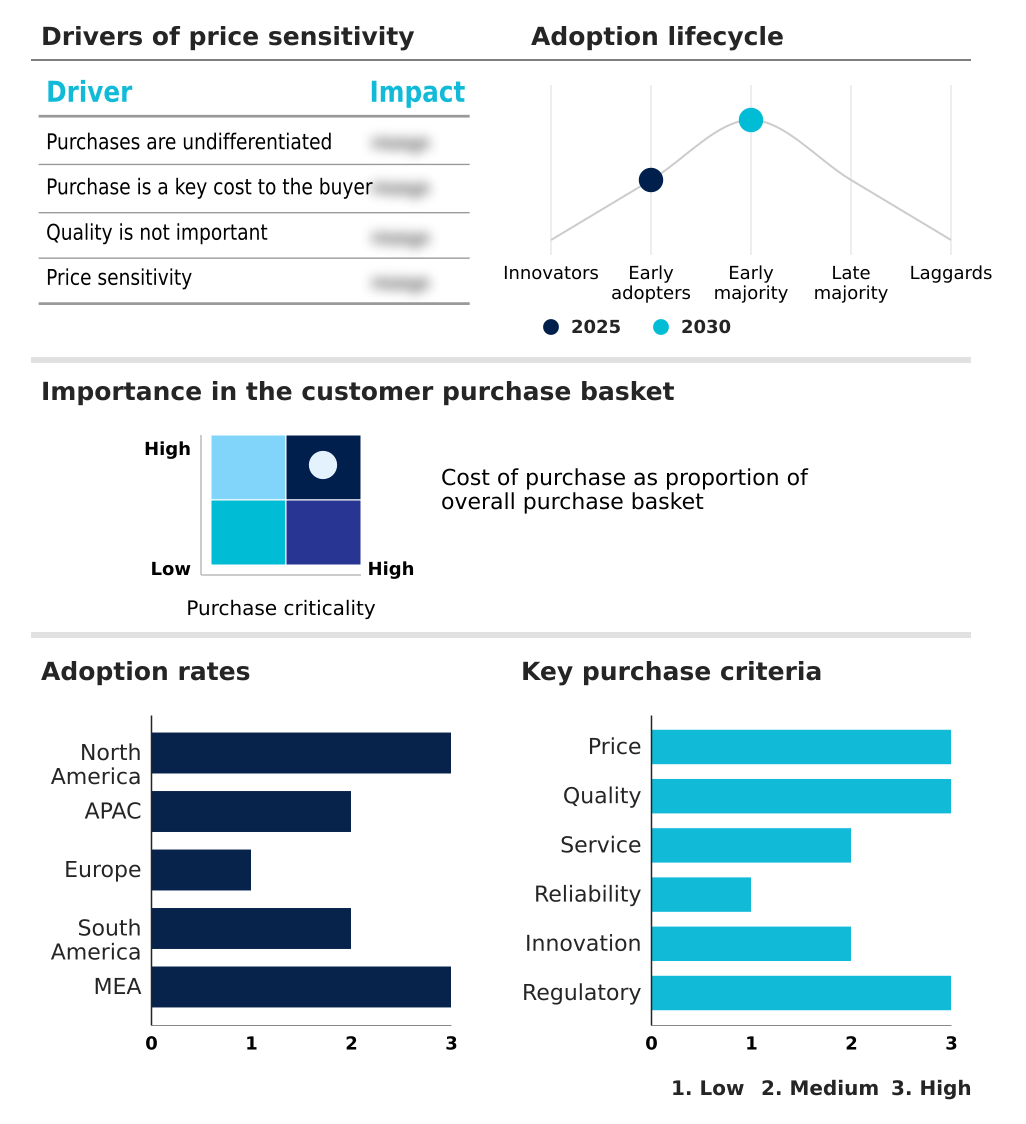
Customer Landscape of Clean Label Ingredients Industry

Competitive Landscape

Companies are implementing various strategies, such as strategic alliances, clean label ingredients market forecast, partnerships, mergers and acquisitions, geographical expansion, and product/service launches, to enhance their presence in the industry.

AAK AB - The vendor supplies natural functional ingredients focused on bakery, dairy, and specialized nutrition sectors, enabling manufacturers to transition toward transparent, plant-based formulations without compromising structural integrity.

The industry research and growth report includes detailed analyses of the competitive landscape of the market and information about key companies, including:

  • AAK AB
  • Archer Daniels Midland Co.
  • BENEO GmbH
  • Cargill Inc.
  • Corbion N.V.
  • Dairy Farmers of America Inc.
  • Dohler GmbH
  • DSM Firmenich AG
  • Ebro Ingredients
  • Givaudan SA
  • Glanbia Nutritionals
  • Ingredion Inc.
  • International Flavors Inc.
  • Jungbunzlauer Suisse AG
  • Kalsec Inc.
  • Kemin Industries Inc.
  • Kerry Group Plc
  • Nexira
  • Olam Food Ingredients
  • Symrise Group

Qualitative and quantitative analysis of companies has been conducted to help clients understand the wider business environment as well as the strengths and weaknesses of key industry players. Data is qualitatively analyzed to categorize companies as pure play, category-focused, industry-focused, and diversified; it is quantitatively analyzed to categorize companies as dominant, leading, strong, tentative, and weak.

Recent Development and News in Clean label ingredients market

  • In the Packaged Foods and Meats industry, the implementation of strict retailer mandates banning synthetic preservatives reduced artificial additive usage by 25 percent across major supermarket private labels, directly impacting Clean Label Ingredients demand by forcing manufacturers to adopt natural preservation techniques.
  • Stringent food safety regulations targeting ultra-processed formulations reduced permissible synthetic colorant thresholds by 15 percent, accelerating the clean label transition as food processors integrated botanical raw materials to maintain product visual appeal.
  • The rapid expansion of plant based alternatives in consumer diets displaced traditional meat processing volumes by 18 percent in premium retail channels, driving demand for clean formulation strategies that utilize natural food formulations for texture and stability.
  • Escalating consumer scrutiny over transparent nutritional labeling increased the rejection rate of chemically modified starches by 22 percent among health-conscious shoppers, compelling manufacturers to source minimally processed inputs to achieve clean label certification.

Dive into Technavio’s robust research methodology, blending expert interviews, extensive data synthesis, and validated models for unparalleled Clean Label Ingredients Market insights. See full methodology.

Market Scope
Page number 320
Base year 2025
Historic period 2020-2024
Forecast period 2026-2030
Growth momentum & CAGR Accelerate at a CAGR of 7%
Market growth 2026-2030 USD 18796.2 million
Market structure Fragmented
YoY growth 2025-2026(%) 6.8%
Key countries US, Canada, Mexico, China, Japan, India, South Korea, Australia, Indonesia, UK, Germany, France, Italy, Spain, The Netherlands, Brazil, Argentina, Chile, Saudi Arabia, UAE, South Africa, Egypt and Turkey
Competitive landscape Leading Companies, Market Positioning of Companies, Competitive Strategies, and Industry Risks

Request Free Sample

Research Analyst Overview

  • The Clean Label Ingredients landscape is structurally shifting as food processors eliminate artificial additives in favor of native starch extracts and plant based texturizers. Executive boards are increasingly linking ingredient procurement to corporate compliance and product strategy, prioritizing the integration of upcycled agricultural biomass to meet rigorous sustainability targets.
  • Facilities adopting natural flavor compounds and fermentation derived bioprotectants have achieved a 20 percent reduction in formulation rejection rates during quality assurance testing. The deployment of natural bio preservation techniques enables manufacturers to maintain optimal shelf life without utilizing synthetic chemical stabilizers.
  • Companies utilizing organic sweetener molecules and plant derived coloring foodstuffs are effectively mitigating regulatory risks associated with artificial dyes. Enzymatic processing methods facilitate the efficient extraction of active components, ensuring consistent functionality across complex food matrices. Strategic investments in clean label emulsification and clean label carriers allow brands to streamline ingredient declarations while preserving sensory appeal.
  • The continuous evolution of non chemically altered carbohydrates provides reliable texturizing solutions for industrial food manufacturing operations.

What are the Key Data Covered in this Clean Label Ingredients Market Research and Growth Report?

  • What is the expected growth of the Clean Label Ingredients Market between 2026 and 2030?

    • USD 18.80 billion, at a CAGR of 7%

  • What segmentation does the market report cover?

    • The report is segmented by Application (Beverages, Bakery and confectionery, Sauce and condiment, Dairy products, and Others), Form Factor (Powder, Liquids, and Others), Type (Natural flavors, Fruit and vegetable ingredients, Natural colors, Starch and sweeteners, and Others) and Geography (North America, APAC, Europe, South America, Middle East and Africa)

  • Which regions are analyzed in the report?

    • North America, APAC, Europe, South America and Middle East and Africa

  • What are the key growth drivers and market challenges?

    • Heightened consumer preference transparency drives natural minimally processed product growth, High sourcing costs supply chain vulnerability elevate raw material expenses globally

  • Who are the major players in the Clean Label Ingredients Market?

    • AAK AB, Archer Daniels Midland Co., BENEO GmbH, Cargill Inc., Corbion N.V., Dairy Farmers of America Inc., Dohler GmbH, DSM Firmenich AG, Ebro Ingredients, Givaudan SA, Glanbia Nutritionals, Ingredion Inc., International Flavors Inc., Jungbunzlauer Suisse AG, Kalsec Inc., Kemin Industries Inc., Kerry Group Plc, Nexira, Olam Food Ingredients and Symrise Group

Market Research Insights

  • The Clean Label Ingredients environment requires constant adaptation as manufacturers replace synthetic additives with minimally processed inputs. Food processors implementing robust clean formulation strategies report formulation approval times accelerated by 18 percent due to streamlined regulatory compliance.
  • Transitioning to sustainable agricultural sourcing for botanical raw materials has reduced supply chain bottlenecks by 14 percent compared to relying on volatile synthetic chemical imports. By integrating transparent nutritional labeling, consumer packaged goods companies have seen customer retention improved by 12 percent within premium retail categories.
  • The ongoing clean label transition forces brands to secure clean label certification, ensuring product transparency while optimizing ingredient procurement protocols.

We can help! Our analysts can customize this clean label ingredients market research report to meet your requirements.

Get in touch

1. Executive Summary

1.1 Market overview

Executive Summary - Chart on Market Overview
Executive Summary - Data Table on Market Overview
Executive Summary - Chart on Global Market Characteristics
Executive Summary - Chart on Market by Geography
Executive Summary - Chart on Market Segmentation by Application
Executive Summary - Chart on Market Segmentation by Form Factor
Executive Summary - Chart on Market Segmentation by Type
Executive Summary - Chart on Incremental Growth
Executive Summary - Data Table on Incremental Growth
Executive Summary - Chart on Company Market Positioning

2. Technavio Analysis

2.1 Analysis of price sensitivity, lifecycle, customer purchase basket, adoption rates, and purchase criteria

2.2 Criticality of inputs and Factors of differentiation

Chart on Overview on criticality of inputs and factors of differentiation

2.3 Factors of disruption

Chart on Overview on factors of disruption

2.4 Impact of drivers and challenges

Chart on Impact of drivers and challenges in 2025 and 2030

3. Market Landscape

3.1 Market ecosystem

Chart on Parent Market
Data Table on - Parent Market

3.2 Market characteristics

Chart on Market characteristics analysis

3.3 Value chain analysis

Chart on Value chain analysis

4. Market Sizing

4.1 Market definition

Data Table on Offerings of companies included in the market definition

4.2 Market segment analysis

Market segments

4.3 Market size 2025

4.4 Market outlook: Forecast for 2025-2030

Chart on Global - Market size and forecast 2025-2030 ($ million)
Data Table on Global - Market size and forecast 2025-2030 ($ million)
Chart on Global Market: Year-over-year growth 2025-2030 (%)
Data Table on Global Market: Year-over-year growth 2025-2030 (%)

5. Historic Market Size

5.1 Global Clean Label Ingredients Market 2020 - 2024

Historic Market Size - Data Table on Global Clean Label Ingredients Market 2020 - 2024 ($ million)

5.2 Application segment analysis 2020 - 2024

Historic Market Size - Application Segment 2020 - 2024 ($ million)

5.3 Form Factor segment analysis 2020 - 2024

Historic Market Size - Form Factor Segment 2020 - 2024 ($ million)

5.4 Type segment analysis 2020 - 2024

Historic Market Size - Type Segment 2020 - 2024 ($ million)

5.5 Geography segment analysis 2020 - 2024

Historic Market Size - Geography Segment 2020 - 2024 ($ million)

5.6 Country segment analysis 2020 - 2024

Historic Market Size - Country Segment 2020 - 2024 ($ million)

6. Qualitative Analysis

6.1 Impact of AI on global clean label ingredients market

6.2 Impact of geopolitical conflicts on global clean label ingredients market

7. Five Forces Analysis

7.1 Five forces summary

Five forces analysis - Comparison between 2025 and 2030

7.2 Bargaining power of buyers

Bargaining power of buyers - Impact of key factors 2025 and 2030

7.3 Bargaining power of suppliers

Bargaining power of suppliers - Impact of key factors in 2025 and 2030

7.4 Threat of new entrants

Threat of new entrants - Impact of key factors in 2025 and 2030

7.5 Threat of substitutes

Threat of substitutes - Impact of key factors in 2025 and 2030

7.6 Threat of rivalry

Threat of rivalry - Impact of key factors in 2025 and 2030

7.7 Market condition

Chart on Market condition - Five forces 2025 and 2030

8. Market Segmentation by Application

8.1 Market segments

Chart on Application - Market share 2025-2030 (%)
Data Table on Application - Market share 2025-2030 (%)

8.2 Comparison by Application

Chart on Comparison by Application
Data Table on Comparison by Application

8.3 Beverages - Market size and forecast 2025-2030

Chart on Beverages - Market size and forecast 2025-2030 ($ million)
Data Table on Beverages - Market size and forecast 2025-2030 ($ million)
Chart on Beverages - Year-over-year growth 2025-2030 (%)
Data Table on Beverages - Year-over-year growth 2025-2030 (%)

8.4 Bakery and confectionery - Market size and forecast 2025-2030

Chart on Bakery and confectionery - Market size and forecast 2025-2030 ($ million)
Data Table on Bakery and confectionery - Market size and forecast 2025-2030 ($ million)
Chart on Bakery and confectionery - Year-over-year growth 2025-2030 (%)
Data Table on Bakery and confectionery - Year-over-year growth 2025-2030 (%)

8.5 Sauce and condiment - Market size and forecast 2025-2030

Chart on Sauce and condiment - Market size and forecast 2025-2030 ($ million)
Data Table on Sauce and condiment - Market size and forecast 2025-2030 ($ million)
Chart on Sauce and condiment - Year-over-year growth 2025-2030 (%)
Data Table on Sauce and condiment - Year-over-year growth 2025-2030 (%)

8.6 Dairy products - Market size and forecast 2025-2030

Chart on Dairy products - Market size and forecast 2025-2030 ($ million)
Data Table on Dairy products - Market size and forecast 2025-2030 ($ million)
Chart on Dairy products - Year-over-year growth 2025-2030 (%)
Data Table on Dairy products - Year-over-year growth 2025-2030 (%)

8.7 Others - Market size and forecast 2025-2030

Chart on Others - Market size and forecast 2025-2030 ($ million)
Data Table on Others - Market size and forecast 2025-2030 ($ million)
Chart on Others - Year-over-year growth 2025-2030 (%)
Data Table on Others - Year-over-year growth 2025-2030 (%)

8.8 Market opportunity by Application

Market opportunity by Application ($ million)
Data Table on Market opportunity by Application ($ million)

9. Market Segmentation by Form Factor

9.1 Market segments

Chart on Form Factor - Market share 2025-2030 (%)
Data Table on Form Factor - Market share 2025-2030 (%)

9.2 Comparison by Form Factor

Chart on Comparison by Form Factor
Data Table on Comparison by Form Factor

9.3 Powder - Market size and forecast 2025-2030

Chart on Powder - Market size and forecast 2025-2030 ($ million)
Data Table on Powder - Market size and forecast 2025-2030 ($ million)
Chart on Powder - Year-over-year growth 2025-2030 (%)
Data Table on Powder - Year-over-year growth 2025-2030 (%)

9.4 Liquids - Market size and forecast 2025-2030

Chart on Liquids - Market size and forecast 2025-2030 ($ million)
Data Table on Liquids - Market size and forecast 2025-2030 ($ million)
Chart on Liquids - Year-over-year growth 2025-2030 (%)
Data Table on Liquids - Year-over-year growth 2025-2030 (%)

9.5 Others - Market size and forecast 2025-2030

Chart on Others - Market size and forecast 2025-2030 ($ million)
Data Table on Others - Market size and forecast 2025-2030 ($ million)
Chart on Others - Year-over-year growth 2025-2030 (%)
Data Table on Others - Year-over-year growth 2025-2030 (%)

9.6 Market opportunity by Form Factor

Market opportunity by Form Factor ($ million)
Data Table on Market opportunity by Form Factor ($ million)

10. Market Segmentation by Type

10.1 Market segments

Chart on Type - Market share 2025-2030 (%)
Data Table on Type - Market share 2025-2030 (%)

10.2 Comparison by Type

Chart on Comparison by Type
Data Table on Comparison by Type

10.3 Natural flavors - Market size and forecast 2025-2030

Chart on Natural flavors - Market size and forecast 2025-2030 ($ million)
Data Table on Natural flavors - Market size and forecast 2025-2030 ($ million)
Chart on Natural flavors - Year-over-year growth 2025-2030 (%)
Data Table on Natural flavors - Year-over-year growth 2025-2030 (%)

10.4 Fruit and vegetable ingredients - Market size and forecast 2025-2030

Chart on Fruit and vegetable ingredients - Market size and forecast 2025-2030 ($ million)
Data Table on Fruit and vegetable ingredients - Market size and forecast 2025-2030 ($ million)
Chart on Fruit and vegetable ingredients - Year-over-year growth 2025-2030 (%)
Data Table on Fruit and vegetable ingredients - Year-over-year growth 2025-2030 (%)

10.5 Natural colors - Market size and forecast 2025-2030

Chart on Natural colors - Market size and forecast 2025-2030 ($ million)
Data Table on Natural colors - Market size and forecast 2025-2030 ($ million)
Chart on Natural colors - Year-over-year growth 2025-2030 (%)
Data Table on Natural colors - Year-over-year growth 2025-2030 (%)

10.6 Starch and sweeteners - Market size and forecast 2025-2030

Chart on Starch and sweeteners - Market size and forecast 2025-2030 ($ million)
Data Table on Starch and sweeteners - Market size and forecast 2025-2030 ($ million)
Chart on Starch and sweeteners - Year-over-year growth 2025-2030 (%)
Data Table on Starch and sweeteners - Year-over-year growth 2025-2030 (%)

10.7 Others - Market size and forecast 2025-2030

Chart on Others - Market size and forecast 2025-2030 ($ million)
Data Table on Others - Market size and forecast 2025-2030 ($ million)
Chart on Others - Year-over-year growth 2025-2030 (%)
Data Table on Others - Year-over-year growth 2025-2030 (%)

10.8 Market opportunity by Type

Market opportunity by Type ($ million)
Data Table on Market opportunity by Type ($ million)

11. Customer Landscape

11.1 Customer landscape overview

Analysis of price sensitivity, lifecycle, customer purchase basket, adoption rates, and purchase criteria

12. Geographic Landscape

12.1 Geographic segmentation

Chart on Market share by geography 2025-2030 (%)
Data Table on Market share by geography 2025-2030 (%)

12.2 Geographic comparison

Chart on Geographic comparison
Data Table on Geographic comparison

12.3 North America - Market size and forecast 2025-2030

Chart on North America - Market size and forecast 2025-2030 ($ million)
Data Table on North America - Market size and forecast 2025-2030 ($ million)
Chart on North America - Year-over-year growth 2025-2030 (%)
Data Table on North America - Year-over-year growth 2025-2030 (%)
Chart on Regional Comparison - North America
Data Table on Regional Comparison - North America

12.3.1 US - Market size and forecast 2025-2030

Chart on US - Market size and forecast 2025-2030 ($ million)
Data Table on US - Market size and forecast 2025-2030 ($ million)
Chart on US - Year-over-year growth 2025-2030 (%)
Data Table on US - Year-over-year growth 2025-2030 (%)

12.3.2 Canada - Market size and forecast 2025-2030

Chart on Canada - Market size and forecast 2025-2030 ($ million)
Data Table on Canada - Market size and forecast 2025-2030 ($ million)
Chart on Canada - Year-over-year growth 2025-2030 (%)
Data Table on Canada - Year-over-year growth 2025-2030 (%)

12.3.3 Mexico - Market size and forecast 2025-2030

Chart on Mexico - Market size and forecast 2025-2030 ($ million)
Data Table on Mexico - Market size and forecast 2025-2030 ($ million)
Chart on Mexico - Year-over-year growth 2025-2030 (%)
Data Table on Mexico - Year-over-year growth 2025-2030 (%)

12.4 APAC - Market size and forecast 2025-2030

Chart on APAC - Market size and forecast 2025-2030 ($ million)
Data Table on APAC - Market size and forecast 2025-2030 ($ million)
Chart on APAC - Year-over-year growth 2025-2030 (%)
Data Table on APAC - Year-over-year growth 2025-2030 (%)
Chart on Regional Comparison - APAC
Data Table on Regional Comparison - APAC

12.4.1 China - Market size and forecast 2025-2030

Chart on China - Market size and forecast 2025-2030 ($ million)
Data Table on China - Market size and forecast 2025-2030 ($ million)
Chart on China - Year-over-year growth 2025-2030 (%)
Data Table on China - Year-over-year growth 2025-2030 (%)

12.4.2 Japan - Market size and forecast 2025-2030

Chart on Japan - Market size and forecast 2025-2030 ($ million)
Data Table on Japan - Market size and forecast 2025-2030 ($ million)
Chart on Japan - Year-over-year growth 2025-2030 (%)
Data Table on Japan - Year-over-year growth 2025-2030 (%)

12.4.3 India - Market size and forecast 2025-2030

Chart on India - Market size and forecast 2025-2030 ($ million)
Data Table on India - Market size and forecast 2025-2030 ($ million)
Chart on India - Year-over-year growth 2025-2030 (%)
Data Table on India - Year-over-year growth 2025-2030 (%)

12.4.4 South Korea - Market size and forecast 2025-2030

Chart on South Korea - Market size and forecast 2025-2030 ($ million)
Data Table on South Korea - Market size and forecast 2025-2030 ($ million)
Chart on South Korea - Year-over-year growth 2025-2030 (%)
Data Table on South Korea - Year-over-year growth 2025-2030 (%)

12.4.5 Australia - Market size and forecast 2025-2030

Chart on Australia - Market size and forecast 2025-2030 ($ million)
Data Table on Australia - Market size and forecast 2025-2030 ($ million)
Chart on Australia - Year-over-year growth 2025-2030 (%)
Data Table on Australia - Year-over-year growth 2025-2030 (%)

12.4.6 Indonesia - Market size and forecast 2025-2030

Chart on Indonesia - Market size and forecast 2025-2030 ($ million)
Data Table on Indonesia - Market size and forecast 2025-2030 ($ million)
Chart on Indonesia - Year-over-year growth 2025-2030 (%)
Data Table on Indonesia - Year-over-year growth 2025-2030 (%)

12.5 Europe - Market size and forecast 2025-2030

Chart on Europe - Market size and forecast 2025-2030 ($ million)
Data Table on Europe - Market size and forecast 2025-2030 ($ million)
Chart on Europe - Year-over-year growth 2025-2030 (%)
Data Table on Europe - Year-over-year growth 2025-2030 (%)
Chart on Regional Comparison - Europe
Data Table on Regional Comparison - Europe

12.5.1 UK - Market size and forecast 2025-2030

Chart on UK - Market size and forecast 2025-2030 ($ million)
Data Table on UK - Market size and forecast 2025-2030 ($ million)
Chart on UK - Year-over-year growth 2025-2030 (%)
Data Table on UK - Year-over-year growth 2025-2030 (%)

12.5.2 Germany - Market size and forecast 2025-2030

Chart on Germany - Market size and forecast 2025-2030 ($ million)
Data Table on Germany - Market size and forecast 2025-2030 ($ million)
Chart on Germany - Year-over-year growth 2025-2030 (%)
Data Table on Germany - Year-over-year growth 2025-2030 (%)

12.5.3 France - Market size and forecast 2025-2030

Chart on France - Market size and forecast 2025-2030 ($ million)
Data Table on France - Market size and forecast 2025-2030 ($ million)
Chart on France - Year-over-year growth 2025-2030 (%)
Data Table on France - Year-over-year growth 2025-2030 (%)

12.5.4 Italy - Market size and forecast 2025-2030

Chart on Italy - Market size and forecast 2025-2030 ($ million)
Data Table on Italy - Market size and forecast 2025-2030 ($ million)
Chart on Italy - Year-over-year growth 2025-2030 (%)
Data Table on Italy - Year-over-year growth 2025-2030 (%)

12.5.5 Spain - Market size and forecast 2025-2030

Chart on Spain - Market size and forecast 2025-2030 ($ million)
Data Table on Spain - Market size and forecast 2025-2030 ($ million)
Chart on Spain - Year-over-year growth 2025-2030 (%)
Data Table on Spain - Year-over-year growth 2025-2030 (%)

12.5.6 The Netherlands - Market size and forecast 2025-2030

Chart on The Netherlands - Market size and forecast 2025-2030 ($ million)
Data Table on The Netherlands - Market size and forecast 2025-2030 ($ million)
Chart on The Netherlands - Year-over-year growth 2025-2030 (%)
Data Table on The Netherlands - Year-over-year growth 2025-2030 (%)

12.6 South America - Market size and forecast 2025-2030

Chart on South America - Market size and forecast 2025-2030 ($ million)
Data Table on South America - Market size and forecast 2025-2030 ($ million)
Chart on South America - Year-over-year growth 2025-2030 (%)
Data Table on South America - Year-over-year growth 2025-2030 (%)
Chart on Regional Comparison - South America
Data Table on Regional Comparison - South America

12.6.1 Brazil - Market size and forecast 2025-2030

Chart on Brazil - Market size and forecast 2025-2030 ($ million)
Data Table on Brazil - Market size and forecast 2025-2030 ($ million)
Chart on Brazil - Year-over-year growth 2025-2030 (%)
Data Table on Brazil - Year-over-year growth 2025-2030 (%)

12.6.2 Argentina - Market size and forecast 2025-2030

Chart on Argentina - Market size and forecast 2025-2030 ($ million)
Data Table on Argentina - Market size and forecast 2025-2030 ($ million)
Chart on Argentina - Year-over-year growth 2025-2030 (%)
Data Table on Argentina - Year-over-year growth 2025-2030 (%)

12.6.3 Chile - Market size and forecast 2025-2030

Chart on Chile - Market size and forecast 2025-2030 ($ million)
Data Table on Chile - Market size and forecast 2025-2030 ($ million)
Chart on Chile - Year-over-year growth 2025-2030 (%)
Data Table on Chile - Year-over-year growth 2025-2030 (%)

12.7 Middle East and Africa - Market size and forecast 2025-2030

Chart on Middle East and Africa - Market size and forecast 2025-2030 ($ million)
Data Table on Middle East and Africa - Market size and forecast 2025-2030 ($ million)
Chart on Middle East and Africa - Year-over-year growth 2025-2030 (%)
Data Table on Middle East and Africa - Year-over-year growth 2025-2030 (%)
Chart on Regional Comparison - Middle East and Africa
Data Table on Regional Comparison - Middle East and Africa

12.7.1 Saudi Arabia - Market size and forecast 2025-2030

Chart on Saudi Arabia - Market size and forecast 2025-2030 ($ million)
Data Table on Saudi Arabia - Market size and forecast 2025-2030 ($ million)
Chart on Saudi Arabia - Year-over-year growth 2025-2030 (%)
Data Table on Saudi Arabia - Year-over-year growth 2025-2030 (%)

12.7.2 UAE - Market size and forecast 2025-2030

Chart on UAE - Market size and forecast 2025-2030 ($ million)
Data Table on UAE - Market size and forecast 2025-2030 ($ million)
Chart on UAE - Year-over-year growth 2025-2030 (%)
Data Table on UAE - Year-over-year growth 2025-2030 (%)

12.7.3 South Africa - Market size and forecast 2025-2030

Chart on South Africa - Market size and forecast 2025-2030 ($ million)
Data Table on South Africa - Market size and forecast 2025-2030 ($ million)
Chart on South Africa - Year-over-year growth 2025-2030 (%)
Data Table on South Africa - Year-over-year growth 2025-2030 (%)

12.7.4 Egypt - Market size and forecast 2025-2030

Chart on Egypt - Market size and forecast 2025-2030 ($ million)
Data Table on Egypt - Market size and forecast 2025-2030 ($ million)
Chart on Egypt - Year-over-year growth 2025-2030 (%)
Data Table on Egypt - Year-over-year growth 2025-2030 (%)

12.7.5 Turkey - Market size and forecast 2025-2030

Chart on Turkey - Market size and forecast 2025-2030 ($ million)
Data Table on Turkey - Market size and forecast 2025-2030 ($ million)
Chart on Turkey - Year-over-year growth 2025-2030 (%)
Data Table on Turkey - Year-over-year growth 2025-2030 (%)

12.8 Market opportunity by geography

Market opportunity by geography ($ million)
Data Tables on Market opportunity by geography ($ million)

13. Drivers, Challenges, and Opportunity

13.1 Market drivers

Heightened consumer preference transparency drives natural minimally processed product growth
Expanding ultra processed food health awareness accelerates clean formulation shifts
Retailer clean standard mandates force food manufacturers accelerate ingredient simplification

13.2 Market challenges

High sourcing costs supply chain vulnerability elevate raw material expenses globally
Technical reformulation constraints restrict functional substitution without compromising shelf stability quality
Regulatory ambiguity divergent global standard compliance heighten operational legal complexities

13.3 Impact of drivers and challenges

Impact of drivers and challenges in 2025 and 2030

13.4 Market opportunities

Upcycled agricultural biomass functional ingredients gain rapid commercial adoption globally
Multi functional native starch platform innovations drive plant based texture solutions
Biotechnology precision fermentation enables clean label natural preservative enzyme deployment

14. Competitive Landscape

14.1 Overview

14.2

Overview on criticality of inputs and factors of differentiation

14.3 Landscape disruption

Overview on factors of disruption

14.4 Industry risks

Impact of key risks on business

15. Competitive Analysis

15.1 Companies profiled

Companies covered

15.2 Company ranking index

15.3 Market positioning of companies

Matrix on companies position and classification

15.4 AAK AB

AAK AB - Overview
AAK AB - Business segments
AAK AB - Key offerings
AAK AB - Segment focus
SWOT

15.5 Archer Daniels Midland Co.

Archer Daniels Midland Co. - Overview
Archer Daniels Midland Co. - Business segments
Archer Daniels Midland Co. - Key news
Archer Daniels Midland Co. - Key offerings
Archer Daniels Midland Co. - Segment focus
SWOT

15.6 BENEO GmbH

BENEO GmbH - Overview
BENEO GmbH - Product / Service
BENEO GmbH - Key offerings
SWOT

15.7 Cargill Inc.

Cargill Inc. - Overview
Cargill Inc. - Product / Service
Cargill Inc. - Key news
Cargill Inc. - Key offerings
SWOT

15.8 Corbion N.V.

Corbion N.V. - Overview
Corbion N.V. - Business segments
Corbion N.V. - Key offerings
Corbion N.V. - Segment focus
SWOT

15.9 Dairy Farmers of America Inc.

Dairy Farmers of America Inc. - Overview
Dairy Farmers of America Inc. - Product / Service
Dairy Farmers of America Inc. - Key offerings
SWOT

15.10 Dohler GmbH

Dohler GmbH - Overview
Dohler GmbH - Product / Service
Dohler GmbH - Key offerings
SWOT

15.11 DSM Firmenich AG

DSM Firmenich AG - Overview
DSM Firmenich AG - Business segments
DSM Firmenich AG - Key offerings
DSM Firmenich AG - Segment focus
SWOT

15.12 Ebro Ingredients

Ebro Ingredients - Overview
Ebro Ingredients - Product / Service
Ebro Ingredients - Key offerings
SWOT

15.13 Givaudan SA

Givaudan SA - Overview
Givaudan SA - Business segments
Givaudan SA - Key news
Givaudan SA - Key offerings
Givaudan SA - Segment focus
SWOT

15.14 Ingredion Inc.

Ingredion Inc. - Overview
Ingredion Inc. - Business segments
Ingredion Inc. - Key offerings
Ingredion Inc. - Segment focus
SWOT

15.15 International Flavors Inc.

International Flavors Inc. - Overview
International Flavors Inc. - Business segments
International Flavors Inc. - Key news
International Flavors Inc. - Key offerings
International Flavors Inc. - Segment focus
SWOT

15.16 Kerry Group Plc

Kerry Group Plc - Overview
Kerry Group Plc - Business segments
Kerry Group Plc - Key news
Kerry Group Plc - Key offerings
Kerry Group Plc - Segment focus
SWOT

15.17 Olam Food Ingredients

Olam Food Ingredients - Overview
Olam Food Ingredients - Product / Service
Olam Food Ingredients - Key offerings
SWOT

15.18 Symrise Group

Symrise Group - Overview
Symrise Group - Business segments
Symrise Group - Key news
Symrise Group - Key offerings
Symrise Group - Segment focus
SWOT

16. Appendix

16.1 Scope of the report

Market definition
Objectives
Notes and caveats

16.2 Inclusions and exclusions checklist

Inclusions checklist
Exclusions checklist

16.3 Currency conversion rates for US$

16.4 Research methodology

16.5 Data procurement

Information sources

16.6 Data validation

16.7 Validation techniques employed for market sizing

16.8 Data synthesis

16.9 360 degree market analysis

16.10 List of abbreviations

Research Methodology

Technavio presents a detailed picture of the market by way of study, synthesis, and summation of data from multiple sources. The analysts have presented the various facets of the market with a particular focus on identifying the key industry influencers. The data thus presented is comprehensive, reliable, and the result of extensive research, both primary and secondary.

INFORMATION SOURCES

Primary sources

  • Manufacturers and suppliers
  • Channel partners
  • Industry experts
  • Strategic decision makers

Secondary sources

  • Industry journals and periodicals
  • Government data
  • Financial reports of key industry players
  • Historical data
  • Press releases

DATA ANALYSIS

Data Synthesis

  • Collation of data
  • Estimation of key figures
  • Analysis of derived insights

Data Validation

  • Triangulation with data models
  • Reference against proprietary databases
  • Corroboration with industry experts

REPORT WRITING

Qualitative

  • Market drivers
  • Market challenges
  • Market trends
  • Five forces analysis

Quantitative

  • Market size and forecast
  • Market segmentation
  • Geographical insights
  • Competitive landscape

Interested in this report?

Get your sample now to see our research methodology and insights!

Download Now

Frequently Asked Questions

Clean Label Ingredients market growth will increase by USD 18796.2 million during 2026-2030.

The Clean Label Ingredients market is expected to grow at a CAGR of 7% during 2026-2030.

Clean Label Ingredients market is segmented by Application (Beverages, Bakery and confectionery, Sauce and condiment, Dairy products, Others) Form factor (Powder, Liquids, Others) Type (Natural flavors, Fruit and vegetable ingredients, Natural colors, Starch and sweeteners, Others)

AAK AB, Archer Daniels Midland Co., BENEO GmbH, Cargill Inc., Corbion N.V., Dairy Farmers of America Inc., Dohler GmbH, DSM Firmenich AG, Ebro Ingredients, Givaudan SA, Glanbia Nutritionals, Ingredion Inc., International Flavors Inc., Jungbunzlauer Suisse AG, Kalsec Inc., Kemin Industries Inc., Kerry Group Plc, Nexira, Olam Food Ingredients, Symrise Group are a few of the key vendors in the Clean Label Ingredients market.

North America will register the highest growth rate of 42.6% among the other regions. Therefore, the Clean Label Ingredients market in North America is expected to garner significant business opportunities for the vendors during the forecast period.

US, Canada, Mexico, China, Japan, India, South Korea, Australia, Indonesia, UK, Germany, France, Italy, Spain, The Netherlands, Brazil, Argentina, Chile, Saudi Arabia, UAE, South Africa, Egypt, Turkey

  • Heightened consumer preference transparency drives natural minimally processed product growth is the driving factor this market.

The Clean Label Ingredients market vendors should focus on grabbing business opportunities from the Application segment as it accounted for the largest market share in the base year.
RIA - Research AI Assistant
Ask RIA
