Clinical Trial Imaging Market Size 2024-2028
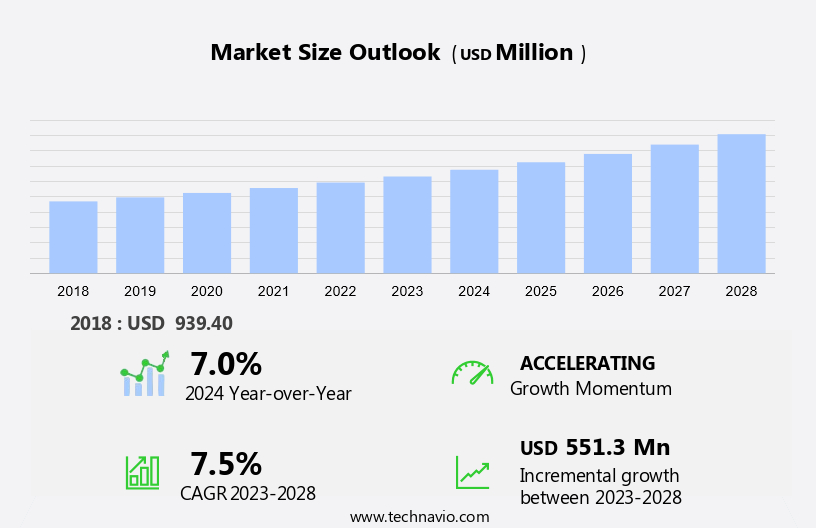
The clinical trial imaging market size is forecast to increase by USD 551.3 million at a CAGR of 7.5% between 2023 and 2028.
- The market is experiencing significant growth due to the increasing investment in drug development for chronic diseases. Imaging techniques, such as Computed Tomography (CT), play a crucial role in clinical trials by providing valuable data for drug efficacy and safety assessments. Patient comfort is a key trend in this market, as Breast imaging technologies are being developed to minimize patient discomfort and improve the overall trial experience. Data management services are also gaining importance to ensure accurate and efficient handling of imaging data. Strict regulations, however, pose a challenge to market growth, requiring strong data security and compliance measures. Overall, the market is expected to continue its expansion, driven by the need for advanced imaging technologies to support the development of new treatments.
What will be the Size of the Market During the Forecast Period?

Request Free Sample
- The integration of medical imaging technologies in clinical trials has revolutionized the biotechnology and pharmaceutical industries. By providing valuable insights into various health conditions, these advanced imaging techniques contribute significantly to the development of new therapeutics and treatments. In the realm of clinical trials, imaging technologies play a pivotal role in assessing the efficacy and safety of new drugs and therapies. Biotechnology and pharmaceutical companies increasingly rely on these technologies to gather data on disease progression, treatment response, and potential side effects. Image analysis software, fueled by artificial intelligence (AI) and machine learning algorithms, is a crucial component of this process.
- These advanced technologies enable the automated detection, measurement, and analysis of various health conditions, including oncology, non-alcoholic steatohepatitis (NASH), neurology, endocrinology, and cardiology. Virtual imaging trials, which utilize AI and machine learning, have gained considerable attention in recent years. These trials allow for remote patient monitoring and data collection, streamlining the clinical trial process and reducing costs. Imaging modalities, such as computed tomography (CT), magnetic resonance imaging (MRI), echocardiography, nuclear medicine (positron emission tomography â PET), x-ray, ultrasound, and optical coherence tomography, are essential tools in the clinical trial landscape.
How is this market segmented and which is the largest segment?
The market research report provides comprehensive data (region-wise segment analysis), with forecasts and estimates in "USD million" for the period 2024-2028, as well as historical data from 2018-2022 for the following segments.
- Modality
- Computed tomography
- Magnetic resonance imaging
- Ultrasound
- Positron emission tomography
- Others
- End-user
- Contract research organization
- Pharmaceutical and biotechnology companies
- Research and academic institutes
- Medical device manufacturers
- Geography
- North America
- Europe
- Asia
- Rest of World (ROW)
By Modality Insights
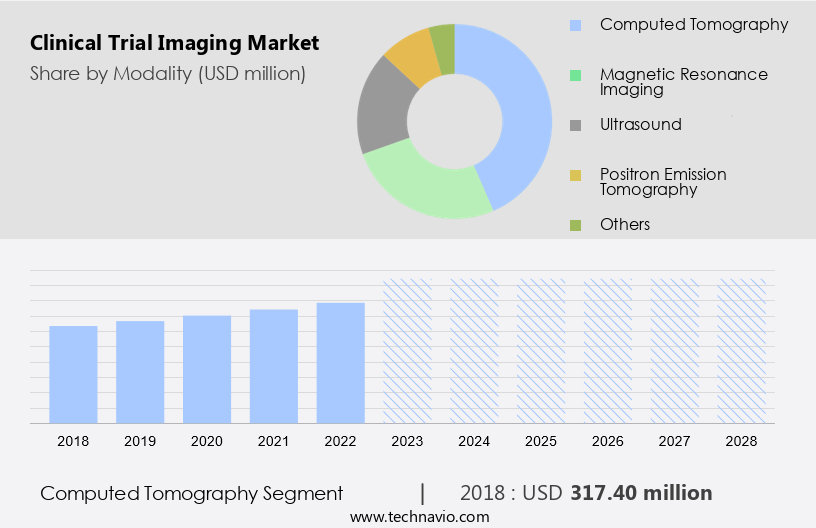
- The computed tomography segment is estimated to witness significant growth during the forecast period.
The market is experiencing notable progressions, with a notable focus on the computed tomography (CT) segment. CT imaging is a vital imaging modality in clinical trials due to its ability to generate detailed cross-sectional images of the body, which are crucial for precise diagnosis and tracking of various medical conditions, including cancer. The rising prevalence of chronic diseases and the demand for early and precise diagnosis have boosted the importance of high-resolution imaging technologies. CT scans are indispensable in evaluating disease progression and treatment effectiveness in clinical trials.
Furthermore, technological innovations in CT imaging, such as photon counting computed tomography (PCCT), are expanding the capabilities of clinical trial imaging. Magnetic Resonance Imaging (MRI), Echocardiography, Nuclear Medicine, Positron Emission Tomography (PET), and X-ray are other significant imaging modalities in clinical trials. MRI offers superior soft tissue contrast and is widely used in neurology, oncology, and cardiology trials. Hence, such factors are fuelling the growth of this segment during the forecast period.

Get a glance at the market report of share of various segments Request Free Sample
The computed tomography segment was valued at USD 317.40 million in 2018 and showed a gradual increase during the forecast period.
Regional Analysis
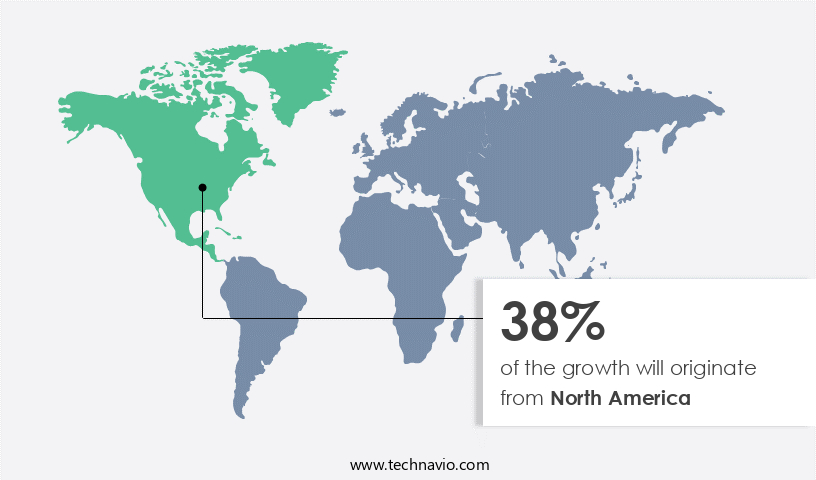
- North America is estimated to contribute 38% to the growth of the global market during the forecast period.
Technavio's analysts have elaborately explained the regional trends and drivers that shape the market during the forecast period.

For more insights on the market share of various regions Request Free Sample
The North American market is a significant contributor to the global industry, fueled by substantial investments from both private and public sectors. This region's market dynamics are shaped by strategic investments, technological advancements, and a strong focus on innovation in the therapeutic area of chronic conditions. In June 2024, Zynext Ventures, the venture capital arm of Zydus Lifesciences, made a strategic investment in Promaxo, a company specializing in low-field MRI systems. This investment underscores the regional commitment to advancing medical imaging technology for clinical trials. The US and Canada's advanced healthcare infrastructure and strong research ecosystem further bolster the market's growth. Key players in the North American market are driving initiatives to enhance clinical trial diversity and improve imaging technologies, making this region a hub for clinical trial imaging.
Market Dynamics
Our researchers analyzed the data with 2023 as the base year, along with the key drivers, trends, and challenges. A holistic analysis of drivers will help companies refine their marketing strategies to gain a competitive advantage.
What are the key market drivers leading to the rise in adoption of Clinical Trial Imaging Market?
Growing investment in drug discovery is the key driver of the market.
- The market is driven by the escalating investment in pharmaceutical research and development. These funds are vital for advancing research and development efforts in the biopharmaceutical sector, enabling companies to execute extensive clinical trials.
- Furthermore, clinical trials are indispensable for assessing the safety and efficacy of new drugs and therapies. Imaging technologies, including medical imaging and image analysis software, play a pivotal role in clinical trials. These advanced tools facilitate the monitoring of disease progression, treatment response, and adverse effects. The increasing adoption of virtual imaging trials further enhances the efficiency and accuracy of clinical trials, ultimately leading to the development of innovative treatments for various medical conditions. Thus, such factors are driving the growth of the market during the forecast period.
What are the market trends shaping the Clinical Trial Imaging Market?
Partnerships and collaborations is the upcoming trend in the market.
- The market in is experiencing a notable trend towards collaborative partnerships, which are fostering innovation and streamlining the clinical trial process. These strategic alliances are essential for merging expertise, broadening capabilities, and delivering comprehensive imaging solutions tailored to the dynamic requirements of drug development for chronic diseases.
- This collaboration aims to heighten the precision and productivity of clinical trials in the pulmonary domain, offering more accurate imaging data and ultimately enhancing overall trial success. By combining their respective strengths, these partners can effectively address the complexities of clinical research and contribute to the advancement of healthcare solutions. Thus, such trends will shape the growth of the market during the forecast period.
What challenges does Clinical Trial Imaging Market face during the growth?
Strict regulations is a key challenge affecting the market growth.
- The market faces significant regulatory challenges, including the US Food and Drug Administration's (FDA) recent call for increased diversity in clinical trials. In June 2024, the FDA proposed measures for pharmaceutical and medical device companies to expand the representation of racial, ethnic, and other diverse populations in their studies. While this initiative aims to ensure clinical trial results reflect the general population, it introduces additional intricacies for trial sponsors.
- Despite these challenges, the market's growth is expected to continue, fueled by the potential of AI and ML to improve clinical trial efficiency and reduce costs. As Imaging Solutions become more sophisticated, they will play a crucial role in advancing healthcare and facilitating the development of new treatments. Key players in the market include companies specializing in Imaging Modalities, AI and ML algorithms, and operational Imaging Services. However, regulatory challenges, particularly the FDA's call for greater diversity in clinical trials, present complexities for trial sponsors. Despite these challenges, the market's future looks promising, with AI and ML set to revolutionize Oncology imaging solutions and improve patient care.
Exclusive Customer Landscape
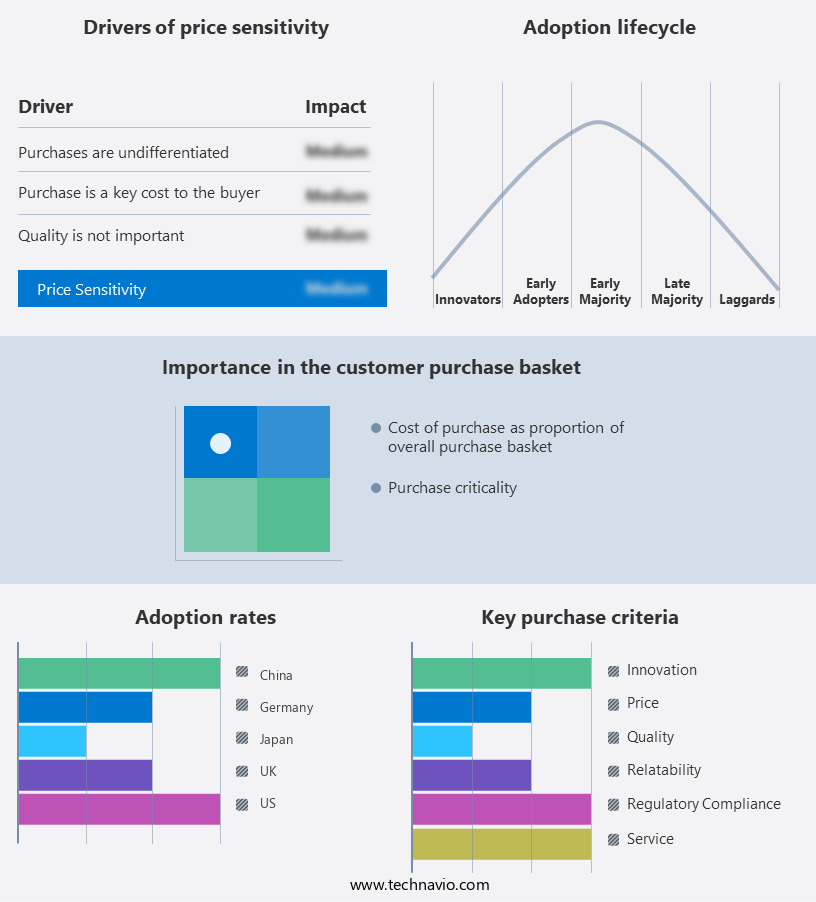
The market forecasting report includes the adoption lifecycle of the market, covering from the innovator's stage to the laggard's stage. It focuses on adoption rates in different regions based on penetration. Furthermore, the market report also includes key purchase criteria and drivers of price sensitivity to help companies evaluate and develop their market growth analysis strategies.

Customer Landscape
Key Companies & Market Insights
Companies are implementing various strategies, such as strategic alliances, market forecast, partnerships, mergers and acquisitions, geographical expansion, and product/service launches, to enhance their presence in the market. The market research and growth report includes detailed analyses of the competitive landscape of the market and information about key companies, including:
- Alimentiv Inc
- ARANZ Medical Ltd
- Aster Medical Imaging LLC
- Charles River Laboratories International Inc.
- Clario
- ICON plc
- Image Core Lab Pvt Ltd
- IXICO plc
- Median Technologies SA
- Medidata
- Medpace Holdings Inc.
- Navitas Life Sciences
- Octalsoft
- QMENTA Imaging SL
- QUANTIFICARE
- THIRONA
- Vista Diagnostics Ltd
- Voiant
- WCG Clinical Inc.
- Yunu, Inc.
Qualitative and quantitative analysis of companies has been conducted to help clients understand the wider business environment as well as the strengths and weaknesses of key market players. Data is qualitatively analyzed to categorize companies as pure play, category-focused, industry-focused, and diversified; it is quantitatively analyzed to categorize companies as dominant, leading, strong, tentative, and weak.
Research Analyst Overview
The clinical trials market for medical imaging in the biotechnology and pharmaceutical industries is experiencing significant growth due to the increasing role of imaging technologies in drug development. Image analysis software and virtual imaging trials are becoming essential tools in this process, with advancements in artificial intelligence and machine learning enabling more accurate and efficient analysis. Imaging modalities such as computed tomography (CT), magnetic resonance imaging (MRI, echocardiography, nuclear medicine, positron emission tomography (PET), x-ray, ultrasound, optical coherence tomography, and various imaging techniques are used extensively in clinical trials for therapeutic areas like oncology, neurology, endocrinology, cardiology, dermatology, hematology, and others.
Moreover, patient comfort and safety are key considerations, with imaging solutions providing operational imaging services to ensure optimal conditions. Data management services are also crucial in managing the large volumes of imaging data generated during clinical trials. Medical device companies and healthcare providers are collaborating to provide therapeutic expertise and imaging technology to support the development of new treatments for chronic conditions. Molecular imaging and diffusion-weighted imaging (DWI) are also gaining popularity in clinical trials for their ability to provide valuable insights into the biological processes underlying various diseases.
Market Scope
|
Report Coverage
|
Details
|
Page number
|
211
|
Base year
|
2023
|
Historic period
|
2018-2022 |
Forecast period
|
2024-2028
|
Growth momentum & CAGR
|
Accelerate at a CAGR of 7.5%
|
Market growth 2024-2028
|
USD 551.3 million
|
Market structure
|
Fragmented
|
YoY growth 2023-2024(%)
|
7.0
|
Key countries
|
US, China, Germany, UK, and Japan
|
Competitive landscape
|
Leading Companies, Market Positioning of Companies, Competitive Strategies, and Industry Risks
|
Request Free Sample
What are the Key Data Covered in this Market Research and Growth Report?
- CAGR of the market during the forecast period
- Detailed information on factors that will drive the market growth and forecasting between 2024 and 2028
- Precise estimation of the size of the market and its contribution of the market in focus to the parent market
- Accurate predictions about upcoming market growth and trends and changes in consumer behaviour
- Growth of the market across North America, Europe, Asia, and Rest of World (ROW)
- Thorough analysis of the market's competitive landscape and detailed information about companies
- Comprehensive analysis of factors that will challenge the growth of market companies
We can help! Our analysts can customize this market research report to meet your requirements. Get in touch
1 Executive Summary
- 1.1 Market overview
- Executive Summary - Chart on Market Overview
- Executive Summary - Data Table on Market Overview
- Executive Summary - Chart on Global Market Characteristics
- Executive Summary - Chart on Market by Geography
- Executive Summary - Chart on Market Segmentation by Modality
- Executive Summary - Chart on Market Segmentation by End-user
- Executive Summary - Chart on Incremental Growth
- Executive Summary - Data Table on Incremental Growth
- Executive Summary - Chart on Company Market Positioning
2 Technavio Analysis
- 2.1 Analysis of price sensitivity, lifecycle, customer purchase basket, adoption rates, and purchase criteria
- Analysis of price sensitivity, lifecycle, customer purchase basket, adoption rates, and purchase criteria
- 2.2 Criticality of inputs and Factors of differentiation
- Overview on criticality of inputs and factors of differentiation
- 2.3 Factors of disruption
- Overview on factors of disruption
- 2.4 Impact of drivers and challenges
- Impact of drivers and challenges in 2023 and 2028
3 Market Landscape
- 3.1 Market ecosystem
- Parent Market
- Data Table on - Parent Market
- 3.2 Market characteristics
- Market characteristics analysis
4 Market Sizing
- 4.1 Market definition
- Offerings of companies included in the market definition
- 4.2 Market segment analysis
- 4.4 Market outlook: Forecast for 2023-2028
- Chart on Global - Market size and forecast 2023-2028 ($ million)
- Data Table on Global - Market size and forecast 2023-2028 ($ million)
- Chart on Global Market: Year-over-year growth 2023-2028 (%)
- Data Table on Global Market: Year-over-year growth 2023-2028 (%)
5 Historic Market Size
- 5.1 Global Clinical Trial Imaging Market 2018 - 2022
- Historic Market Size - Data Table on Global Clinical Trial Imaging Market 2018 - 2022 ($ million)
- 5.2 Modality segment analysis 2018 - 2022
- Historic Market Size - Modality Segment 2018 - 2022 ($ million)
- 5.3 End-user segment analysis 2018 - 2022
- Historic Market Size - End-user Segment 2018 - 2022 ($ million)
- 5.4 Geography segment analysis 2018 - 2022
- Historic Market Size - Geography Segment 2018 - 2022 ($ million)
- 5.5 Country segment analysis 2018 - 2022
- Historic Market Size - Country Segment 2018 - 2022 ($ million)
6 Qualitative Analysis
- 6.1 Impact of Artificial Intelligence (AI) on global clinical trial imaging market
7 Five Forces Analysis
- 7.1 Five forces summary
- Five forces analysis - Comparison between 2023 and 2028
- 7.2 Bargaining power of buyers
- Bargaining power of buyers - Impact of key factors 2023 and 2028
- 7.3 Bargaining power of suppliers
- Bargaining power of suppliers - Impact of key factors in 2023 and 2028
- 7.4 Threat of new entrants
- Threat of new entrants - Impact of key factors in 2023 and 2028
- 7.5 Threat of substitutes
- Threat of substitutes - Impact of key factors in 2023 and 2028
- 7.6 Threat of rivalry
- Threat of rivalry - Impact of key factors in 2023 and 2028
- 7.7 Market condition
- Chart on Market condition - Five forces 2023 and 2028
8 Market Segmentation by Modality
- 8.1 Market segments
- Chart on Modality - Market share 2023-2028 (%)
- Data Table on Modality - Market share 2023-2028 (%)
- 8.2 Comparison by Modality
- Chart on Comparison by Modality
- Data Table on Comparison by Modality
- 8.3 Computed tomography - Market size and forecast 2023-2028
- Chart on Computed tomography - Market size and forecast 2023-2028 ($ million)
- Data Table on Computed tomography - Market size and forecast 2023-2028 ($ million)
- Chart on Computed tomography - Year-over-year growth 2023-2028 (%)
- Data Table on Computed tomography - Year-over-year growth 2023-2028 (%)
- 8.4 Magnetic resonance imaging - Market size and forecast 2023-2028
- Chart on Magnetic resonance imaging - Market size and forecast 2023-2028 ($ million)
- Data Table on Magnetic resonance imaging - Market size and forecast 2023-2028 ($ million)
- Chart on Magnetic resonance imaging - Year-over-year growth 2023-2028 (%)
- Data Table on Magnetic resonance imaging - Year-over-year growth 2023-2028 (%)
- 8.5 Ultrasound - Market size and forecast 2023-2028
- Chart on Ultrasound - Market size and forecast 2023-2028 ($ million)
- Data Table on Ultrasound - Market size and forecast 2023-2028 ($ million)
- Chart on Ultrasound - Year-over-year growth 2023-2028 (%)
- Data Table on Ultrasound - Year-over-year growth 2023-2028 (%)
- 8.6 Positron emission tomography - Market size and forecast 2023-2028
- Chart on Positron emission tomography - Market size and forecast 2023-2028 ($ million)
- Data Table on Positron emission tomography - Market size and forecast 2023-2028 ($ million)
- Chart on Positron emission tomography - Year-over-year growth 2023-2028 (%)
- Data Table on Positron emission tomography - Year-over-year growth 2023-2028 (%)
- 8.7 Others - Market size and forecast 2023-2028
- Chart on Others - Market size and forecast 2023-2028 ($ million)
- Data Table on Others - Market size and forecast 2023-2028 ($ million)
- Chart on Others - Year-over-year growth 2023-2028 (%)
- Data Table on Others - Year-over-year growth 2023-2028 (%)
- 8.8 Market opportunity by Modality
- Market opportunity by Modality ($ million)
- Data Table on Market opportunity by Modality ($ million)
9 Market Segmentation by End-user
- 9.1 Market segments
- Chart on End-user - Market share 2023-2028 (%)
- Data Table on End-user - Market share 2023-2028 (%)
- 9.2 Comparison by End-user
- Chart on Comparison by End-user
- Data Table on Comparison by End-user
- 9.3 Contract research organization - Market size and forecast 2023-2028
- Chart on Contract research organization - Market size and forecast 2023-2028 ($ million)
- Data Table on Contract research organization - Market size and forecast 2023-2028 ($ million)
- Chart on Contract research organization - Year-over-year growth 2023-2028 (%)
- Data Table on Contract research organization - Year-over-year growth 2023-2028 (%)
- 9.4 Pharmaceutical and biotechnology companies - Market size and forecast 2023-2028
- Chart on Pharmaceutical and biotechnology companies - Market size and forecast 2023-2028 ($ million)
- Data Table on Pharmaceutical and biotechnology companies - Market size and forecast 2023-2028 ($ million)
- Chart on Pharmaceutical and biotechnology companies - Year-over-year growth 2023-2028 (%)
- Data Table on Pharmaceutical and biotechnology companies - Year-over-year growth 2023-2028 (%)
- 9.5 Research and academic institutes - Market size and forecast 2023-2028
- Chart on Research and academic institutes - Market size and forecast 2023-2028 ($ million)
- Data Table on Research and academic institutes - Market size and forecast 2023-2028 ($ million)
- Chart on Research and academic institutes - Year-over-year growth 2023-2028 (%)
- Data Table on Research and academic institutes - Year-over-year growth 2023-2028 (%)
- 9.6 Medical device manufacturers - Market size and forecast 2023-2028
- Chart on Medical device manufacturers - Market size and forecast 2023-2028 ($ million)
- Data Table on Medical device manufacturers - Market size and forecast 2023-2028 ($ million)
- Chart on Medical device manufacturers - Year-over-year growth 2023-2028 (%)
- Data Table on Medical device manufacturers - Year-over-year growth 2023-2028 (%)
- 9.7 Market opportunity by End-user
- Market opportunity by End-user ($ million)
- Data Table on Market opportunity by End-user ($ million)
10 Customer Landscape
- 10.1 Customer landscape overview
- Analysis of price sensitivity, lifecycle, customer purchase basket, adoption rates, and purchase criteria
11 Geographic Landscape
- 11.1 Geographic segmentation
- Chart on Market share by geography 2023-2028 (%)
- Data Table on Market share by geography 2023-2028 (%)
- 11.2 Geographic comparison
- Chart on Geographic comparison
- Data Table on Geographic comparison
- 11.3 North America - Market size and forecast 2023-2028
- Chart on North America - Market size and forecast 2023-2028 ($ million)
- Data Table on North America - Market size and forecast 2023-2028 ($ million)
- Chart on North America - Year-over-year growth 2023-2028 (%)
- Data Table on North America - Year-over-year growth 2023-2028 (%)
- 11.4 Europe - Market size and forecast 2023-2028
- Chart on Europe - Market size and forecast 2023-2028 ($ million)
- Data Table on Europe - Market size and forecast 2023-2028 ($ million)
- Chart on Europe - Year-over-year growth 2023-2028 (%)
- Data Table on Europe - Year-over-year growth 2023-2028 (%)
- 11.5 Asia - Market size and forecast 2023-2028
- Chart on Asia - Market size and forecast 2023-2028 ($ million)
- Data Table on Asia - Market size and forecast 2023-2028 ($ million)
- Chart on Asia - Year-over-year growth 2023-2028 (%)
- Data Table on Asia - Year-over-year growth 2023-2028 (%)
- 11.6 Rest of World (ROW) - Market size and forecast 2023-2028
- Chart on Rest of World (ROW) - Market size and forecast 2023-2028 ($ million)
- Data Table on Rest of World (ROW) - Market size and forecast 2023-2028 ($ million)
- Chart on Rest of World (ROW) - Year-over-year growth 2023-2028 (%)
- Data Table on Rest of World (ROW) - Year-over-year growth 2023-2028 (%)
- 11.7 US - Market size and forecast 2023-2028
- Chart on US - Market size and forecast 2023-2028 ($ million)
- Data Table on US - Market size and forecast 2023-2028 ($ million)
- Chart on US - Year-over-year growth 2023-2028 (%)
- Data Table on US - Year-over-year growth 2023-2028 (%)
- 11.8 China - Market size and forecast 2023-2028
- Chart on China - Market size and forecast 2023-2028 ($ million)
- Data Table on China - Market size and forecast 2023-2028 ($ million)
- Chart on China - Year-over-year growth 2023-2028 (%)
- Data Table on China - Year-over-year growth 2023-2028 (%)
- 11.9 Germany - Market size and forecast 2023-2028
- Chart on Germany - Market size and forecast 2023-2028 ($ million)
- Data Table on Germany - Market size and forecast 2023-2028 ($ million)
- Chart on Germany - Year-over-year growth 2023-2028 (%)
- Data Table on Germany - Year-over-year growth 2023-2028 (%)
- 11.10 UK - Market size and forecast 2023-2028
- Chart on UK - Market size and forecast 2023-2028 ($ million)
- Data Table on UK - Market size and forecast 2023-2028 ($ million)
- Chart on UK - Year-over-year growth 2023-2028 (%)
- Data Table on UK - Year-over-year growth 2023-2028 (%)
- 11.11 Japan - Market size and forecast 2023-2028
- Chart on Japan - Market size and forecast 2023-2028 ($ million)
- Data Table on Japan - Market size and forecast 2023-2028 ($ million)
- Chart on Japan - Year-over-year growth 2023-2028 (%)
- Data Table on Japan - Year-over-year growth 2023-2028 (%)
- 11.12 India - Market size and forecast 2023-2028
- Chart on India - Market size and forecast 2023-2028 ($ million)
- Data Table on India - Market size and forecast 2023-2028 ($ million)
- Chart on India - Year-over-year growth 2023-2028 (%)
- Data Table on India - Year-over-year growth 2023-2028 (%)
- 11.13 France - Market size and forecast 2023-2028
- Chart on France - Market size and forecast 2023-2028 ($ million)
- Data Table on France - Market size and forecast 2023-2028 ($ million)
- Chart on France - Year-over-year growth 2023-2028 (%)
- Data Table on France - Year-over-year growth 2023-2028 (%)
- 11.14 Canada - Market size and forecast 2023-2028
- Chart on Canada - Market size and forecast 2023-2028 ($ million)
- Data Table on Canada - Market size and forecast 2023-2028 ($ million)
- Chart on Canada - Year-over-year growth 2023-2028 (%)
- Data Table on Canada - Year-over-year growth 2023-2028 (%)
- 11.15 Australia - Market size and forecast 2023-2028
- Chart on Australia - Market size and forecast 2023-2028 ($ million)
- Data Table on Australia - Market size and forecast 2023-2028 ($ million)
- Chart on Australia - Year-over-year growth 2023-2028 (%)
- Data Table on Australia - Year-over-year growth 2023-2028 (%)
- 11.16 Brazil - Market size and forecast 2023-2028
- Chart on Brazil - Market size and forecast 2023-2028 ($ million)
- Data Table on Brazil - Market size and forecast 2023-2028 ($ million)
- Chart on Brazil - Year-over-year growth 2023-2028 (%)
- Data Table on Brazil - Year-over-year growth 2023-2028 (%)
- 11.17 Market opportunity by geography
- Market opportunity by geography ($ million)
- Data Tables on Market opportunity by geography ($ million)
12 Drivers, Challenges, and Opportunity/Restraints
- 12.3 Impact of drivers and challenges
- Impact of drivers and challenges in 2023 and 2028
- 12.4 Market opportunities/restraints
13 Competitive Landscape
- 13.2 Competitive Landscape
- Overview on criticality of inputs and factors of differentiation
- 13.3 Landscape disruption
- Overview on factors of disruption
- 13.4 Industry risks
- Impact of key risks on business
14 Competitive Analysis
- 14.2 Company ranking index
- 14.3 Market positioning of companies
- Matrix on companies position and classification
- 14.4 Charles River Laboratories International Inc.
- Charles River Laboratories International Inc. - Overview
- Charles River Laboratories International Inc. - Business segments
- Charles River Laboratories International Inc. - Key offerings
- Charles River Laboratories International Inc. - Segment focus
- SWOT
- 14.5 Clario
- Clario - Overview
- Clario - Product / Service
- Clario - Key offerings
- SWOT
- 14.6 ICON plc
- ICON plc - Overview
- ICON plc - Product / Service
- ICON plc - Key offerings
- SWOT
- 14.7 Image Core Lab Pvt Ltd
- Image Core Lab Pvt Ltd - Overview
- Image Core Lab Pvt Ltd - Product / Service
- Image Core Lab Pvt Ltd - Key offerings
- SWOT
- 14.8 IXICO plc
- IXICO plc - Overview
- IXICO plc - Product / Service
- IXICO plc - Key news
- IXICO plc - Key offerings
- SWOT
- 14.9 Median Technologies SA
- Median Technologies SA - Overview
- Median Technologies SA - Product / Service
- Median Technologies SA - Key offerings
- SWOT
- 14.10 Medidata
- Medidata - Overview
- Medidata - Product / Service
- Medidata - Key offerings
- SWOT
- 14.11 Medpace Holdings Inc.
- Medpace Holdings Inc. - Overview
- Medpace Holdings Inc. - Product / Service
- Medpace Holdings Inc. - Key offerings
- SWOT
- 14.12 Navitas Life Sciences
- Navitas Life Sciences - Overview
- Navitas Life Sciences - Product / Service
- Navitas Life Sciences - Key offerings
- SWOT
- 14.13 QMENTA Imaging SL
- QMENTA Imaging SL - Overview
- QMENTA Imaging SL - Product / Service
- QMENTA Imaging SL - Key offerings
- SWOT
- 14.14 QUANTIFICARE
- QUANTIFICARE - Overview
- QUANTIFICARE - Product / Service
- QUANTIFICARE - Key offerings
- SWOT
- 14.15 THIRONA
- THIRONA - Overview
- THIRONA - Product / Service
- THIRONA - Key offerings
- SWOT
- 14.16 Vista Diagnostics Ltd
- Vista Diagnostics Ltd - Overview
- Vista Diagnostics Ltd - Product / Service
- Vista Diagnostics Ltd - Key offerings
- SWOT
- 14.17 Voiant
- Voiant - Overview
- Voiant - Product / Service
- Voiant - Key offerings
- SWOT
- 14.18 WCG Clinical Inc.
- WCG Clinical Inc. - Overview
- WCG Clinical Inc. - Product / Service
- WCG Clinical Inc. - Key offerings
- SWOT
15 Appendix
- 15.2 Inclusions and exclusions checklist
- Inclusions checklist
- Exclusions checklist
- 15.3 Currency conversion rates for US$
- Currency conversion rates for US$
- 15.4 Research methodology
- 15.7 Validation techniques employed for market sizing
- Validation techniques employed for market sizing
- 15.9 360 degree market analysis
- 360 degree market analysis
- 15.10 List of abbreviations