
Cloud Finops Automation Tools Market Size and Growth Forecast 2026-2030
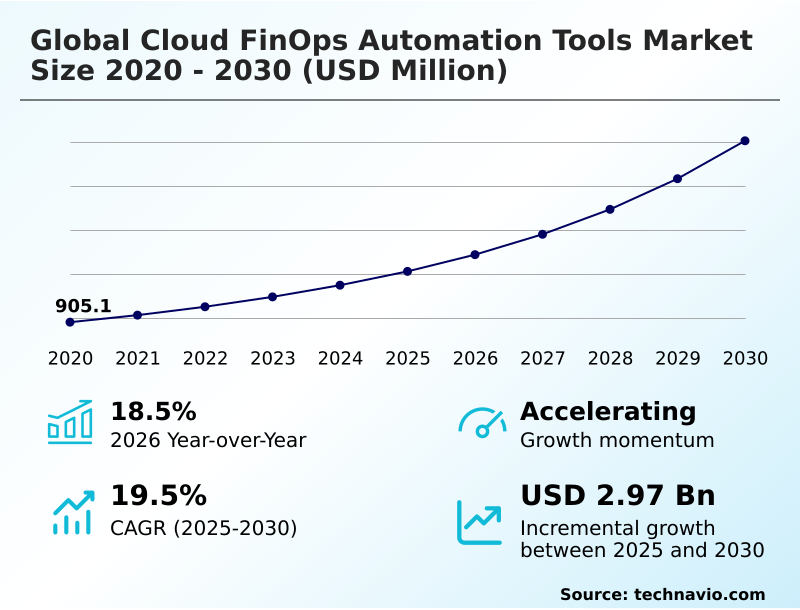
The Cloud Finops Automation Tools Market size was valued at USD 2.06 billion in 2025 growing at a CAGR of 19.5% during the forecast period 2026-2030.
North America accounts for 43.3% of incremental growth during the forecast period. The Large enterprises segment by Business Segment was valued at USD 1.25 billion in 2024, while the IT and telecommunications segment holds the largest revenue share by End-user.
The market is projected to grow by USD 4.12 billion from 2020 to 2030, with USD 2.97 billion of the growth expected during the forecast period of 2025 to 2030.
Get Key Insights on Market Forecast (PDF) Request Free Sample
Cloud Finops Automation Tools Market Overview
The cloud finops automation tools market is defined by a strategic shift from reactive cost reporting to proactive, autonomous financial governance. With year-over-year growth reaching 18.5%, the demand is fueled by the need to manage complex, multi-cloud estates where manual oversight is no longer feasible. Key trends include the application of ai-driven finops for predictive cost analytics and the cultural move toward decentralized engineering accountability. A core challenge remains the persistent difficulty in cloud billing data normalization across providers. For instance, a global e-commerce enterprise managing seasonal traffic spikes utilizes a finops automation platform for automated rightsizing of its server fleet. By leveraging predictive cost analytics based on historical sales data, the platform autonomously scales resources, ensuring performance during high-demand periods while enabling significant cloud waste mitigation during lulls, a process that manually would be impossible. This application of autonomous remediation and real-time cost visibility is critical as organizations in North America, which accounts for over 43% of market growth, seek to align cloud spend directly with business value and master their cloud unit economics.
Drivers, Trends, and Challenges in the Cloud Finops Automation Tools Market
Achieving granular control over cloud expenditures necessitates a sophisticated approach beyond native billing consoles. Modern enterprises now require real-time cost visibility for azure and other platforms, leveraging ai-driven rightsizing for kubernetes clusters to prevent resource waste in dynamic containerized environments.
The practice of unit economics tracking for saas platforms has become a standard for assessing profitability per customer, while chargeback automation for enterprise it enforces departmental accountability. A key enabler is the FinOps Open Cost and Usage Specification (FOCUS) v1.1, which addresses the challenge of multi-cloud cost allocation without tagging.
For example, a fintech firm implementing proactive remediation of cloud waste for its high-frequency trading platform uses automation for optimizing spot instance usage with ai and automating reserved instance portfolio management. This approach, which also includes serverless application cost tracking and data transfer cost optimization strategies, delivers superior cost efficiency compared to firms still reliant on manual processes.
Integrating such it financial management platform integration into the development lifecycle via finops policy enforcement as code is now a hallmark of financially mature organizations.
This extends to finops governance for hybrid cloud, predictive forecasting for cloud budgets, container cost optimization in eks, and resolving shared cost allocation for multi-tenant apps, with greenops carbon emission reporting automation becoming a key compliance capability.
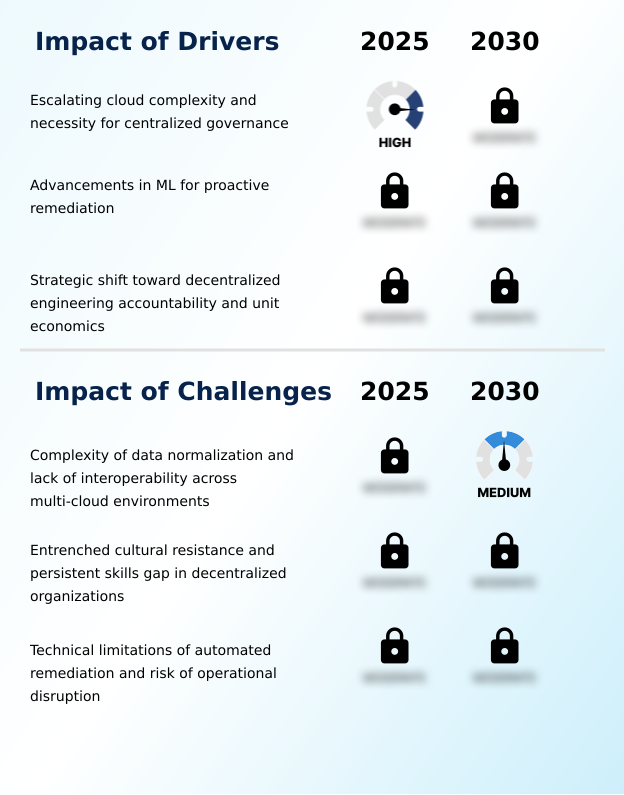
Primary Growth Driver: The escalating complexity of multi-cloud environments and the corresponding necessity for centralized governance are key drivers of market growth.
Market expansion, marked by an 18.5% year-over-year growth rate, is propelled by several structural drivers. The foremost is the escalating complexity of multi-cloud architectures, which makes centralized governance frameworks a necessity for maintaining financial control.
Concurrently, advancements in machine learning are enabling a shift toward ai-driven finops, transforming cost management into a proactive and autonomous function capable of predictive cost analytics and autonomous remediation.
This is complemented by a crucial cultural driver: the move toward decentralized engineering accountability.
By equipping developers with tools that provide real-time cost visibility and insight into cloud unit economics, organizations are embedding financial discipline directly into the development lifecycle, ensuring that technological agility does not lead to uncontrolled spending.
Emerging Market Trend: The integration of sustainability metrics and GreenOps into financial management frameworks is an emerging trend. This allows enterprises to optimize for both cost and carbon efficiency.
Key market trends are converging to create more intelligent and responsible cloud financial management frameworks. The integration of sustainability metrics tracking is giving rise to greenops automation, allowing organizations to make architectural decisions that balance cost with carbon impact, a particularly strong trend in Europe.
Concurrently, the application of generative AI cost optimization is democratizing FinOps by enabling natural language queries and autonomous remediation, reducing the manual burden on engineering teams. This is especially impactful in regions like APAC, which exhibits a 20.8% CAGR, where AI-driven tools help overcome shortages of specialized talent.
These advancements are underpinned by the industry-wide adoption of the FinOps Open Cost and Usage Specification (FOCUS), which standardizes data formats to enable seamless multi-cloud cost management and enhances the efficacy of automated rightsizing tools.
Key Industry Challenge: The complexity of data normalization and a lack of interoperability across multi-cloud environments present a key challenge to the market.
A primary market restraint is the technical difficulty of cloud billing data normalization across heterogeneous environments, a problem highlighted in FinOps Foundation white papers on FOCUS adoption. This lack of interoperability hinders the effectiveness of multi-cloud cost management tools and often requires significant data cleansing investments.
Another significant challenge is the cultural resistance to decentralized engineering accountability, where a persistent skills gap between finance and engineering teams obstructs the adoption of autonomous remediation. Many organizations remain hesitant to grant full permissions for automated cost-saving actions due to the perceived risk of operational disruption.
This caution is particularly prevalent in less mature markets like South America, which, despite an 18.4% CAGR, often lack the deep FinOps expertise required to build trust in fully automated systems.
Explore Full Market Dynamics Analysis Request Free Sample
Cloud Finops Automation Tools Market Segmentation
The cloud finops automation tools industry research report provides comprehensive data including region-wise segment analysis, with forecasts and analysis for the period 2026-2030, as well as historical data from 2020-2024 for the following segments.
Business Segment Segment Analysis
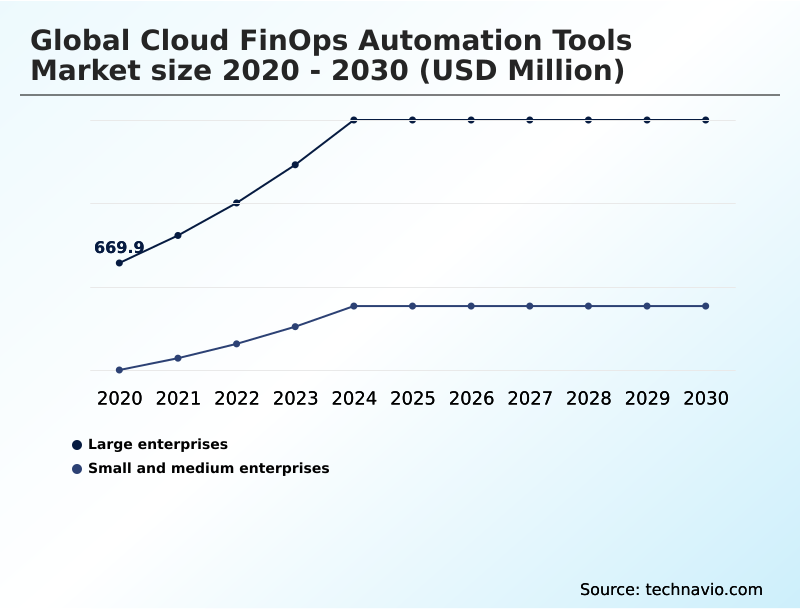
The large enterprises segment is estimated to witness significant growth during the forecast period.
Large enterprises, accounting for over 71% of the market, represent the primary adopters of finops automation tools due to the scale of their digital infrastructure. These organizations navigate complex multi-cloud and hybrid environments where manual cost management is untenable.
The adoption of centralized governance frameworks is driven by the need to enforce financial policies across disparate business units and geographies. Platforms enabling automated rightsizing and proactive cloud waste mitigation are critical for managing spend.
Within these entities, ai-driven finops is essential for real-time anomaly detection engine performance, preventing budget overruns.
The focus is on implementing autonomous remediation to handle the sheer volume of resources, ensuring that cloud expenditures align with strategic objectives without requiring constant manual oversight from engineering teams.
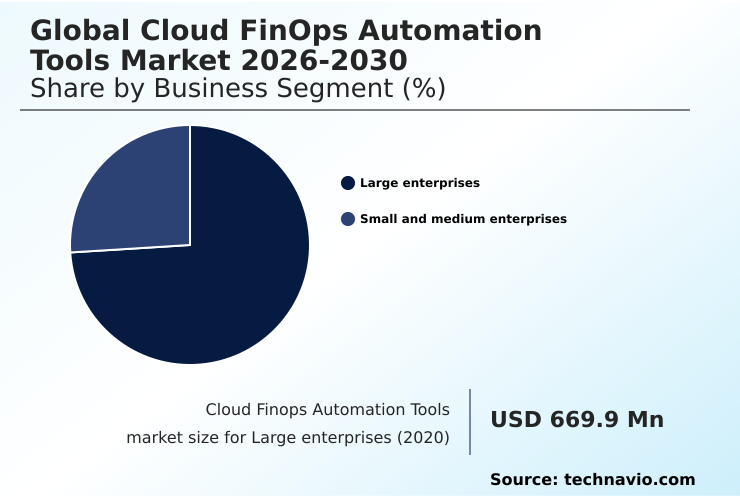
The Large enterprises segment was valued at USD 1.25 billion in 2024 and showed a gradual increase during the forecast period.
Cloud Finops Automation Tools Market by Region: North America Leads with 43.3% Growth Share
North America is estimated to contribute 43.3% to the growth of the global market during the forecast period.
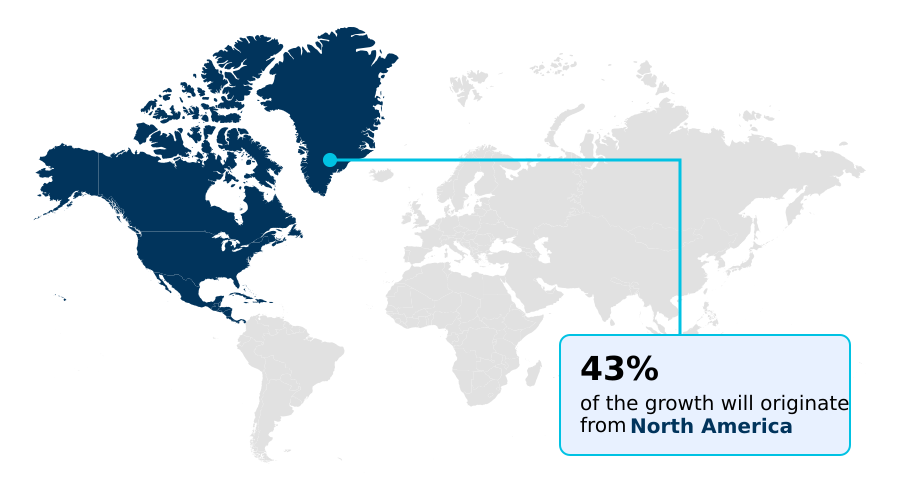
The geographic landscape is led by North America, which accounts for over 43% of incremental growth, driven by early adoption of multi-cloud strategies and a high concentration of technology firms demanding sophisticated cloud financial governance.
In this mature market, the focus is on autonomous remediation and mastering cloud unit economics.
In contrast, APAC is the fastest-growing region, with a 20.8% CAGR, where finops automation tools are critical for managing rapid digital expansion and bridging skill gaps.
Europe prioritizes compliance with regulations like the GDPR, driving demand for tools that support data sovereignty and greenops automation.
South America and the Middle East and Africa are emerging regions, with growth driven by digital transformation initiatives in sectors like banking and government, where automated cloud cost optimization is a key enabler.
Customer Landscape Analysis for the Cloud Finops Automation Tools Market
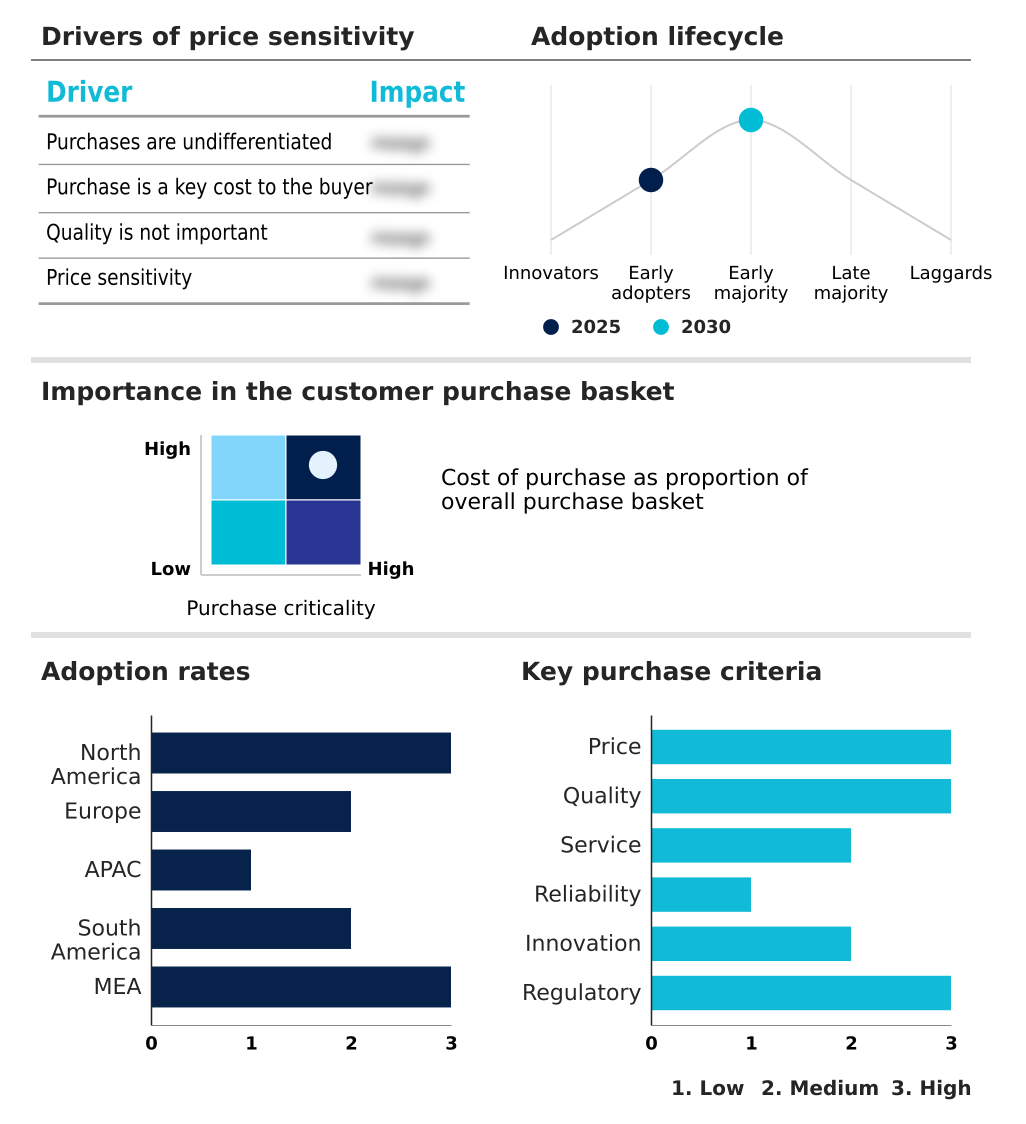
The cloud finops automation tools market forecasting report includes the adoption lifecycle of the market, covering from the innovator’s stage to the laggard’s stage. It focuses on adoption rates in different regions based on penetration. Furthermore, the cloud finops automation tools market report also includes key purchase criteria and drivers of price sensitivity to help companies evaluate and develop their market growth analysis strategies.
Competitive Landscape of the Cloud Finops Automation Tools Market
Companies are implementing various strategies, such as strategic alliances, partnerships, mergers and acquisitions, geographical expansion, and product/service launches, to enhance their presence in the cloud finops automation tools market industry.
Amazon.com Inc. - Offerings center on automated, multi-cloud financial governance, providing anomaly detection, cost allocation, and resource optimization through a unified software platform.
The industry research and growth report includes detailed analyses of the competitive landscape of the market and information about key companies, including:
- Amazon.com Inc.
- Anodot Ltd.
- Broadcom Inc.
- CAST AI Group Inc.
- CloudZero Inc.
- Datadog Inc.
- DoiT International
- Dynatrace Inc.
- Finout Ltd.
- Flexera Software LLC
- Google LLC
- Harness Inc.
- IBM Corp.
- Microsoft Corp.
- NetApp Inc.
- Nutanix Inc.
- Oracle Corp.
- ProsperOps Inc.
- SAP SE
- Yotascale Inc.
Qualitative and quantitative analysis of companies has been conducted to help clients understand the wider business environment as well as the strengths and weaknesses of key industry players. Data is qualitatively analyzed to categorize companies as pure play, category-focused, industry-focused, and diversified; it is quantitatively analyzed to categorize companies as dominant, leading, strong, tentative, and weak.
Recent Developments in the Cloud Finops Automation Tools Market
- In February, 2025, The FinOps Foundation released a technical white paper detailing the ongoing difficulties in implementing the FOCUS specification across legacy enterprise architectures, highlighting persistent data normalization challenges.
- In March, 2025, JPMorgan Chase integrated a new automated cloud financial governance module into its global digital infrastructure to monitor and optimize multi-cloud spending across its international investment banking divisions.
- In April, 2025, Google Cloud announced an enhanced integration capability within its cloud billing console that allows for the direct ingestion of usage data from competing cloud providers via the FOCUS standard.
- In May, 2025, Harness released an advanced autonomous remediation engine that utilizes generative artificial intelligence to implement cost-saving measures without manual intervention from engineering personnel.
Research Analyst Overview: Cloud Finops Automation Tools Market
The market's 18.5% year-over-year growth is directly tied to the integration of advanced machine learning, fundamentally shifting cloud financial management from a reactive to a proactive discipline. The rise of generative ai cost optimization and autonomous cost remediation capabilities allows for a self-healing financial infrastructure where systems correct inefficiencies in real time.
For boardroom decision-makers, this translates to balancing innovation velocity with fiscal responsibility, using cloud cost intelligence as a strategic asset. The adoption of the FinOps Open Cost and Usage Specification (FOCUS) is crucial for addressing the technical challenge of cloud billing data normalization, enabling more effective multi-cloud cost management.
In practice, enterprises are deploying predictive cost analytics to forecast spending and leveraging ai-driven finops for complex tasks like kubernetes cost optimization. This move toward a centralized governance framework, supported by tools capable of autonomous remediation, is essential for maximizing ROI on cloud investments and achieving sustainable operational agility in a competitive landscape.
Dive into Technavio’s robust research methodology, blending expert interviews, extensive data synthesis, and validated models for unparalleled Cloud Finops Automation Tools Market insights. See full methodology.
| Market Scope | |
|---|---|
| Page number | 297 |
| Base year | 2025 |
| Historic period | 2020-2024 |
| Forecast period | 2026-2030 |
| Growth momentum & CAGR | Accelerate at a CAGR of 19.5% |
| Market growth 2026-2030 | USD 2968.0 million |
| Market structure | Fragmented |
| YoY growth 2025-2026(%) | 18.5% |
| Key countries | US, Canada, Mexico, Germany, UK, France, Italy, Spain, The Netherlands, China, India, Japan, South Korea, Australia, Indonesia, Brazil, Argentina, Chile, UAE, Saudi Arabia, South Africa, Egypt and Turkey |
| Competitive landscape | Leading Companies, Market Positioning of Companies, Competitive Strategies, and Industry Risks |
Cloud Finops Automation Tools Market: Key Questions Answered in This Report
-
What is the expected growth of the Cloud Finops Automation Tools Market between 2026 and 2030?
-
The Cloud Finops Automation Tools Market is expected to grow by USD 2.97 billion during 2026-2030, registering a CAGR of 19.5%. Year-over-year growth in 2026 is estimated at 18.5%%. This acceleration is shaped by escalating cloud complexity and necessity for centralized governance, which is intensifying demand across multiple end-use verticals covered in the report.
-
-
What segmentation does the market report cover?
-
The report is segmented by Business Segment (Large enterprises, and Small and medium enterprises), End-user (IT and telecommunications, BFSI, Retail and e-commerce, Healthcare, and Others), Component (Software, and Services) and Geography (North America, Europe, APAC, South America, Middle East and Africa). Among these, the Large enterprises segment is estimated to witness significant growth during the forecast period, driven by rising adoption across key application areas. Each segment includes detailed qualitative and quantitative analysis, along with historical data from 2020-2024 and forecasts through 2030 with year-over-year growth rates.
-
-
Which regions are analyzed in the report?
-
The report covers North America, Europe, APAC, South America and Middle East and Africa. North America is estimated to contribute 43.3% to market growth during the forecast period. Country-level analysis includes US, Canada, Mexico, Germany, UK, France, Italy, Spain, The Netherlands, China, India, Japan, South Korea, Australia, Indonesia, Brazil, Argentina, Chile, UAE, Saudi Arabia, South Africa, Egypt and Turkey, with dedicated market size tables and year-over-year growth for each.
-
-
What are the key growth drivers and market challenges?
-
The primary driver is escalating cloud complexity and necessity for centralized governance, which is accelerating investment and industry demand. The main challenge is complexity of data normalization and lack of interoperability across multi-cloud environments, creating operational barriers for key market participants. The report quantifies the impact of each driver and challenge across 2026 and 2030 with comparative analysis.
-
-
Who are the major players in the Cloud Finops Automation Tools Market?
-
Key vendors include Amazon.com Inc., Anodot Ltd., Broadcom Inc., CAST AI Group Inc., CloudZero Inc., Datadog Inc., DoiT International, Dynatrace Inc., Finout Ltd., Flexera Software LLC, Google LLC, Harness Inc., IBM Corp., Microsoft Corp., NetApp Inc., Nutanix Inc., Oracle Corp., ProsperOps Inc., SAP SE and Yotascale Inc.. The report provides qualitative and quantitative analysis categorizing companies as dominant, leading, strong, tentative, and weak based on their market positioning. Company profiles include business segment analysis, SWOT assessment, key offerings, and recent strategic developments.
-
Cloud Finops Automation Tools Market Research Insights
A pivotal dynamic is the cultural shift toward embedding financial accountability within engineering teams, a move facilitated by finops automation platform integration into CI/CD pipelines. This trend supports devsecops financial integration and infrastructure-as-code cost management. Organizations are adopting chargeback and showback automation to provide granular cost transparency, with tools for finops for kubernetes becoming essential for managing containerized environments.
The FinOps Foundation's training initiatives underscore the industry's focus on bridging the skills gap between finance and engineering. This is especially relevant for large enterprises, which represent a significantly larger market segment than SMEs.
These platforms enable automated commitment management and serverless cost optimization, allowing development teams to innovate rapidly without incurring uncontrolled expenditures, thus providing crucial cloud cost visibility tools for strategic decision-making.
We can help! Our analysts can customize this cloud finops automation tools market research report to meet your requirements.
 RIA -
RIA - 
