Cloud Finops Market Analysis, Size, and Forecast 2026-2030: North America (US, Canada, and Mexico), Europe (Germany, UK, and France), APAC (China, India, and Japan), South America (Brazil and Argentina), Middle East and Africa (UAE, Saudi Arabia, and South Africa), and Rest of World (ROW)

Cloud Finops Market Analysis, Size, and Forecast 2026-2030:
North America (US, Canada, and Mexico), Europe (Germany, UK, and France), APAC (China, India, and Japan), South America (Brazil and Argentina), Middle East and Africa (UAE, Saudi Arabia, and South Africa), and Rest of World (ROW)

Published: Mar 2026 307 Pages SKU: IRTNTR81279

Market Overview at a Glance

$14.83 B
Market Opportunity
14.4%
CAGR 2025 - 2030
38.9%
North America Growth
$8.71 B
Public cloud segment 2024

Cloud Finops Market Size 2026-2030

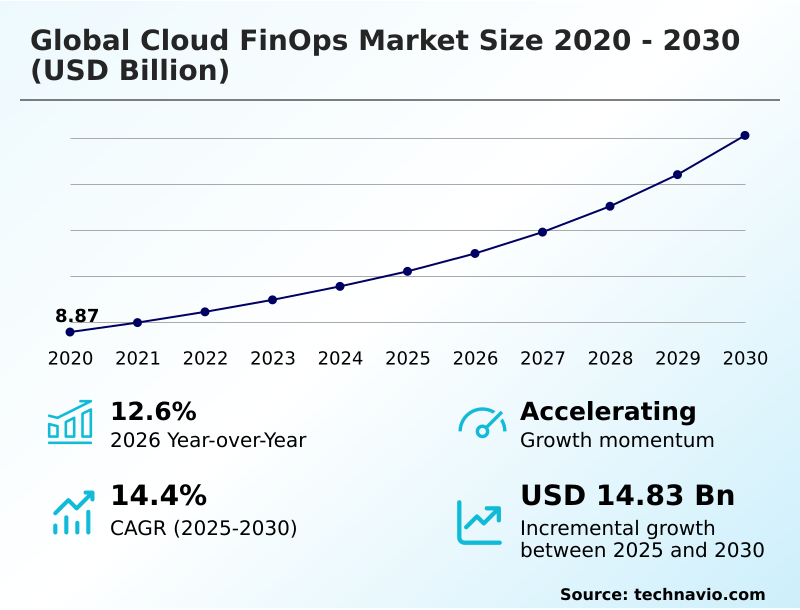
The cloud finops market size is valued to increase by USD 14.83 billion, at a CAGR of 14.4% from 2025 to 2030. Standardization across heterogeneous multi-cloud environments will drive the cloud finops market.

Major Market Trends & Insights

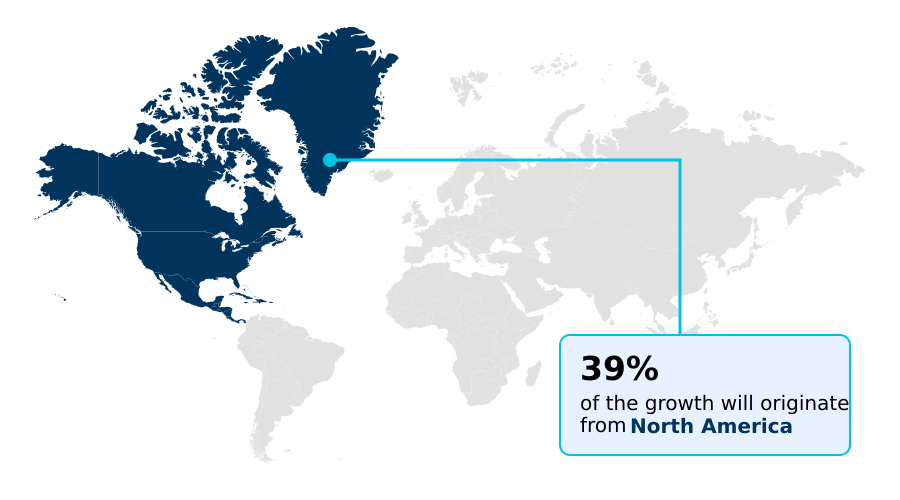
  • North America dominated the market and accounted for a 38.9% growth during the forecast period.
  • By Deployment - Public cloud segment was valued at USD 8.71 billion in 2024
  • By Application - Cost allocation and chargeback segment accounted for the largest market revenue share in 2024

Market Size & Forecast

  • Market Opportunities: USD 21.45 billion
  • Market Future Opportunities: USD 14.83 billion
  • CAGR from 2025 to 2030 : 14.4%

Market Summary

  • The Cloud FinOps market represents a crucial cultural and strategic evolution, shifting organizational focus from passive cost monitoring to active financial management of cloud resources. This discipline is driven by the need to control the variable spend associated with multi-cloud architectures and the escalating costs of AI workloads.
  • Key trends include the integration of autonomous governance through AI, which enables proactive anomaly detection and rightsizing, and the expansion of financial principles to the entire technology stack, including software-as-a-service platforms. For instance, a global retail enterprise can leverage unit economics calculation to determine the precise cloud cost of each online transaction.
  • During a peak sales event, this allows the business to make data-driven decisions on resource scaling, ensuring that infrastructure spend remains aligned with revenue growth and profitability targets.
  • However, progress is often constrained by internal challenges such as organizational silos between engineering and finance teams and a persistent lack of data standardization, which complicates efforts to achieve a unified view of technology spend. The practice of cloud cost allocation and automated rightsizing are central to overcoming these hurdles.

What will be the Size of the Cloud Finops Market during the forecast period?

Get Key Insights on Market Forecast (PDF) Request Free Sample

How is the Cloud Finops Market Segmented?

The cloud finops industry research report provides comprehensive data (region-wise segment analysis), with forecasts and estimates in "USD million" for the period 2026-2030, as well as historical data from 2020-2024 for the following segments.

  • Deployment
    • Public cloud
    • Hybrid
    • Private cloud
  • Application
    • Cost management and optimization
    • Budgeting and forecasting
    • Cost allocation and chargeback
    • Reporting and analytics
    • Others
  • Business segment
    • Large enterprises
    • Small and medium enterprises
  • Geography
    • North America
      • US
      • Canada
      • Mexico
    • Europe
      • Germany
      • UK
      • France
    • APAC
      • China
      • India
      • Japan
    • South America
      • Brazil
      • Argentina
    • Middle East and Africa
      • UAE
      • Saudi Arabia
      • South Africa
    • Rest of World (ROW)

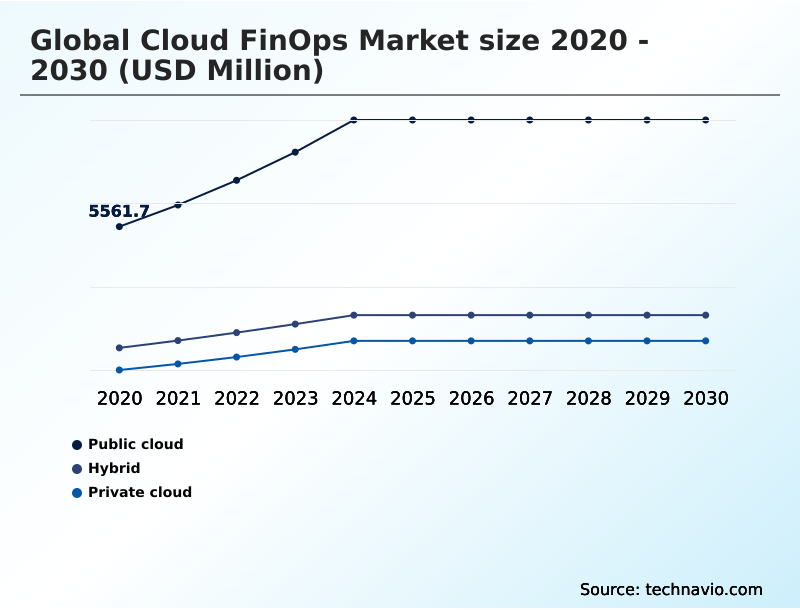
By Deployment Insights

The public cloud segment is estimated to witness significant growth during the forecast period.

The public cloud segment drives demand for advanced financial governance automation due to its inherently variable and decentralized nature. In these environments, practices focus on optimizing complex pricing models through commitment-based discount optimization and savings plan automation to maximize value.

A robust strategy for cloud cost allocation and resource utilization monitoring is essential for attributing expenses and calculating unit economics. Organizations employing automated rightsizing and real-time spend monitoring have improved budget forecast accuracy by over 20%.

Managing GPU workload costs and data egress cost reduction are also critical.

This proactive approach, involving kubernetes cost management and idle resource termination, transforms the scalability of public cloud infrastructure from a potential liability into a strategic financial asset for modern enterprises.

Request Free Sample

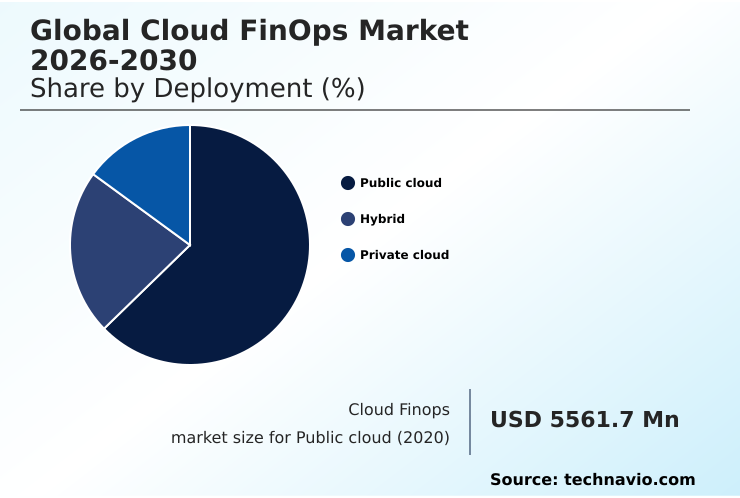
The Public cloud segment was valued at USD 8.71 billion in 2024 and showed a gradual increase during the forecast period.

Request Free Sample

Regional Analysis

North America is estimated to contribute 38.9% to the growth of the global market during the forecast period.Technavio’s analysts have elaborately explained the regional trends and drivers that shape the market during the forecast period.

See How Cloud Finops Market Demand is Rising in North America Request Free Sample

The geographic landscape reveals a market maturing at different velocities.

North America leads in sophistication, with organizations focusing on workload placement optimization and deep analytics to measure the business value of cloud investments, improving their infrastructure cost-to-revenue ratio by over 10%.

In Europe, the emphasis on regulatory compliance drives demand for cross-platform cost visibility. The APAC region is the fastest-growing, with enterprises tackling multi-cloud cost normalization and establishing a finops center of excellence to manage rapid scaling.

Across all regions, the goal is to use unit cost for digital products and other metrics to link cloud spend to revenue.

This global trend, supported by a rigorous finops maturity assessment, transforms cloud financial management into a strategic function for governance for decentralized teams and better cloud capacity planning, with some achieving a 20% improvement in resource efficiency.

Market Dynamics

Our researchers analyzed the data with 2025 as the base year, along with the key drivers, trends, and challenges. A holistic analysis of drivers will help companies refine their marketing strategies to gain a competitive advantage.

  • Successfully navigating the complexities of the modern cloud requires a detailed understanding of the best practices for multi-cloud finops implementation. A primary focus is on how to reduce AWS data transfer costs, as these can quickly accumulate and lead to budget overruns. For other platforms, automating google cloud commitment discount management is crucial for maximizing savings.
  • At a more granular level, calculating unit economics for kubernetes applications provides essential visibility into the efficiency of containerized workloads. The true value emerges when integrating finops into the devops lifecycle, creating a culture of cost awareness among engineers. This becomes particularly vital when developing strategies for managing unpredictable ai workload costs, which demand specialized monitoring.
  • Implementing chargeback for shared cloud services ensures accountability, while measuring roi of cloud migration projects validates the business case for digital transformation. To achieve this, organizations are building a business case for finops tools and developing a comprehensive cloud cost allocation strategy. This extends to finops for serverless application cost management and even tracking carbon footprint with cloud data.
  • Teams that effectively integrate these practices, such as rightsizing workloads without performance impact, resolve deployment-related cost issues nearly twice as fast as those with siloed operations, demonstrating a clear link between operational and fiscal discipline.

What are the key market drivers leading to the rise in the adoption of Cloud Finops Industry?

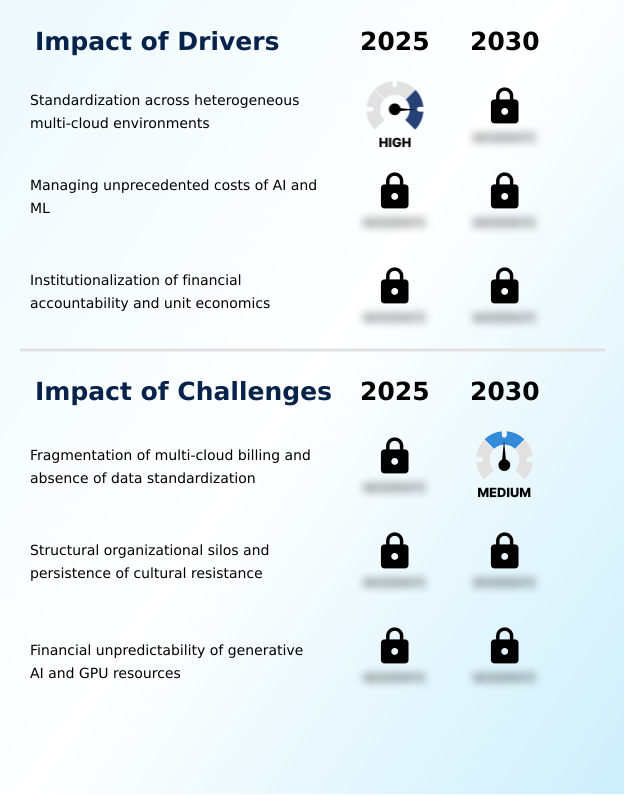
  • A key driver for the market is the increasing need for standardization to manage financial data effectively across heterogeneous multi-cloud environments.

  • Market growth is fueled by the urgent need for multi-cloud cost normalization and the establishment of clear technology value streams.
  • The ongoing finops cultural transformation promotes financial accountability in engineering, a shift that has improved cost efficiency on new projects by up to 20%.
  • Unifying multi-cloud billing data is a primary objective, with cloud spend optimization techniques enabling a more accurate cloud TCO calculation across hybrid cloud cost control frameworks.
  • As enterprises adopt multi-cloud cost governance, the implementation of automated budget alerting systems becomes essential. This driver is further supported by the availability of finops as a service, which helps organizations without in-house expertise implement effective cloud financial management.
  • Standardization initiatives have also been shown to reduce data reconciliation workloads by over 40%, freeing up teams to focus on strategic analysis.

What are the market trends shaping the Cloud Finops Industry?

  • The market is witnessing a significant trend toward autonomous financial governance. This shift is primarily driven by the integration of generative artificial intelligence for proactive cost management.

  • Key market trends are redefining financial management, with a notable shift toward predictive cloud cost analytics and automating cloud cost remediation. The integration of a greenops framework is gaining traction, with a focus on sustainability reporting integration to align fiscal responsibility with environmental goals; this has helped organizations reduce their carbon footprint by 12%.
  • Demand for finops for containerized environments is surging, necessitating advanced tools for container cost optimization. AI/ML cost management is becoming a specialized field, with generative AI cost tracking providing granular visibility into high-spend workloads. Enhanced finops tooling now incorporates sophisticated spend forecasting models, and firms leveraging these tools report a 15% improvement in budget accuracy.
  • This evolution enables more strategic cloud financial governance, moving beyond simple cloud waste reduction to proactive resource orchestration.

What challenges does the Cloud Finops Industry face during its growth?

  • The fragmentation of billing data across multi-cloud platforms and the absence of data standardization present a key challenge to market growth.

  • Significant challenges persist, primarily from the lack of a standardized cloud billing data schema, which complicates shared cost distribution and necessitates complex platform engineering integration. Without a unified schema, organizations spend up to 30% of their FinOps team's time on manual data cleansing, hindering the adoption of cost-aware architecture.
  • The financial unpredictability of AI workloads, coupled with immature chargeback for shared services, can lead to budget overruns exceeding 50% on specific projects. Overcoming cultural silos requires more than just tools; it demands a shift toward infrastructure as code for cost and a defined finops lifecycle management process.
  • Furthermore, inconsistent tagging and labeling strategy makes effective shared services cost allocation nearly impossible, limiting the effectiveness of cloud cost intelligence and cost optimization automation.

Exclusive Technavio Analysis on Customer Landscape

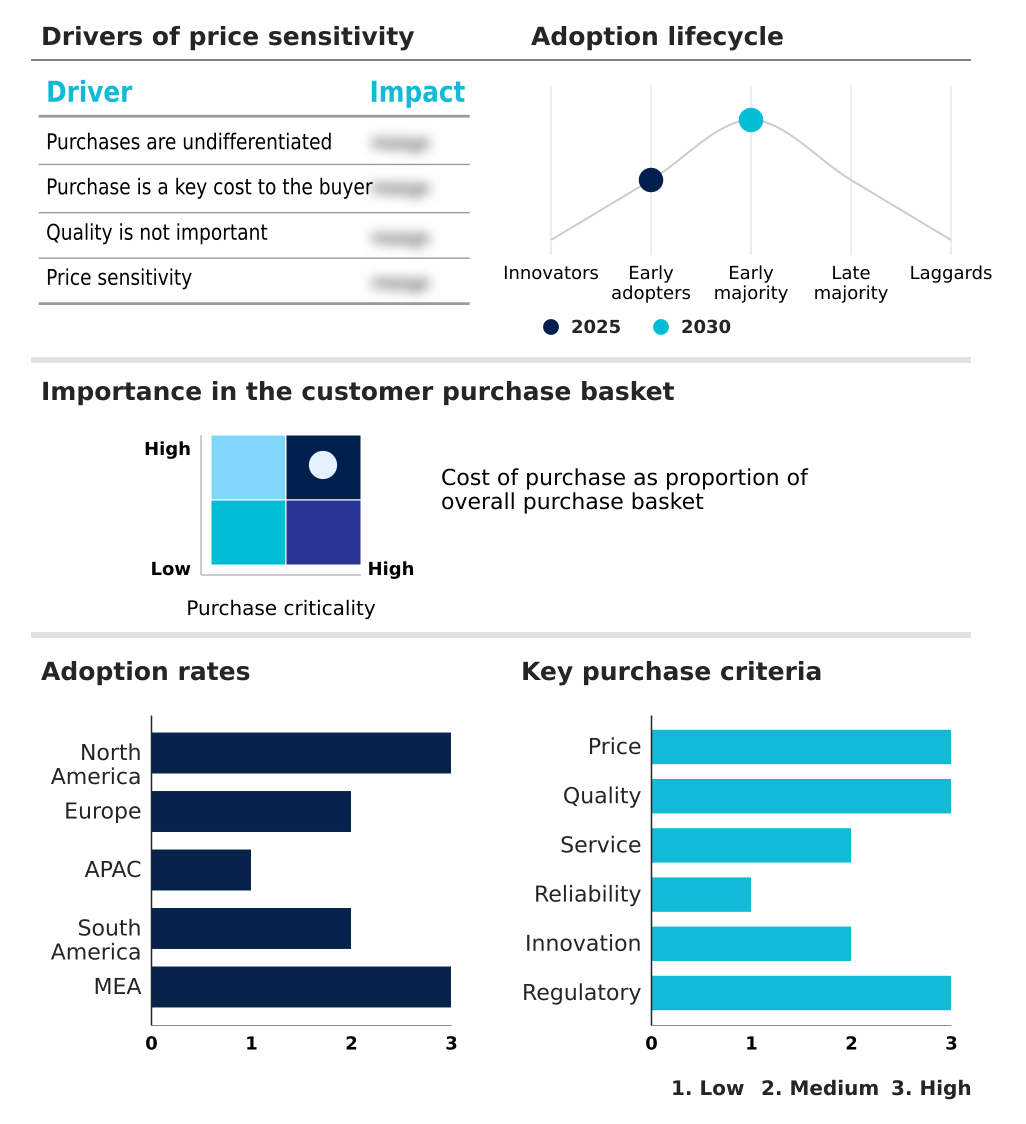
The cloud finops market forecasting report includes the adoption lifecycle of the market, covering from the innovator’s stage to the laggard’s stage. It focuses on adoption rates in different regions based on penetration. Furthermore, the cloud finops market report also includes key purchase criteria and drivers of price sensitivity to help companies evaluate and develop their market growth analysis strategies.

Customer Landscape of Cloud Finops Industry

Competitive Landscape

Companies are implementing various strategies, such as strategic alliances, cloud finops market forecast, partnerships, mergers and acquisitions, geographical expansion, and product/service launches, to enhance their presence in the industry.

Accenture Plc - Delivers integrated multi-cloud financial management solutions, leveraging advisory, automation, and managed services to optimize spend and enhance governance.

The industry research and growth report includes detailed analyses of the competitive landscape of the market and information about key companies, including:

  • Accenture Plc
  • Amazon.com Inc.
  • Anodot Ltd.
  • Broadcom Inc.
  • CAST AI Group Inc.
  • CloudZero Inc.
  • Datadog Inc.
  • DoiT International
  • Dynatrace Inc.
  • Flexera Software LLC
  • Google LLC
  • Harness Inc.
  • IBM Corp.
  • Microsoft Corp.
  • NetApp Inc.
  • New Relic Inc.
  • Nutanix Inc.
  • ProsperOps Inc.
  • Snowflake Inc.
  • Ternary Inc.

Qualitative and quantitative analysis of companies has been conducted to help clients understand the wider business environment as well as the strengths and weaknesses of key industry players. Data is qualitatively analyzed to categorize companies as pure play, category-focused, industry-focused, and diversified; it is quantitatively analyzed to categorize companies as dominant, leading, strong, tentative, and weak.

Recent Development and News in Cloud finops market

  • In April 2025, the FinOps Foundation released version 1.1 of the FinOps Open Cost and Usage Specification (FOCUS), providing a common schema to normalize cloud billing data across providers.
  • In June 2025, IBM announced a significant enhancement to its Turbonomic platform, integrating a generative AI engine to perform autonomous cloud cost remediation and reallocate reserved instances.
  • In August 2025, Amazon Web Services introduced specialized cost monitoring and budget alerting features within its management console, designed specifically for generative AI applications to track model training and inference expenses.
  • In October 2025, Google Cloud launched significant enhancements to its unified FinOps Hub, which integrated business value metrics directly with infrastructure cost data to provide a clearer view of unit economics.

Dive into Technavio’s robust research methodology, blending expert interviews, extensive data synthesis, and validated models for unparalleled Cloud Finops Market insights. See full methodology.

Market Scope
Page number 307
Base year 2025
Historic period 2020-2024
Forecast period 2026-2030
Growth momentum & CAGR Accelerate at a CAGR of 14.4%
Market growth 2026-2030 USD 14829.1 million
Market structure Fragmented
YoY growth 2025-2026(%) 12.6%
Key countries US, Canada, Mexico, Germany, UK, France, Italy, Spain, The Netherlands, China, India, Japan, South Korea, Australia, Indonesia, Brazil, Argentina, Chile, UAE, Saudi Arabia, South Africa, Egypt and Turkey
Competitive landscape Leading Companies, Market Positioning of Companies, Competitive Strategies, and Industry Risks

Request Free Sample

Research Analyst Overview

  • The Cloud FinOps market is solidifying its role as a non-negotiable business discipline, moving beyond IT departments to become a central pillar of corporate strategy. The practice centers on creating cost-aware architecture and implementing rigorous financial governance automation. Key mechanisms include cloud cost allocation, unit economics calculation, and kubernetes cost management, which are now standard operating procedures for efficient organizations.
  • The evolution is toward proactive and predictive control, using tools for cloud cost anomaly detection and automated rightsizing to prevent budget variances. At the boardroom level, these capabilities directly influence product profitability and strategic planning, as a detailed understanding of technology value streams allows for more accurate financial modeling.
  • For instance, enterprises adopting a mature approach with disciplined reserved instance management and savings plan automation have achieved an infrastructure cost-to-revenue ratio improvement of over 10%. This is supported by the finops open cost and usage specification, which facilitates multi-cloud cost normalization and effective shared cost distribution through standardized chargeback and showback models.
  • The integration of sustainability reporting integration is also becoming a critical component of this framework.

What are the Key Data Covered in this Cloud Finops Market Research and Growth Report?

  • What is the expected growth of the Cloud Finops Market between 2026 and 2030?

    • USD 14.83 billion, at a CAGR of 14.4%

  • What segmentation does the market report cover?

    • The report is segmented by Deployment (Public cloud, Hybrid, and Private cloud), Application (Cost allocation and chargeback, Budgeting and forecasting, Cost allocation and chargeback, Reporting and analytics, and Others), Business Segment (Large enterprises, and Small and medium enterprises) and Geography (North America, Europe, APAC, South America, Middle East and Africa)

  • Which regions are analyzed in the report?

    • North America, Europe, APAC, South America and Middle East and Africa

  • What are the key growth drivers and market challenges?

    • Standardization across heterogeneous multi-cloud environments, Fragmentation of multi-cloud billing and absence of data standardization

  • Who are the major players in the Cloud Finops Market?

    • Accenture Plc, Amazon.com Inc., Anodot Ltd., Broadcom Inc., CAST AI Group Inc., CloudZero Inc., Datadog Inc., DoiT International, Dynatrace Inc., Flexera Software LLC, Google LLC, Harness Inc., IBM Corp., Microsoft Corp., NetApp Inc., New Relic Inc., Nutanix Inc., ProsperOps Inc., Snowflake Inc. and Ternary Inc.

Market Research Insights

  • The market is undergoing a dynamic shift as organizations move beyond basic reporting to embrace strategic cloud financial planning. This evolution is marked by a focus on cloud spend optimization techniques that create financial accountability in engineering teams, with mature practices reducing misconfigured cloud spend by up to 25%.
  • Establishing a finops center of excellence has become a key strategy, enabling governance for decentralized teams and improving budget adherence by over 15%. The core objective is to link cloud spend to revenue, using metrics like unit cost for digital products to measure the business value of cloud investments.
  • This data-driven approach ensures that all technology decisions are fiscally sound and aligned with corporate goals, transforming cloud costs from an unpredictable overhead into a managed component of business strategy.

We can help! Our analysts can customize this cloud finops market research report to meet your requirements.

Get in touch

1. Executive Summary

1.1 Market overview

Executive Summary - Chart on Market Overview
Executive Summary - Data Table on Market Overview
Executive Summary - Chart on Global Market Characteristics
Executive Summary - Chart on Market by Geography
Executive Summary - Chart on Market Segmentation by Deployment
Executive Summary - Chart on Market Segmentation by Application
Executive Summary - Chart on Market Segmentation by Business Segment
Executive Summary - Chart on Incremental Growth
Executive Summary - Data Table on Incremental Growth
Executive Summary - Chart on Company Market Positioning

2. Technavio Analysis

2.1 Analysis of price sensitivity, lifecycle, customer purchase basket, adoption rates, and purchase criteria

2.2 Criticality of inputs and Factors of differentiation

Chart on Overview on criticality of inputs and factors of differentiation

2.3 Factors of disruption

Chart on Overview on factors of disruption

2.4 Impact of drivers and challenges

Chart on Impact of drivers and challenges in 2025 and 2030

3. Market Landscape

3.1 Market ecosystem

Chart on Parent Market
Data Table on - Parent Market

3.2 Market characteristics

Chart on Market characteristics analysis

3.3 Value chain analysis

Chart on Value chain analysis

4. Market Sizing

4.1 Market definition

Data Table on Offerings of companies included in the market definition

4.2 Market segment analysis

Market segments

4.3 Market size 2025

4.4 Market outlook: Forecast for 2025-2030

Chart on Global - Market size and forecast 2025-2030 ($ million)
Data Table on Global - Market size and forecast 2025-2030 ($ million)
Chart on Global Market: Year-over-year growth 2025-2030 (%)
Data Table on Global Market: Year-over-year growth 2025-2030 (%)

5. Historic Market Size

5.1 Global Cloud FinOps Market 2020 - 2024

Historic Market Size - Data Table on Global Cloud FinOps Market 2020 - 2024 ($ million)

5.2 Deployment segment analysis 2020 - 2024

Historic Market Size - Deployment Segment 2020 - 2024 ($ million)

5.3 Application segment analysis 2020 - 2024

Historic Market Size - Application Segment 2020 - 2024 ($ million)

5.4 Business segment analysis 2020 - 2024

Historic Market Size - Business Segment 2020 - 2024 ($ million)

5.5 Geography segment analysis 2020 - 2024

Historic Market Size - Geography Segment 2020 - 2024 ($ million)

5.6 Country segment analysis 2020 - 2024

Historic Market Size - Country Segment 2020 - 2024 ($ million)

6. Qualitative Analysis

6.1 The AI impact on Global Cloud FinOps Market

7. Five Forces Analysis

7.1 Five forces summary

Five forces analysis - Comparison between 2025 and 2030

7.2 Bargaining power of buyers

Bargaining power of buyers - Impact of key factors 2025 and 2030

7.3 Bargaining power of suppliers

Bargaining power of suppliers - Impact of key factors in 2025 and 2030

7.4 Threat of new entrants

Threat of new entrants - Impact of key factors in 2025 and 2030

7.5 Threat of substitutes

Threat of substitutes - Impact of key factors in 2025 and 2030

7.6 Threat of rivalry

Threat of rivalry - Impact of key factors in 2025 and 2030

7.7 Market condition

Chart on Market condition - Five forces 2025 and 2030

8. Market Segmentation by Deployment

8.1 Market segments

Chart on Deployment - Market share 2025-2030 (%)
Data Table on Deployment - Market share 2025-2030 (%)

8.2 Comparison by Deployment

Chart on Comparison by Deployment
Data Table on Comparison by Deployment

8.3 Public cloud - Market size and forecast 2025-2030

Chart on Public cloud - Market size and forecast 2025-2030 ($ million)
Data Table on Public cloud - Market size and forecast 2025-2030 ($ million)
Chart on Public cloud - Year-over-year growth 2025-2030 (%)
Data Table on Public cloud - Year-over-year growth 2025-2030 (%)

8.4 Hybrid - Market size and forecast 2025-2030

Chart on Hybrid - Market size and forecast 2025-2030 ($ million)
Data Table on Hybrid - Market size and forecast 2025-2030 ($ million)
Chart on Hybrid - Year-over-year growth 2025-2030 (%)
Data Table on Hybrid - Year-over-year growth 2025-2030 (%)

8.5 Private cloud - Market size and forecast 2025-2030

Chart on Private cloud - Market size and forecast 2025-2030 ($ million)
Data Table on Private cloud - Market size and forecast 2025-2030 ($ million)
Chart on Private cloud - Year-over-year growth 2025-2030 (%)
Data Table on Private cloud - Year-over-year growth 2025-2030 (%)

8.6 Market opportunity by Deployment

Market opportunity by Deployment ($ million)
Data Table on Market opportunity by Deployment ($ million)

9. Market Segmentation by Application

9.1 Market segments

Chart on Application - Market share 2025-2030 (%)
Data Table on Application - Market share 2025-2030 (%)

9.2 Comparison by Application

Chart on Comparison by Application
Data Table on Comparison by Application

9.3 Cost management and optimization - Market size and forecast 2025-2030

Chart on Cost management and optimization - Market size and forecast 2025-2030 ($ million)
Data Table on Cost management and optimization - Market size and forecast 2025-2030 ($ million)
Chart on Cost management and optimization - Year-over-year growth 2025-2030 (%)
Data Table on Cost management and optimization - Year-over-year growth 2025-2030 (%)

9.4 Budgeting and forecasting - Market size and forecast 2025-2030

Chart on Budgeting and forecasting - Market size and forecast 2025-2030 ($ million)
Data Table on Budgeting and forecasting - Market size and forecast 2025-2030 ($ million)
Chart on Budgeting and forecasting - Year-over-year growth 2025-2030 (%)
Data Table on Budgeting and forecasting - Year-over-year growth 2025-2030 (%)

9.5 Cost allocation and chargeback - Market size and forecast 2025-2030

Chart on Cost allocation and chargeback - Market size and forecast 2025-2030 ($ million)
Data Table on Cost allocation and chargeback - Market size and forecast 2025-2030 ($ million)
Chart on Cost allocation and chargeback - Year-over-year growth 2025-2030 (%)
Data Table on Cost allocation and chargeback - Year-over-year growth 2025-2030 (%)

9.6 Reporting and analytics - Market size and forecast 2025-2030

Chart on Reporting and analytics - Market size and forecast 2025-2030 ($ million)
Data Table on Reporting and analytics - Market size and forecast 2025-2030 ($ million)
Chart on Reporting and analytics - Year-over-year growth 2025-2030 (%)
Data Table on Reporting and analytics - Year-over-year growth 2025-2030 (%)

9.7 Others - Market size and forecast 2025-2030

Chart on Others - Market size and forecast 2025-2030 ($ million)
Data Table on Others - Market size and forecast 2025-2030 ($ million)
Chart on Others - Year-over-year growth 2025-2030 (%)
Data Table on Others - Year-over-year growth 2025-2030 (%)

9.8 Market opportunity by Application

Market opportunity by Application ($ million)
Data Table on Market opportunity by Application ($ million)

10. Market Segmentation by Business Segment

10.1 Market segments

Chart on Market Segmentation by Business Segment - Market share 2025-2030 (%)
Data Table on Market Segmentation by Business Segment - Market share 2025-2030 (%)

10.2 Comparison by Market Segmentation by Business Segment

Chart on Comparison by Market Segmentation by Business Segment
Data Table on Comparison by Market Segmentation by Business Segment

10.3 Large enterprises - Market size and forecast 2025-2030

Chart on Large enterprises - Market size and forecast 2025-2030 ($ million)
Data Table on Large enterprises - Market size and forecast 2025-2030 ($ million)
Chart on Large enterprises - Year-over-year growth 2025-2030 (%)
Data Table on Large enterprises - Year-over-year growth 2025-2030 (%)

10.4 Small and medium enterprises - Market size and forecast 2025-2030

Chart on Small and medium enterprises - Market size and forecast 2025-2030 ($ million)
Data Table on Small and medium enterprises - Market size and forecast 2025-2030 ($ million)
Chart on Small and medium enterprises - Year-over-year growth 2025-2030 (%)
Data Table on Small and medium enterprises - Year-over-year growth 2025-2030 (%)

10.5 Market opportunity by Market Segmentation by Business Segment

Market opportunity by Market Segmentation by Business Segment ($ million)
Data Table on Market opportunity by Market Segmentation by Business Segment ($ million)

11. Customer Landscape

11.1 Customer landscape overview

Analysis of price sensitivity, lifecycle, customer purchase basket, adoption rates, and purchase criteria

12. Geographic Landscape

12.1 Geographic segmentation

Chart on Market share by geography 2025-2030 (%)
Data Table on Market share by geography 2025-2030 (%)

12.2 Geographic comparison

Chart on Geographic comparison
Data Table on Geographic comparison

12.3 North America - Market size and forecast 2025-2030

Chart on North America - Market size and forecast 2025-2030 ($ million)
Data Table on North America - Market size and forecast 2025-2030 ($ million)
Chart on North America - Year-over-year growth 2025-2030 (%)
Data Table on North America - Year-over-year growth 2025-2030 (%)
Chart on Regional Comparison - North America
Data Table on Regional Comparison - North America

12.3.1 US - Market size and forecast 2025-2030

Chart on US - Market size and forecast 2025-2030 ($ million)
Data Table on US - Market size and forecast 2025-2030 ($ million)
Chart on US - Year-over-year growth 2025-2030 (%)
Data Table on US - Year-over-year growth 2025-2030 (%)

12.3.2 Canada - Market size and forecast 2025-2030

Chart on Canada - Market size and forecast 2025-2030 ($ million)
Data Table on Canada - Market size and forecast 2025-2030 ($ million)
Chart on Canada - Year-over-year growth 2025-2030 (%)
Data Table on Canada - Year-over-year growth 2025-2030 (%)

12.3.3 Mexico - Market size and forecast 2025-2030

Chart on Mexico - Market size and forecast 2025-2030 ($ million)
Data Table on Mexico - Market size and forecast 2025-2030 ($ million)
Chart on Mexico - Year-over-year growth 2025-2030 (%)
Data Table on Mexico - Year-over-year growth 2025-2030 (%)

12.4 Europe - Market size and forecast 2025-2030

Chart on Europe - Market size and forecast 2025-2030 ($ million)
Data Table on Europe - Market size and forecast 2025-2030 ($ million)
Chart on Europe - Year-over-year growth 2025-2030 (%)
Data Table on Europe - Year-over-year growth 2025-2030 (%)
Chart on Regional Comparison - Europe
Data Table on Regional Comparison - Europe

12.4.1 Germany - Market size and forecast 2025-2030

Chart on Germany - Market size and forecast 2025-2030 ($ million)
Data Table on Germany - Market size and forecast 2025-2030 ($ million)
Chart on Germany - Year-over-year growth 2025-2030 (%)
Data Table on Germany - Year-over-year growth 2025-2030 (%)

12.4.2 UK - Market size and forecast 2025-2030

Chart on UK - Market size and forecast 2025-2030 ($ million)
Data Table on UK - Market size and forecast 2025-2030 ($ million)
Chart on UK - Year-over-year growth 2025-2030 (%)
Data Table on UK - Year-over-year growth 2025-2030 (%)

12.4.3 France - Market size and forecast 2025-2030

Chart on France - Market size and forecast 2025-2030 ($ million)
Data Table on France - Market size and forecast 2025-2030 ($ million)
Chart on France - Year-over-year growth 2025-2030 (%)
Data Table on France - Year-over-year growth 2025-2030 (%)

12.4.4 Italy - Market size and forecast 2025-2030

Chart on Italy - Market size and forecast 2025-2030 ($ million)
Data Table on Italy - Market size and forecast 2025-2030 ($ million)
Chart on Italy - Year-over-year growth 2025-2030 (%)
Data Table on Italy - Year-over-year growth 2025-2030 (%)

12.4.5 Spain - Market size and forecast 2025-2030

Chart on Spain - Market size and forecast 2025-2030 ($ million)
Data Table on Spain - Market size and forecast 2025-2030 ($ million)
Chart on Spain - Year-over-year growth 2025-2030 (%)
Data Table on Spain - Year-over-year growth 2025-2030 (%)

12.4.6 The Netherlands - Market size and forecast 2025-2030

Chart on The Netherlands - Market size and forecast 2025-2030 ($ million)
Data Table on The Netherlands - Market size and forecast 2025-2030 ($ million)
Chart on The Netherlands - Year-over-year growth 2025-2030 (%)
Data Table on The Netherlands - Year-over-year growth 2025-2030 (%)

12.5 APAC - Market size and forecast 2025-2030

Chart on APAC - Market size and forecast 2025-2030 ($ million)
Data Table on APAC - Market size and forecast 2025-2030 ($ million)
Chart on APAC - Year-over-year growth 2025-2030 (%)
Data Table on APAC - Year-over-year growth 2025-2030 (%)
Chart on Regional Comparison - APAC
Data Table on Regional Comparison - APAC

12.5.1 China - Market size and forecast 2025-2030

Chart on China - Market size and forecast 2025-2030 ($ million)
Data Table on China - Market size and forecast 2025-2030 ($ million)
Chart on China - Year-over-year growth 2025-2030 (%)
Data Table on China - Year-over-year growth 2025-2030 (%)

12.5.2 India - Market size and forecast 2025-2030

Chart on India - Market size and forecast 2025-2030 ($ million)
Data Table on India - Market size and forecast 2025-2030 ($ million)
Chart on India - Year-over-year growth 2025-2030 (%)
Data Table on India - Year-over-year growth 2025-2030 (%)

12.5.3 Japan - Market size and forecast 2025-2030

Chart on Japan - Market size and forecast 2025-2030 ($ million)
Data Table on Japan - Market size and forecast 2025-2030 ($ million)
Chart on Japan - Year-over-year growth 2025-2030 (%)
Data Table on Japan - Year-over-year growth 2025-2030 (%)

12.5.4 South Korea - Market size and forecast 2025-2030

Chart on South Korea - Market size and forecast 2025-2030 ($ million)
Data Table on South Korea - Market size and forecast 2025-2030 ($ million)
Chart on South Korea - Year-over-year growth 2025-2030 (%)
Data Table on South Korea - Year-over-year growth 2025-2030 (%)

12.5.5 Australia - Market size and forecast 2025-2030

Chart on Australia - Market size and forecast 2025-2030 ($ million)
Data Table on Australia - Market size and forecast 2025-2030 ($ million)
Chart on Australia - Year-over-year growth 2025-2030 (%)
Data Table on Australia - Year-over-year growth 2025-2030 (%)

12.5.6 Indonesia - Market size and forecast 2025-2030

Chart on Indonesia - Market size and forecast 2025-2030 ($ million)
Data Table on Indonesia - Market size and forecast 2025-2030 ($ million)
Chart on Indonesia - Year-over-year growth 2025-2030 (%)
Data Table on Indonesia - Year-over-year growth 2025-2030 (%)

12.6 South America - Market size and forecast 2025-2030

Chart on South America - Market size and forecast 2025-2030 ($ million)
Data Table on South America - Market size and forecast 2025-2030 ($ million)
Chart on South America - Year-over-year growth 2025-2030 (%)
Data Table on South America - Year-over-year growth 2025-2030 (%)
Chart on Regional Comparison - South America
Data Table on Regional Comparison - South America

12.6.1 Brazil - Market size and forecast 2025-2030

Chart on Brazil - Market size and forecast 2025-2030 ($ million)
Data Table on Brazil - Market size and forecast 2025-2030 ($ million)
Chart on Brazil - Year-over-year growth 2025-2030 (%)
Data Table on Brazil - Year-over-year growth 2025-2030 (%)

12.6.2 Argentina - Market size and forecast 2025-2030

Chart on Argentina - Market size and forecast 2025-2030 ($ million)
Data Table on Argentina - Market size and forecast 2025-2030 ($ million)
Chart on Argentina - Year-over-year growth 2025-2030 (%)
Data Table on Argentina - Year-over-year growth 2025-2030 (%)

12.6.3 Chile - Market size and forecast 2025-2030

Chart on Chile - Market size and forecast 2025-2030 ($ million)
Data Table on Chile - Market size and forecast 2025-2030 ($ million)
Chart on Chile - Year-over-year growth 2025-2030 (%)
Data Table on Chile - Year-over-year growth 2025-2030 (%)

12.7 Middle East and Africa - Market size and forecast 2025-2030

Chart on Middle East and Africa - Market size and forecast 2025-2030 ($ million)
Data Table on Middle East and Africa - Market size and forecast 2025-2030 ($ million)
Chart on Middle East and Africa - Year-over-year growth 2025-2030 (%)
Data Table on Middle East and Africa - Year-over-year growth 2025-2030 (%)
Chart on Regional Comparison - Middle East and Africa
Data Table on Regional Comparison - Middle East and Africa

12.7.1 UAE - Market size and forecast 2025-2030

Chart on UAE - Market size and forecast 2025-2030 ($ million)
Data Table on UAE - Market size and forecast 2025-2030 ($ million)
Chart on UAE - Year-over-year growth 2025-2030 (%)
Data Table on UAE - Year-over-year growth 2025-2030 (%)

12.7.2 Saudi Arabia - Market size and forecast 2025-2030

Chart on Saudi Arabia - Market size and forecast 2025-2030 ($ million)
Data Table on Saudi Arabia - Market size and forecast 2025-2030 ($ million)
Chart on Saudi Arabia - Year-over-year growth 2025-2030 (%)
Data Table on Saudi Arabia - Year-over-year growth 2025-2030 (%)

12.7.3 South Africa - Market size and forecast 2025-2030

Chart on South Africa - Market size and forecast 2025-2030 ($ million)
Data Table on South Africa - Market size and forecast 2025-2030 ($ million)
Chart on South Africa - Year-over-year growth 2025-2030 (%)
Data Table on South Africa - Year-over-year growth 2025-2030 (%)

12.7.4 Egypt - Market size and forecast 2025-2030

Chart on Egypt - Market size and forecast 2025-2030 ($ million)
Data Table on Egypt - Market size and forecast 2025-2030 ($ million)
Chart on Egypt - Year-over-year growth 2025-2030 (%)
Data Table on Egypt - Year-over-year growth 2025-2030 (%)

12.7.5 Turkey - Market size and forecast 2025-2030

Chart on Turkey - Market size and forecast 2025-2030 ($ million)
Data Table on Turkey - Market size and forecast 2025-2030 ($ million)
Chart on Turkey - Year-over-year growth 2025-2030 (%)
Data Table on Turkey - Year-over-year growth 2025-2030 (%)

12.8 Market opportunity by geography

Market opportunity by geography ($ million)
Data Tables on Market opportunity by geography ($ million)

13. Drivers, Challenges, and Opportunity

13.1 Market drivers

Standardization across heterogeneous multi-cloud environments
Managing unprecedented costs of AI and ML
Institutionalization of financial accountability and unit economics

13.2 Market challenges

Fragmentation of multi-cloud billing and absence of data standardization
Structural organizational silos and persistence of cultural resistance
Financial unpredictability of generative AI and GPU resources

13.3 Impact of drivers and challenges

Impact of drivers and challenges in 2025 and 2030

13.4 Market opportunities

Autonomous financial governance through generative artificial intelligence
Convergence of financial management and environmental sustainability
Standardization and expansion of finops to entire technology stack

14. Competitive Landscape

14.1 Overview

14.2

Overview on criticality of inputs and factors of differentiation

14.3 Landscape disruption

Overview on factors of disruption

14.4 Industry risks

Impact of key risks on business

15. Competitive Analysis

15.1 Companies profiled

Companies covered

15.2 Company ranking index

15.3 Market positioning of companies

Matrix on companies position and classification

15.4 Accenture Plc

Accenture Plc - Overview
Accenture Plc - Business segments
Accenture Plc - Key news
Accenture Plc - Key offerings
Accenture Plc - Segment focus
SWOT

15.5 Amazon.com Inc.

Amazon.com Inc. - Overview
Amazon.com Inc. - Business segments
Amazon.com Inc. - Key news
Amazon.com Inc. - Key offerings
Amazon.com Inc. - Segment focus
SWOT

15.6 Anodot Ltd.

Anodot Ltd. - Overview
Anodot Ltd. - Product / Service
Anodot Ltd. - Key offerings
SWOT

15.7 Broadcom Inc.

Broadcom Inc. - Overview
Broadcom Inc. - Business segments
Broadcom Inc. - Key news
Broadcom Inc. - Key offerings
Broadcom Inc. - Segment focus
SWOT

15.8 CAST AI Group Inc.

CAST AI Group Inc. - Overview
CAST AI Group Inc. - Product / Service
CAST AI Group Inc. - Key offerings
SWOT

15.9 CloudZero Inc.

CloudZero Inc. - Overview
CloudZero Inc. - Product / Service
CloudZero Inc. - Key offerings
SWOT

15.10 Datadog Inc.

Datadog Inc. - Overview
Datadog Inc. - Product / Service
Datadog Inc. - Key offerings
SWOT

15.11 DoiT International

DoiT International - Overview
DoiT International - Product / Service
DoiT International - Key offerings
SWOT

15.12 Dynatrace Inc.

Dynatrace Inc. - Overview
Dynatrace Inc. - Product / Service
Dynatrace Inc. - Key news
Dynatrace Inc. - Key offerings
SWOT

15.13 Flexera Software LLC

Flexera Software LLC - Overview
Flexera Software LLC - Product / Service
Flexera Software LLC - Key offerings
SWOT

15.14 Google LLC

Google LLC - Overview
Google LLC - Product / Service
Google LLC - Key offerings
SWOT

15.15 Harness Inc.

Harness Inc. - Overview
Harness Inc. - Product / Service
Harness Inc. - Key offerings
SWOT

15.16 IBM Corp.

IBM Corp. - Overview
IBM Corp. - Business segments
IBM Corp. - Key news
IBM Corp. - Key offerings
IBM Corp. - Segment focus
SWOT

15.17 Microsoft Corp.

Microsoft Corp. - Overview
Microsoft Corp. - Business segments
Microsoft Corp. - Key news
Microsoft Corp. - Key offerings
Microsoft Corp. - Segment focus
SWOT

15.18 NetApp Inc.

NetApp Inc. - Overview
NetApp Inc. - Product / Service
NetApp Inc. - Key news
NetApp Inc. - Key offerings
SWOT

16. Appendix

16.1 Scope of the report

Market definition
Objectives
Notes and caveats

16.2 Inclusions and exclusions checklist

Inclusions checklist
Exclusions checklist

16.3 Currency conversion rates for US$

16.4 Research methodology

16.5 Data procurement

Information sources

16.6 Data validation

16.7 Validation techniques employed for market sizing

16.8 Data synthesis

16.9 360 degree market analysis

16.10 List of abbreviations

Research Methodology

Technavio presents a detailed picture of the market by way of study, synthesis, and summation of data from multiple sources. The analysts have presented the various facets of the market with a particular focus on identifying the key industry influencers. The data thus presented is comprehensive, reliable, and the result of extensive research, both primary and secondary.

INFORMATION SOURCES

Primary sources

  • Manufacturers and suppliers
  • Channel partners
  • Industry experts
  • Strategic decision makers

Secondary sources

  • Industry journals and periodicals
  • Government data
  • Financial reports of key industry players
  • Historical data
  • Press releases

DATA ANALYSIS

Data Synthesis

  • Collation of data
  • Estimation of key figures
  • Analysis of derived insights

Data Validation

  • Triangulation with data models
  • Reference against proprietary databases
  • Corroboration with industry experts

REPORT WRITING

Qualitative

  • Market drivers
  • Market challenges
  • Market trends
  • Five forces analysis

Quantitative

  • Market size and forecast
  • Market segmentation
  • Geographical insights
  • Competitive landscape

Interested in this report?

Get your sample now to see our research methodology and insights!

Download Now

Frequently Asked Questions

Cloud Finops market growth will increase by USD 14829.1 million during 2026-2030.

The Cloud Finops market is expected to grow at a CAGR of 14.4% during 2026-2030.

Cloud Finops market is segmented by Deployment (Public cloud, Hybrid, Private cloud) Application (Cost management and optimization, Budgeting and forecasting, Cost allocation and chargeback, Reporting and analytics, Others) Business segment (Large enterprises, Small and medium enterprises)

Accenture Plc, Amazon.com Inc., Anodot Ltd., Broadcom Inc., CAST AI Group Inc., CloudZero Inc., Datadog Inc., DoiT International, Dynatrace Inc., Flexera Software LLC, Google LLC, Harness Inc., IBM Corp., Microsoft Corp., NetApp Inc., New Relic Inc., Nutanix Inc., ProsperOps Inc., Snowflake Inc., Ternary Inc. are a few of the key vendors in the Cloud Finops market.

North America will register the highest growth rate of 38.9% among the other regions. Therefore, the Cloud Finops market in North America is expected to garner significant business opportunities for the vendors during the forecast period.

US, Canada, Mexico, Germany, UK, France, Italy, Spain, The Netherlands, China, India, Japan, South Korea, Australia, Indonesia, Brazil, Argentina, Chile, UAE, Saudi Arabia, South Africa, Egypt, Turkey

  • Standardization across heterogeneous multi-cloud environments is the driving factor this market.

The Cloud Finops market vendors should focus on grabbing business opportunities from the Deployment segment as it accounted for the largest market share in the base year.
RIA - Research AI Assistant
Ask RIA