Coal Tar Market Analysis, Size, and Forecast 2026-2030: APAC (China, India, and Japan), Europe (Germany, UK, and France), North America (US, Canada, and Mexico), South America (Brazil and Argentina), Middle East and Africa (Saudi Arabia, South Africa, and UAE), and Rest of World (ROW)

Coal Tar Market Analysis, Size, and Forecast 2026-2030:
APAC (China, India, and Japan), Europe (Germany, UK, and France), North America (US, Canada, and Mexico), South America (Brazil and Argentina), Middle East and Africa (Saudi Arabia, South Africa, and UAE), and Rest of World (ROW)

Published: Mar 2026 301 Pages SKU: IRTNTR41354

Market Overview at a Glance

$2.40 B
Market Opportunity
2.8%
CAGR 2025 - 2030
81.8%
APAC Growth
$7.23 B
Low temperature coal tar segment 2024

Coal Tar Market Size 2026-2030

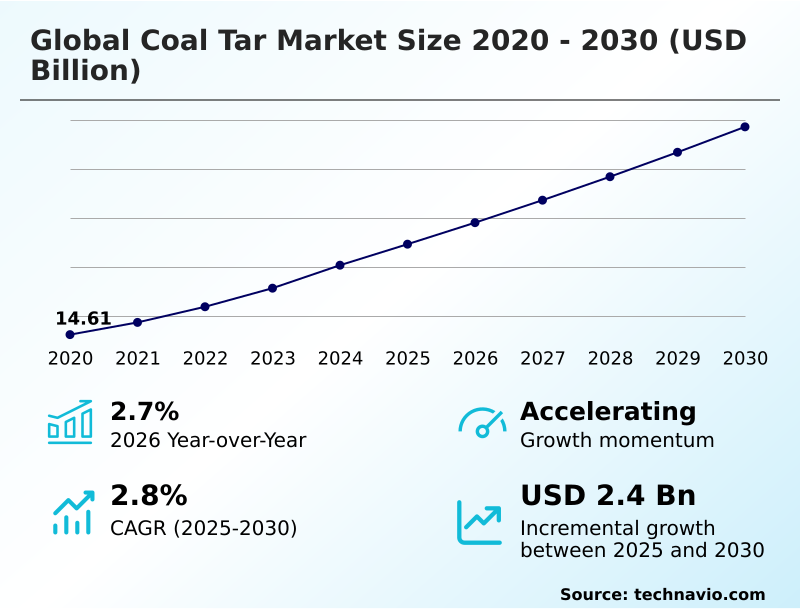
The coal tar market size is valued to increase by USD 2.40 billion, at a CAGR of 2.8% from 2025 to 2030. Increasing demand from aluminum industry will drive the coal tar market.

Major Market Trends & Insights

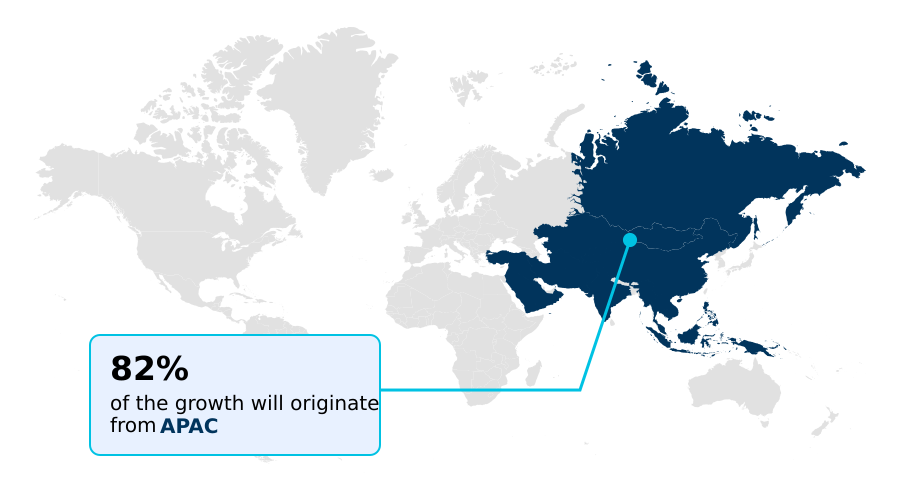
  • APAC dominated the market and accounted for a 81.8% growth during the forecast period.
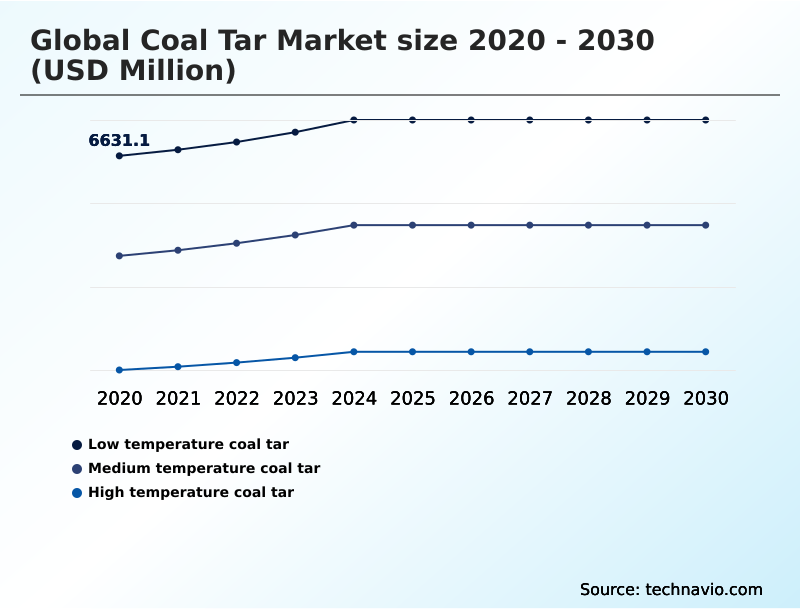
  • By Type - Low temperature coal tar segment was valued at USD 7.23 billion in 2024
  • By Application - Coal tar pitch processing segment accounted for the largest market revenue share in 2024

Market Size & Forecast

  • Market Opportunities: USD 4.25 billion
  • Market Future Opportunities: USD 2.40 billion
  • CAGR from 2025 to 2030 : 2.8%

Market Summary

  • The coal tar market remains a vital industrial sector, sustained by its critical role in metallurgy and infrastructure. Its core driver is the consistent demand from the aluminum industry, which relies on coal tar pitch as an indispensable binder for producing aluminum anodes.
  • Beyond this, derivatives are essential in manufacturing graphite electrodes for steelmaking and as a feedstock for carbon black, a key reinforcing agent in tires. A key trend is the strategic pivot towards high-value applications and environmentally compliant formulations. Producers are developing low polycyclic aromatic hydrocarbon (PAH) products to meet stringent regulations, particularly in Europe.
  • For instance, a typical business scenario involves a producer investing in advanced distillation to create needle coke and mesophase pitch for lithium-ion battery anodes. This not only opens new revenue streams in the energy storage sector but also mitigates risks from feedstock volatility linked to declining coke oven operations.
  • This diversification, coupled with ongoing demand from construction for waterproofing compounds and pavement sealants, ensures the market’s resilience and continued relevance in a changing industrial landscape. Health and safety concerns, however, continue to influence operational protocols and investment decisions across the value chain.

What will be the Size of the Coal Tar Market during the forecast period?

Get Key Insights on Market Forecast (PDF) Request Free Sample

How is the Coal Tar Market Segmented?

The coal tar industry research report provides comprehensive data (region-wise segment analysis), with forecasts and estimates in "USD million" for the period 2026-2030, as well as historical data from 2020-2024 for the following segments.

  • Type
    • Low temperature coal tar
    • Medium temperature coal tar
    • High temperature coal tar
  • Application
    • Coal tar pitch processing
    • Carbon black
    • Others
  • End-user
    • Metallurgy
    • Automotive
    • Construction
    • Others
  • Geography
    • APAC
      • China
      • India
      • Japan
    • Europe
      • Germany
      • UK
      • France
    • North America
      • US
      • Canada
      • Mexico
    • South America
      • Brazil
      • Argentina
    • Middle East and Africa
      • Saudi Arabia
      • South Africa
      • UAE
    • Rest of World (ROW)

By Type Insights

The low temperature coal tar segment is estimated to witness significant growth during the forecast period.

The global coal tar market is segmented by type, application, and geography. The type segmentation includes low temperature, medium temperature, and high temperature coal tar, each possessing distinct chemical compositions.

Low temperature coal tar, processed below 700°C, is rich in phenolic compounds and serves as a primary feedstock for specialty resins and various carbon-based chemicals.

Application segmentation is dominated by coal tar pitch processing for metallurgical use, followed by carbon black production from aromatic oils. Other applications include pavement sealants and wood preservation using creosote oil.

Geographically, APAC leads due to its vast industrial base, while Europe focuses on high-value chemical intermediates, with some facilities achieving a 15% higher yield on specialty chemical blends.

Request Free Sample

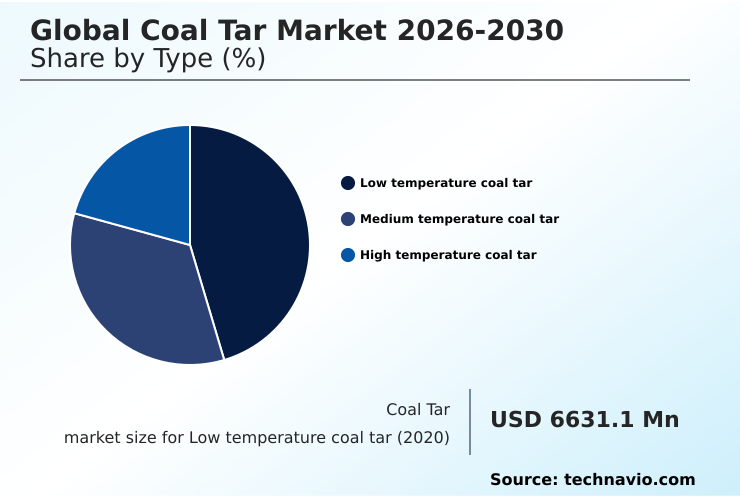
The Low temperature coal tar segment was valued at USD 7.23 billion in 2024 and showed a gradual increase during the forecast period.

Request Free Sample

Regional Analysis

APAC is estimated to contribute 81.8% to the growth of the global market during the forecast period.Technavio’s analysts have elaborately explained the regional trends and drivers that shape the market during the forecast period.

See How Coal Tar Market Demand is Rising in APAC Request Free Sample

The market's geographic landscape is dominated by APAC, which contributes over 80% of the incremental growth, driven by its expansive steel and aluminum sectors. This region's integrated operations provide a steady stream of coke oven by-product for distillation.

Demand for graphite electrodes and aluminum anode binders is paramount. North America and Europe represent mature markets focusing on high-value applications and regulatory compliance.

In these regions, there's a growing emphasis on refining feedstocks into naphthalene, anthracene, and precursors for mesophase pitch used in advanced composites and polymer processing. These high-purity oils are critical for specialty applications.

Meanwhile, demand for waterproofing compounds and carbon additives for construction remains steady globally, reinforcing the material's importance across diverse industrial economies.

Market Dynamics

Our researchers analyzed the data with 2025 as the base year, along with the key drivers, trends, and challenges. A holistic analysis of drivers will help companies refine their marketing strategies to gain a competitive advantage.

  • The global coal tar market 2026-2030 is evolving beyond its traditional strongholds, with strategic focus shifting toward technical optimization and high-value applications. The efficiency of coal tar pitch processing for aluminum anodes remains a central operational metric, directly impacting smelter productivity. Concurrently, the use of coal tar oils in carbon black production is being refined to enhance tire performance.
  • A major industry-wide effort is the development of low pah coal tar for environmental compliance, a response to tightening global regulations. This push for cleaner materials influences the entire metallurgical coke by-product value chain.
  • In advanced sectors, the creation of high purity needle coke from coal tar pitch is critical for graphite electrode manufacturing and the burgeoning demand for coal tar derivatives for lithium-ion battery anodes. Producers are also comparing coal tar and petroleum pitch binders to optimize performance and cost.
  • The health and safety in coal tar handling remains a boardroom-level concern, shaping investment in new technologies. This is especially true for coal tar-based sealants for infrastructure protection, where worker exposure is a key consideration.
  • The coal tar distillation process optimization is a continuous endeavor, as feedstock volatility impact on coal tar supply forces producers to maximize yield from available raw materials. One plant's optimization efforts led to a 10% higher recovery of valuable fractions compared to legacy systems.
  • This technical focus extends to developing advanced carbon materials from coal tar precursors and exploring coal tar applications in refractory materials. Furthermore, the market for medium temperature coal tar for chemical synthesis is expanding, alongside improved creosote oil formulation for wood preservation and the development of coal tar for high-performance industrial coatings.
  • Understanding the regulatory impact on coal tar derivatives market and the nuances of coal tar pitch properties for anode baking is crucial for navigating this complex landscape.

What are the key market drivers leading to the rise in the adoption of Coal Tar Industry?

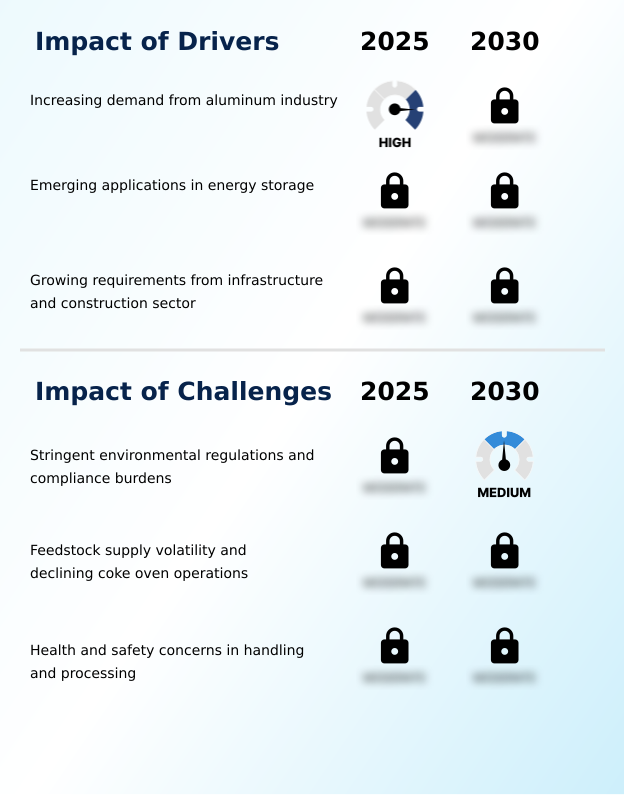
  • The increasing demand from the aluminum industry, where coal tar pitch is an essential binder for anodes, serves as the key driver for the market.

  • Demand from the aluminum industry for high-quality binder pitch is a primary market driver, as it is indispensable for manufacturing aluminum anodes. The anode baking process requires pitch that ensures high carbon yield and structural integrity.
  • This metallurgical use underpins market stability. Concurrently, requirements from infrastructure provide a steady secondary driver, utilizing creosote oil for wood preservation and other derivatives for refractory materials.
  • Aromatic oils are refined into industrial lubricants and coke oven chemicals, with some producers achieving a 15% improvement in distillation efficiency.
  • These carbon pitch derivatives support diverse sectors, ensuring resilient demand even as steel production methods evolve, which affects feedstock availability. This diversification ensures the market's relevance.

What are the market trends shaping the Coal Tar Industry?

  • The increasing adoption of low PAH and environmentally compliant formulations is emerging as a prominent market trend, driven by tightening regulations and demand for safer materials.

  • A prominent trend is the diversification into high-value applications beyond traditional uses. Producers are refining coal tar pitch to create precursors for needle coke and other industrial carbon materials for battery anodes and advanced composites. This shift leverages the unique properties of medium temperature coal tar to produce valuable chemical intermediates.
  • The adoption of low-PAH formulations is also accelerating, with compliant electrode pitch commanding premium prices and enhancing market access. Some firms have reduced hazardous constituents by over 40% while maintaining performance. Strategic capacity expansions are underway to serve growing demand for carbon black feedstock and high-performance industrial carbon, ensuring supply reliability for downstream industries that utilize these specialty chemical blends.

What challenges does the Coal Tar Industry face during its growth?

  • Stringent environmental regulations and the associated compliance burdens represent a key challenge affecting industry growth and operational costs.

  • Significant challenges stem from stringent regulations on polycyclic aromatic hydrocarbons (PAHs), which are inherent in high temperature coal tar. Compliance elevates operational costs, with some facilities reporting a 20% increase in capital expenditure for abatement technologies. Feedstock volatility, linked to declines in coal carbonization and shifting steel production, creates supply chain uncertainty for coke oven tar.
  • This affects the production of refined coal tar and its derivatives, including materials for wood preservation and pipeline protection coatings. Health and safety concerns in handling these materials add another layer of complexity. While demand for advanced carbon materials and high-performance films grows, these fundamental operational and regulatory hurdles constrain producers and can impact price and availability for end-users.

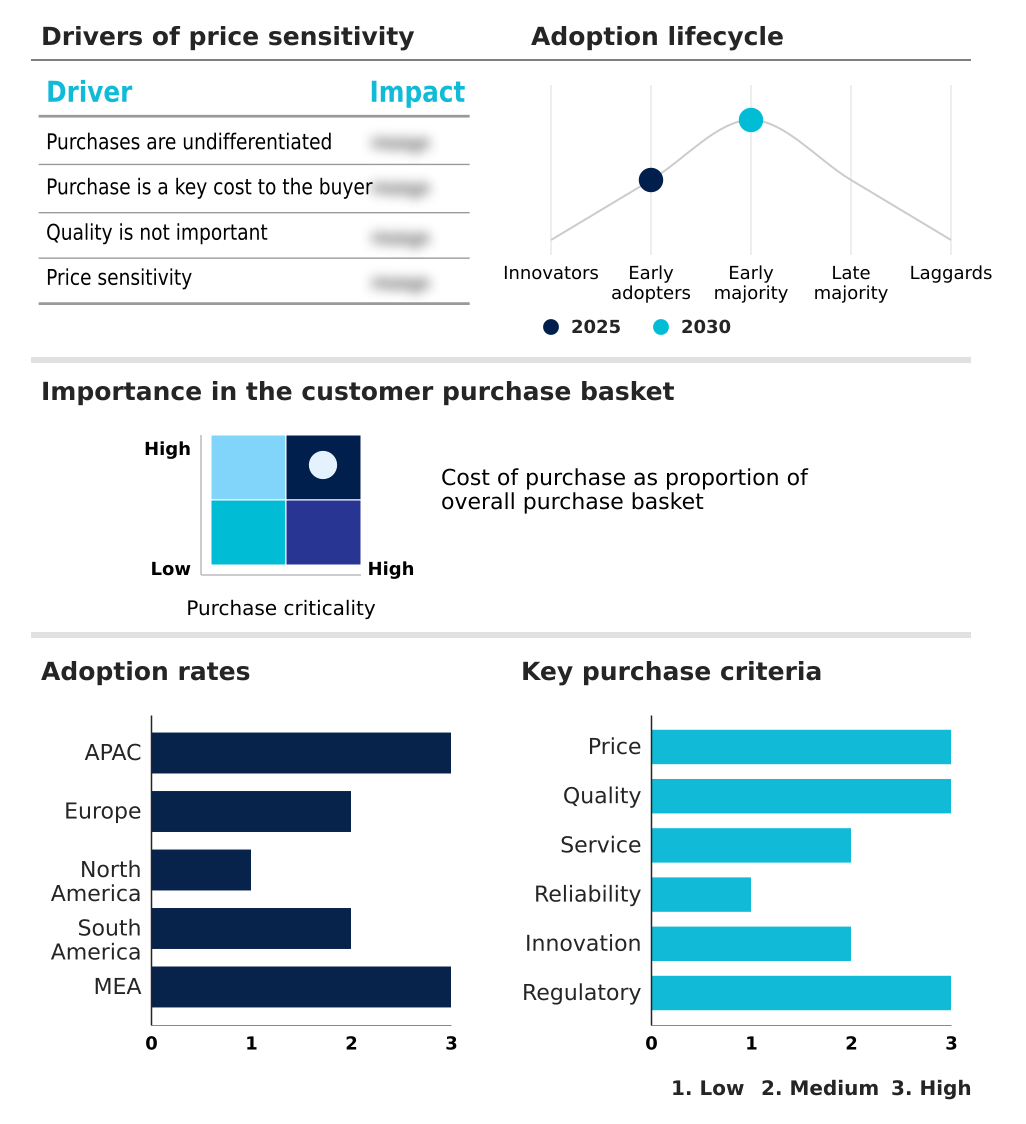
Exclusive Technavio Analysis on Customer Landscape

The coal tar market forecasting report includes the adoption lifecycle of the market, covering from the innovator’s stage to the laggard’s stage. It focuses on adoption rates in different regions based on penetration. Furthermore, the coal tar market report also includes key purchase criteria and drivers of price sensitivity to help companies evaluate and develop their market growth analysis strategies.

Customer Landscape of Coal Tar Industry

Competitive Landscape

Companies are implementing various strategies, such as strategic alliances, coal tar market forecast, partnerships, mergers and acquisitions, geographical expansion, and product/service launches, to enhance their presence in the industry.

Bilbaina de Alquitranes SA - Offerings include electrode pitch, naphthalene, and various oils derived from coal tar distillation, serving industrial and chemical sectors with essential carbon-based materials.

The industry research and growth report includes detailed analyses of the competitive landscape of the market and information about key companies, including:

  • Bilbaina de Alquitranes SA
  • China Steel Corp.
  • Coopers Creek Chemical Corp.
  • DEZA AS
  • Epsilon Carbon Pvt. Ltd.
  • Himadri Speciality Chemical
  • Industrial Quimica Nalon SA
  • JFE Chemical Corp.
  • Jining Carbon Group Co. Ltd.
  • Konark Tar Products Pvt. Ltd.
  • Koppers Holdings Inc.
  • Lone Star Specialties LLC
  • Nippon Steel Corp.
  • POSCO Co. Ltd.
  • Rain Carbon Inc.
  • Shree Shyam Chemicals
  • The Mitsubishi Chemical Group

Qualitative and quantitative analysis of companies has been conducted to help clients understand the wider business environment as well as the strengths and weaknesses of key industry players. Data is qualitatively analyzed to categorize companies as pure play, category-focused, industry-focused, and diversified; it is quantitatively analyzed to categorize companies as dominant, leading, strong, tentative, and weak.

Recent Development and News in Coal tar market

  • In March 2025, Koppers Holdings Inc. announced an expansion of its tar distillation facility to increase output for aluminum and infrastructure requirements in the US.
  • In January 2025, Rain Carbon Inc. initiated the development of a coal tar distillation and pitch-upgrading facility in the Andhra Pradesh Special Economic Zone, targeting the aluminum, graphite, and battery sectors.
  • In December 2024, Himadri Speciality Chemical Ltd. introduced an eco-friendly coal tar pitch variant optimized for anode production in electric vehicle batteries.
  • In December 2024, Koppers Inc. discontinued phthalic anhydride production at its Stickney, Illinois, facility to optimize its portfolio and focus on core coal tar distillation operations.

Dive into Technavio’s robust research methodology, blending expert interviews, extensive data synthesis, and validated models for unparalleled Coal Tar Market insights. See full methodology.

Market Scope
Page number 301
Base year 2025
Historic period 2020-2024
Forecast period 2026-2030
Growth momentum & CAGR Accelerate at a CAGR of 2.8%
Market growth 2026-2030 USD 2401.6 million
Market structure Fragmented
YoY growth 2025-2026(%) 2.7%
Key countries China, India, Japan, South Korea, Australia, Indonesia, Germany, UK, France, Italy, Spain, The Netherlands, US, Canada, Mexico, Brazil, Argentina, Chile, Saudi Arabia, South Africa, UAE, Turkey and Israel
Competitive landscape Leading Companies, Market Positioning of Companies, Competitive Strategies, and Industry Risks

Request Free Sample

Research Analyst Overview

  • The coal tar market is defined by a delicate balance between mature, high-volume applications and innovative, high-value diversification. The production of coal tar pitch remains the cornerstone, serving as a critical binder pitch for aluminum anodes and electrode pitch for graphite electrodes in metallurgical sectors.
  • The entire process begins with coal carbonization, yielding a coke oven by-product that is subjected to coal tar distillation. This process separates the material into valuable distillation fractions, including creosote oil for wood preservation, aromatic oils for carbon black, and naphthalene. A key boardroom focus is navigating the stringent regulations concerning polycyclic aromatic hydrocarbons (PAH).
  • In response, a significant trend is the development of refined coal tar with lower PAH content. One operational enhancement saw a facility reduce PAH levels by 30% through advanced processing. This shift extends to products like pavement sealants and waterproofing compounds.
  • Producers are also exploring medium temperature coal tar and low temperature coal tar for specialty chemicals, while high temperature coal tar remains essential for applications demanding high carbon yield. This push creates new opportunities for carbon materials like needle coke and mesophase pitch, ensuring the industry’s adaptability.

What are the Key Data Covered in this Coal Tar Market Research and Growth Report?

  • What is the expected growth of the Coal Tar Market between 2026 and 2030?

    • USD 2.40 billion, at a CAGR of 2.8%

  • What segmentation does the market report cover?

    • The report is segmented by Type (Low temperature coal tar, Medium temperature coal tar, and High temperature coal tar), Application (Coal tar pitch processing, Carbon black, and Others), End-user (Metallurgy, Automotive, Construction, and Others) and Geography (APAC, Europe, North America, South America, Middle East and Africa)

  • Which regions are analyzed in the report?

    • APAC, Europe, North America, South America and Middle East and Africa

  • What are the key growth drivers and market challenges?

    • Increasing demand from aluminum industry, Stringent environmental regulations and compliance burdens

  • Who are the major players in the Coal Tar Market?

    • Bilbaina de Alquitranes SA, China Steel Corp., Coopers Creek Chemical Corp., DEZA AS, Epsilon Carbon Pvt. Ltd., Himadri Speciality Chemical, Industrial Quimica Nalon SA, JFE Chemical Corp., Jining Carbon Group Co. Ltd., Konark Tar Products Pvt. Ltd., Koppers Holdings Inc., Lone Star Specialties LLC, Nippon Steel Corp., POSCO Co. Ltd., Rain Carbon Inc., Shree Shyam Chemicals and The Mitsubishi Chemical Group

Market Research Insights

  • The market is characterized by stable demand from its primary metallurgical use in aluminum and steel manufacturing, which accounts for over 70% of consumption. However, significant dynamism comes from diversification into high-value applications. Producers are increasingly refining feedstocks into advanced carbon materials for energy storage, where performance improvements of 25% are being reported.
  • The creation of carbon pitch derivatives and chemical intermediates is also growing, with a focus on enhancing product purity. For instance, optimized distillation now yields superior carbon black feedstock, improving tire durability by up to 15%. This shift toward specialized products like carbon additives for composites is reshaping the industry’s value chain, balancing traditional volume with high-margin innovation.

We can help! Our analysts can customize this coal tar market research report to meet your requirements.

Get in touch

1. Executive Summary

1.1 Market overview

Executive Summary - Chart on Market Overview
Executive Summary - Data Table on Market Overview
Executive Summary - Chart on Global Market Characteristics
Executive Summary - Chart on Market by Geography
Executive Summary - Chart on Market Segmentation by Type
Executive Summary - Chart on Market Segmentation by Application
Executive Summary - Chart on Market Segmentation by End-user
Executive Summary - Chart on Incremental Growth
Executive Summary - Data Table on Incremental Growth
Executive Summary - Chart on Company Market Positioning

2. Technavio Analysis

2.1 Analysis of price sensitivity, lifecycle, customer purchase basket, adoption rates, and purchase criteria

2.2 Criticality of inputs and Factors of differentiation

Chart on Overview on criticality of inputs and factors of differentiation

2.3 Factors of disruption

Chart on Overview on factors of disruption

2.4 Impact of drivers and challenges

Chart on Impact of drivers and challenges in 2025 and 2030

3. Market Landscape

3.1 Market ecosystem

Chart on Parent Market
Data Table on - Parent Market

3.2 Market characteristics

Chart on Market characteristics analysis

3.3 Value chain analysis

Chart on Value chain analysis

4. Market Sizing

4.1 Market definition

Data Table on Offerings of companies included in the market definition

4.2 Market segment analysis

Market segments

4.3 Market size 2025

4.4 Market outlook: Forecast for 2025-2030

Chart on Global - Market size and forecast 2025-2030 ($ million)
Data Table on Global - Market size and forecast 2025-2030 ($ million)
Chart on Global Market: Year-over-year growth 2025-2030 (%)
Data Table on Global Market: Year-over-year growth 2025-2030 (%)

5. Historic Market Size

5.1 Global Coal Tar Market 2020 - 2024

Historic Market Size - Data Table on Global Coal Tar Market 2020 - 2024 ($ million)

5.2 Type segment analysis 2020 - 2024

Historic Market Size - Type Segment 2020 - 2024 ($ million)

5.3 Application segment analysis 2020 - 2024

Historic Market Size - Application Segment 2020 - 2024 ($ million)

5.4 End-user segment analysis 2020 - 2024

Historic Market Size - End-user Segment 2020 - 2024 ($ million)

5.5 Geography segment analysis 2020 - 2024

Historic Market Size - Geography Segment 2020 - 2024 ($ million)

5.6 Country segment analysis 2020 - 2024

Historic Market Size - Country Segment 2020 - 2024 ($ million)

6. Qualitative Analysis

6.1 Impact of AI on Global Coal Tar Market

7. Five Forces Analysis

7.1 Five forces summary

Five forces analysis - Comparison between 2025 and 2030

7.2 Bargaining power of buyers

Bargaining power of buyers - Impact of key factors 2025 and 2030

7.3 Bargaining power of suppliers

Bargaining power of suppliers - Impact of key factors in 2025 and 2030

7.4 Threat of new entrants

Threat of new entrants - Impact of key factors in 2025 and 2030

7.5 Threat of substitutes

Threat of substitutes - Impact of key factors in 2025 and 2030

7.6 Threat of rivalry

Threat of rivalry - Impact of key factors in 2025 and 2030

7.7 Market condition

Chart on Market condition - Five forces 2025 and 2030

8. Market Segmentation by Type

8.1 Market segments

Chart on Type - Market share 2025-2030 (%)
Data Table on Type - Market share 2025-2030 (%)

8.2 Comparison by Type

Chart on Comparison by Type
Data Table on Comparison by Type

8.3 Low temperature coal tar - Market size and forecast 2025-2030

Chart on Low temperature coal tar - Market size and forecast 2025-2030 ($ million)
Data Table on Low temperature coal tar - Market size and forecast 2025-2030 ($ million)
Chart on Low temperature coal tar - Year-over-year growth 2025-2030 (%)
Data Table on Low temperature coal tar - Year-over-year growth 2025-2030 (%)

8.4 Medium temperature coal tar - Market size and forecast 2025-2030

Chart on Medium temperature coal tar - Market size and forecast 2025-2030 ($ million)
Data Table on Medium temperature coal tar - Market size and forecast 2025-2030 ($ million)
Chart on Medium temperature coal tar - Year-over-year growth 2025-2030 (%)
Data Table on Medium temperature coal tar - Year-over-year growth 2025-2030 (%)

8.5 High temperature coal tar - Market size and forecast 2025-2030

Chart on High temperature coal tar - Market size and forecast 2025-2030 ($ million)
Data Table on High temperature coal tar - Market size and forecast 2025-2030 ($ million)
Chart on High temperature coal tar - Year-over-year growth 2025-2030 (%)
Data Table on High temperature coal tar - Year-over-year growth 2025-2030 (%)

8.6 Market opportunity by Type

Market opportunity by Type ($ million)
Data Table on Market opportunity by Type ($ million)

9. Market Segmentation by Application

9.1 Market segments

Chart on Application - Market share 2025-2030 (%)
Data Table on Application - Market share 2025-2030 (%)

9.2 Comparison by Application

Chart on Comparison by Application
Data Table on Comparison by Application

9.3 Coal tar pitch processing - Market size and forecast 2025-2030

Chart on Coal tar pitch processing - Market size and forecast 2025-2030 ($ million)
Data Table on Coal tar pitch processing - Market size and forecast 2025-2030 ($ million)
Chart on Coal tar pitch processing - Year-over-year growth 2025-2030 (%)
Data Table on Coal tar pitch processing - Year-over-year growth 2025-2030 (%)

9.4 Carbon black - Market size and forecast 2025-2030

Chart on Carbon black - Market size and forecast 2025-2030 ($ million)
Data Table on Carbon black - Market size and forecast 2025-2030 ($ million)
Chart on Carbon black - Year-over-year growth 2025-2030 (%)
Data Table on Carbon black - Year-over-year growth 2025-2030 (%)

9.5 Others - Market size and forecast 2025-2030

Chart on Others - Market size and forecast 2025-2030 ($ million)
Data Table on Others - Market size and forecast 2025-2030 ($ million)
Chart on Others - Year-over-year growth 2025-2030 (%)
Data Table on Others - Year-over-year growth 2025-2030 (%)

9.6 Market opportunity by Application

Market opportunity by Application ($ million)
Data Table on Market opportunity by Application ($ million)

10. Market Segmentation by End-user

10.1 Market segments

Chart on End-user - Market share 2025-2030 (%)
Data Table on End-user - Market share 2025-2030 (%)

10.2 Comparison by End-user

Chart on Comparison by End-user
Data Table on Comparison by End-user

10.3 Metallurgy - Market size and forecast 2025-2030

Chart on Metallurgy - Market size and forecast 2025-2030 ($ million)
Data Table on Metallurgy - Market size and forecast 2025-2030 ($ million)
Chart on Metallurgy - Year-over-year growth 2025-2030 (%)
Data Table on Metallurgy - Year-over-year growth 2025-2030 (%)

10.4 Automotive - Market size and forecast 2025-2030

Chart on Automotive - Market size and forecast 2025-2030 ($ million)
Data Table on Automotive - Market size and forecast 2025-2030 ($ million)
Chart on Automotive - Year-over-year growth 2025-2030 (%)
Data Table on Automotive - Year-over-year growth 2025-2030 (%)

10.5 Construction - Market size and forecast 2025-2030

Chart on Construction - Market size and forecast 2025-2030 ($ million)
Data Table on Construction - Market size and forecast 2025-2030 ($ million)
Chart on Construction - Year-over-year growth 2025-2030 (%)
Data Table on Construction - Year-over-year growth 2025-2030 (%)

10.6 Others - Market size and forecast 2025-2030

Chart on Others - Market size and forecast 2025-2030 ($ million)
Data Table on Others - Market size and forecast 2025-2030 ($ million)
Chart on Others - Year-over-year growth 2025-2030 (%)
Data Table on Others - Year-over-year growth 2025-2030 (%)

10.7 Market opportunity by End-user

Market opportunity by End-user ($ million)
Data Table on Market opportunity by End-user ($ million)

11. Customer Landscape

11.1 Customer landscape overview

Analysis of price sensitivity, lifecycle, customer purchase basket, adoption rates, and purchase criteria

12. Geographic Landscape

12.1 Geographic segmentation

Chart on Market share by geography 2025-2030 (%)
Data Table on Market share by geography 2025-2030 (%)

12.2 Geographic comparison

Chart on Geographic comparison
Data Table on Geographic comparison

12.3 APAC - Market size and forecast 2025-2030

Chart on APAC - Market size and forecast 2025-2030 ($ million)
Data Table on APAC - Market size and forecast 2025-2030 ($ million)
Chart on APAC - Year-over-year growth 2025-2030 (%)
Data Table on APAC - Year-over-year growth 2025-2030 (%)
Chart on Regional Comparison - APAC
Data Table on Regional Comparison - APAC

12.3.1 China - Market size and forecast 2025-2030

Chart on China - Market size and forecast 2025-2030 ($ million)
Data Table on China - Market size and forecast 2025-2030 ($ million)
Chart on China - Year-over-year growth 2025-2030 (%)
Data Table on China - Year-over-year growth 2025-2030 (%)

12.3.2 India - Market size and forecast 2025-2030

Chart on India - Market size and forecast 2025-2030 ($ million)
Data Table on India - Market size and forecast 2025-2030 ($ million)
Chart on India - Year-over-year growth 2025-2030 (%)
Data Table on India - Year-over-year growth 2025-2030 (%)

12.3.3 Japan - Market size and forecast 2025-2030

Chart on Japan - Market size and forecast 2025-2030 ($ million)
Data Table on Japan - Market size and forecast 2025-2030 ($ million)
Chart on Japan - Year-over-year growth 2025-2030 (%)
Data Table on Japan - Year-over-year growth 2025-2030 (%)

12.3.4 South Korea - Market size and forecast 2025-2030

Chart on South Korea - Market size and forecast 2025-2030 ($ million)
Data Table on South Korea - Market size and forecast 2025-2030 ($ million)
Chart on South Korea - Year-over-year growth 2025-2030 (%)
Data Table on South Korea - Year-over-year growth 2025-2030 (%)

12.3.5 Australia - Market size and forecast 2025-2030

Chart on Australia - Market size and forecast 2025-2030 ($ million)
Data Table on Australia - Market size and forecast 2025-2030 ($ million)
Chart on Australia - Year-over-year growth 2025-2030 (%)
Data Table on Australia - Year-over-year growth 2025-2030 (%)

12.3.6 Indonesia - Market size and forecast 2025-2030

Chart on Indonesia - Market size and forecast 2025-2030 ($ million)
Data Table on Indonesia - Market size and forecast 2025-2030 ($ million)
Chart on Indonesia - Year-over-year growth 2025-2030 (%)
Data Table on Indonesia - Year-over-year growth 2025-2030 (%)

12.4 Europe - Market size and forecast 2025-2030

Chart on Europe - Market size and forecast 2025-2030 ($ million)
Data Table on Europe - Market size and forecast 2025-2030 ($ million)
Chart on Europe - Year-over-year growth 2025-2030 (%)
Data Table on Europe - Year-over-year growth 2025-2030 (%)
Chart on Regional Comparison - Europe
Data Table on Regional Comparison - Europe

12.4.1 Germany - Market size and forecast 2025-2030

Chart on Germany - Market size and forecast 2025-2030 ($ million)
Data Table on Germany - Market size and forecast 2025-2030 ($ million)
Chart on Germany - Year-over-year growth 2025-2030 (%)
Data Table on Germany - Year-over-year growth 2025-2030 (%)

12.4.2 UK - Market size and forecast 2025-2030

Chart on UK - Market size and forecast 2025-2030 ($ million)
Data Table on UK - Market size and forecast 2025-2030 ($ million)
Chart on UK - Year-over-year growth 2025-2030 (%)
Data Table on UK - Year-over-year growth 2025-2030 (%)

12.4.3 France - Market size and forecast 2025-2030

Chart on France - Market size and forecast 2025-2030 ($ million)
Data Table on France - Market size and forecast 2025-2030 ($ million)
Chart on France - Year-over-year growth 2025-2030 (%)
Data Table on France - Year-over-year growth 2025-2030 (%)

12.4.4 Italy - Market size and forecast 2025-2030

Chart on Italy - Market size and forecast 2025-2030 ($ million)
Data Table on Italy - Market size and forecast 2025-2030 ($ million)
Chart on Italy - Year-over-year growth 2025-2030 (%)
Data Table on Italy - Year-over-year growth 2025-2030 (%)

12.4.5 Spain - Market size and forecast 2025-2030

Chart on Spain - Market size and forecast 2025-2030 ($ million)
Data Table on Spain - Market size and forecast 2025-2030 ($ million)
Chart on Spain - Year-over-year growth 2025-2030 (%)
Data Table on Spain - Year-over-year growth 2025-2030 (%)

12.4.6 The Netherlands - Market size and forecast 2025-2030

Chart on The Netherlands - Market size and forecast 2025-2030 ($ million)
Data Table on The Netherlands - Market size and forecast 2025-2030 ($ million)
Chart on The Netherlands - Year-over-year growth 2025-2030 (%)
Data Table on The Netherlands - Year-over-year growth 2025-2030 (%)

12.5 North America - Market size and forecast 2025-2030

Chart on North America - Market size and forecast 2025-2030 ($ million)
Data Table on North America - Market size and forecast 2025-2030 ($ million)
Chart on North America - Year-over-year growth 2025-2030 (%)
Data Table on North America - Year-over-year growth 2025-2030 (%)
Chart on Regional Comparison - North America
Data Table on Regional Comparison - North America

12.5.1 US - Market size and forecast 2025-2030

Chart on US - Market size and forecast 2025-2030 ($ million)
Data Table on US - Market size and forecast 2025-2030 ($ million)
Chart on US - Year-over-year growth 2025-2030 (%)
Data Table on US - Year-over-year growth 2025-2030 (%)

12.5.2 Canada - Market size and forecast 2025-2030

Chart on Canada - Market size and forecast 2025-2030 ($ million)
Data Table on Canada - Market size and forecast 2025-2030 ($ million)
Chart on Canada - Year-over-year growth 2025-2030 (%)
Data Table on Canada - Year-over-year growth 2025-2030 (%)

12.5.3 Mexico - Market size and forecast 2025-2030

Chart on Mexico - Market size and forecast 2025-2030 ($ million)
Data Table on Mexico - Market size and forecast 2025-2030 ($ million)
Chart on Mexico - Year-over-year growth 2025-2030 (%)
Data Table on Mexico - Year-over-year growth 2025-2030 (%)

12.6 South America - Market size and forecast 2025-2030

Chart on South America - Market size and forecast 2025-2030 ($ million)
Data Table on South America - Market size and forecast 2025-2030 ($ million)
Chart on South America - Year-over-year growth 2025-2030 (%)
Data Table on South America - Year-over-year growth 2025-2030 (%)
Chart on Regional Comparison - South America
Data Table on Regional Comparison - South America

12.6.1 Brazil - Market size and forecast 2025-2030

Chart on Brazil - Market size and forecast 2025-2030 ($ million)
Data Table on Brazil - Market size and forecast 2025-2030 ($ million)
Chart on Brazil - Year-over-year growth 2025-2030 (%)
Data Table on Brazil - Year-over-year growth 2025-2030 (%)

12.6.2 Argentina - Market size and forecast 2025-2030

Chart on Argentina - Market size and forecast 2025-2030 ($ million)
Data Table on Argentina - Market size and forecast 2025-2030 ($ million)
Chart on Argentina - Year-over-year growth 2025-2030 (%)
Data Table on Argentina - Year-over-year growth 2025-2030 (%)

12.6.3 Chile - Market size and forecast 2025-2030

Chart on Chile - Market size and forecast 2025-2030 ($ million)
Data Table on Chile - Market size and forecast 2025-2030 ($ million)
Chart on Chile - Year-over-year growth 2025-2030 (%)
Data Table on Chile - Year-over-year growth 2025-2030 (%)

12.7 Middle East and Africa - Market size and forecast 2025-2030

Chart on Middle East and Africa - Market size and forecast 2025-2030 ($ million)
Data Table on Middle East and Africa - Market size and forecast 2025-2030 ($ million)
Chart on Middle East and Africa - Year-over-year growth 2025-2030 (%)
Data Table on Middle East and Africa - Year-over-year growth 2025-2030 (%)
Chart on Regional Comparison - Middle East and Africa
Data Table on Regional Comparison - Middle East and Africa

12.7.1 Saudi Arabia - Market size and forecast 2025-2030

Chart on Saudi Arabia - Market size and forecast 2025-2030 ($ million)
Data Table on Saudi Arabia - Market size and forecast 2025-2030 ($ million)
Chart on Saudi Arabia - Year-over-year growth 2025-2030 (%)
Data Table on Saudi Arabia - Year-over-year growth 2025-2030 (%)

12.7.2 South Africa - Market size and forecast 2025-2030

Chart on South Africa - Market size and forecast 2025-2030 ($ million)
Data Table on South Africa - Market size and forecast 2025-2030 ($ million)
Chart on South Africa - Year-over-year growth 2025-2030 (%)
Data Table on South Africa - Year-over-year growth 2025-2030 (%)

12.7.3 UAE - Market size and forecast 2025-2030

Chart on UAE - Market size and forecast 2025-2030 ($ million)
Data Table on UAE - Market size and forecast 2025-2030 ($ million)
Chart on UAE - Year-over-year growth 2025-2030 (%)
Data Table on UAE - Year-over-year growth 2025-2030 (%)

12.7.4 Turkey - Market size and forecast 2025-2030

Chart on Turkey - Market size and forecast 2025-2030 ($ million)
Data Table on Turkey - Market size and forecast 2025-2030 ($ million)
Chart on Turkey - Year-over-year growth 2025-2030 (%)
Data Table on Turkey - Year-over-year growth 2025-2030 (%)

12.7.5 Israel - Market size and forecast 2025-2030

Chart on Israel - Market size and forecast 2025-2030 ($ million)
Data Table on Israel - Market size and forecast 2025-2030 ($ million)
Chart on Israel - Year-over-year growth 2025-2030 (%)
Data Table on Israel - Year-over-year growth 2025-2030 (%)

12.8 Market opportunity by geography

Market opportunity by geography ($ million)
Data Tables on Market opportunity by geography ($ million)

13. Drivers, Challenges, and Opportunity

13.1 Market drivers

Increasing demand from aluminum industry
Emerging applications in energy storage
Growing requirements from infrastructure and construction sector

13.2 Market challenges

Stringent environmental regulations and compliance burdens
Feedstock supply volatility and declining coke oven operations
Health and safety concerns in handling and processing

13.3 Impact of drivers and challenges

Impact of drivers and challenges in 2025 and 2030

13.4 Market opportunities

Increasing adoption of low PAH and environmentally compliant formulations
Capacity expansions and strategic facility developments in key regions
Diversification into advanced and high value applications

14. Competitive Landscape

14.1 Overview

14.2

Overview on criticality of inputs and factors of differentiation

14.3 Landscape disruption

Overview on factors of disruption

14.4 Industry risks

Impact of key risks on business

15. Competitive Analysis

15.1 Companies profiled

Companies covered

15.2 Company ranking index

15.3 Market positioning of companies

Matrix on companies position and classification

15.4 China Steel Corp.

China Steel Corp. - Overview
China Steel Corp. - Business segments
China Steel Corp. - Key offerings
China Steel Corp. - Segment focus
SWOT

15.5 Coopers Creek Chemical Corp.

Coopers Creek Chemical Corp. - Overview
Coopers Creek Chemical Corp. - Product / Service
Coopers Creek Chemical Corp. - Key offerings
SWOT

15.6 DEZA AS

DEZA AS - Overview
DEZA AS - Product / Service
DEZA AS - Key offerings
SWOT

15.7 Epsilon Carbon Pvt. Ltd.

Epsilon Carbon Pvt. Ltd. - Overview
Epsilon Carbon Pvt. Ltd. - Product / Service
Epsilon Carbon Pvt. Ltd. - Key offerings
SWOT

15.8 Himadri Speciality Chemical

Himadri Speciality Chemical - Overview
Himadri Speciality Chemical - Business segments
Himadri Speciality Chemical - Key offerings
Himadri Speciality Chemical - Segment focus
SWOT

15.9 Industrial Quimica Nalon SA

Industrial Quimica Nalon SA - Overview
Industrial Quimica Nalon SA - Product / Service
Industrial Quimica Nalon SA - Key offerings
SWOT

15.10 Jining Carbon Group Co. Ltd.

Jining Carbon Group Co. Ltd. - Overview
Jining Carbon Group Co. Ltd. - Product / Service
Jining Carbon Group Co. Ltd. - Key offerings
SWOT

15.11 Konark Tar Products Pvt. Ltd.

Konark Tar Products Pvt. Ltd. - Overview
Konark Tar Products Pvt. Ltd. - Product / Service
Konark Tar Products Pvt. Ltd. - Key offerings
SWOT

15.12 Koppers Holdings Inc.

Koppers Holdings Inc. - Overview
Koppers Holdings Inc. - Business segments
Koppers Holdings Inc. - Key offerings
Koppers Holdings Inc. - Segment focus
SWOT

15.13 Lone Star Specialties LLC

Lone Star Specialties LLC - Overview
Lone Star Specialties LLC - Product / Service
Lone Star Specialties LLC - Key offerings
SWOT

15.14 Nippon Steel Corp.

Nippon Steel Corp. - Overview
Nippon Steel Corp. - Business segments
Nippon Steel Corp. - Key news
Nippon Steel Corp. - Key offerings
Nippon Steel Corp. - Segment focus
SWOT

15.15 POSCO Co. Ltd.

POSCO Co. Ltd. - Overview
POSCO Co. Ltd. - Business segments
POSCO Co. Ltd. - Key offerings
POSCO Co. Ltd. - Segment focus
SWOT

15.16 Rain Carbon Inc.

Rain Carbon Inc. - Overview
Rain Carbon Inc. - Product / Service
Rain Carbon Inc. - Key offerings
SWOT

15.17 Shree Shyam Chemicals

Shree Shyam Chemicals - Overview
Shree Shyam Chemicals - Product / Service
Shree Shyam Chemicals - Key offerings
SWOT

15.18 The Mitsubishi Chemical Group

The Mitsubishi Chemical Group - Overview
The Mitsubishi Chemical Group - Business segments
The Mitsubishi Chemical Group - Key news
The Mitsubishi Chemical Group - Key offerings
The Mitsubishi Chemical Group - Segment focus
SWOT

16. Appendix

16.1 Scope of the report

Market definition
Objectives
Notes and caveats

16.2 Inclusions and exclusions checklist

Inclusions checklist
Exclusions checklist

16.3 Currency conversion rates for US$

16.4 Research methodology

16.5 Data procurement

Information sources

16.6 Data validation

16.7 Validation techniques employed for market sizing

16.8 Data synthesis

16.9 360 degree market analysis

16.10 List of abbreviations

Research Methodology

Technavio presents a detailed picture of the market by way of study, synthesis, and summation of data from multiple sources. The analysts have presented the various facets of the market with a particular focus on identifying the key industry influencers. The data thus presented is comprehensive, reliable, and the result of extensive research, both primary and secondary.

INFORMATION SOURCES

Primary sources

  • Manufacturers and suppliers
  • Channel partners
  • Industry experts
  • Strategic decision makers

Secondary sources

  • Industry journals and periodicals
  • Government data
  • Financial reports of key industry players
  • Historical data
  • Press releases

DATA ANALYSIS

Data Synthesis

  • Collation of data
  • Estimation of key figures
  • Analysis of derived insights

Data Validation

  • Triangulation with data models
  • Reference against proprietary databases
  • Corroboration with industry experts

REPORT WRITING

Qualitative

  • Market drivers
  • Market challenges
  • Market trends
  • Five forces analysis

Quantitative

  • Market size and forecast
  • Market segmentation
  • Geographical insights
  • Competitive landscape

Interested in this report?

Get your sample now to see our research methodology and insights!

Download Now

Frequently Asked Questions

Coal Tar market growth will increase by USD 2401.6 million during 2026-2030.

The Coal Tar market is expected to grow at a CAGR of 2.8% during 2026-2030.

Coal Tar market is segmented by Type (Low temperature coal tar, Medium temperature coal tar, High temperature coal tar) Application (Coal tar pitch processing, Carbon black, Others) End-user (Metallurgy, Automotive, Construction, Others)

Bilbaina de Alquitranes SA, China Steel Corp., Coopers Creek Chemical Corp., DEZA AS, Epsilon Carbon Pvt. Ltd., Himadri Speciality Chemical, Industrial Quimica Nalon SA, JFE Chemical Corp., Jining Carbon Group Co. Ltd., Konark Tar Products Pvt. Ltd., Koppers Holdings Inc., Lone Star Specialties LLC, Nippon Steel Corp., POSCO Co. Ltd., Rain Carbon Inc., Shree Shyam Chemicals, The Mitsubishi Chemical Group are a few of the key vendors in the Coal Tar market.

APAC will register the highest growth rate of 81.8% among the other regions. Therefore, the Coal Tar market in APAC is expected to garner significant business opportunities for the vendors during the forecast period.

China, India, Japan, South Korea, Australia, Indonesia, Germany, UK, France, Italy, Spain, The Netherlands, US, Canada, Mexico, Brazil, Argentina, Chile, Saudi Arabia, South Africa, UAE, Turkey, Israel

  • Increasing demand from aluminum industry is the driving factor this market.

The Coal Tar market vendors should focus on grabbing business opportunities from the Type segment as it accounted for the largest market share in the base year.
RIA - Research AI Assistant
Ask RIA