
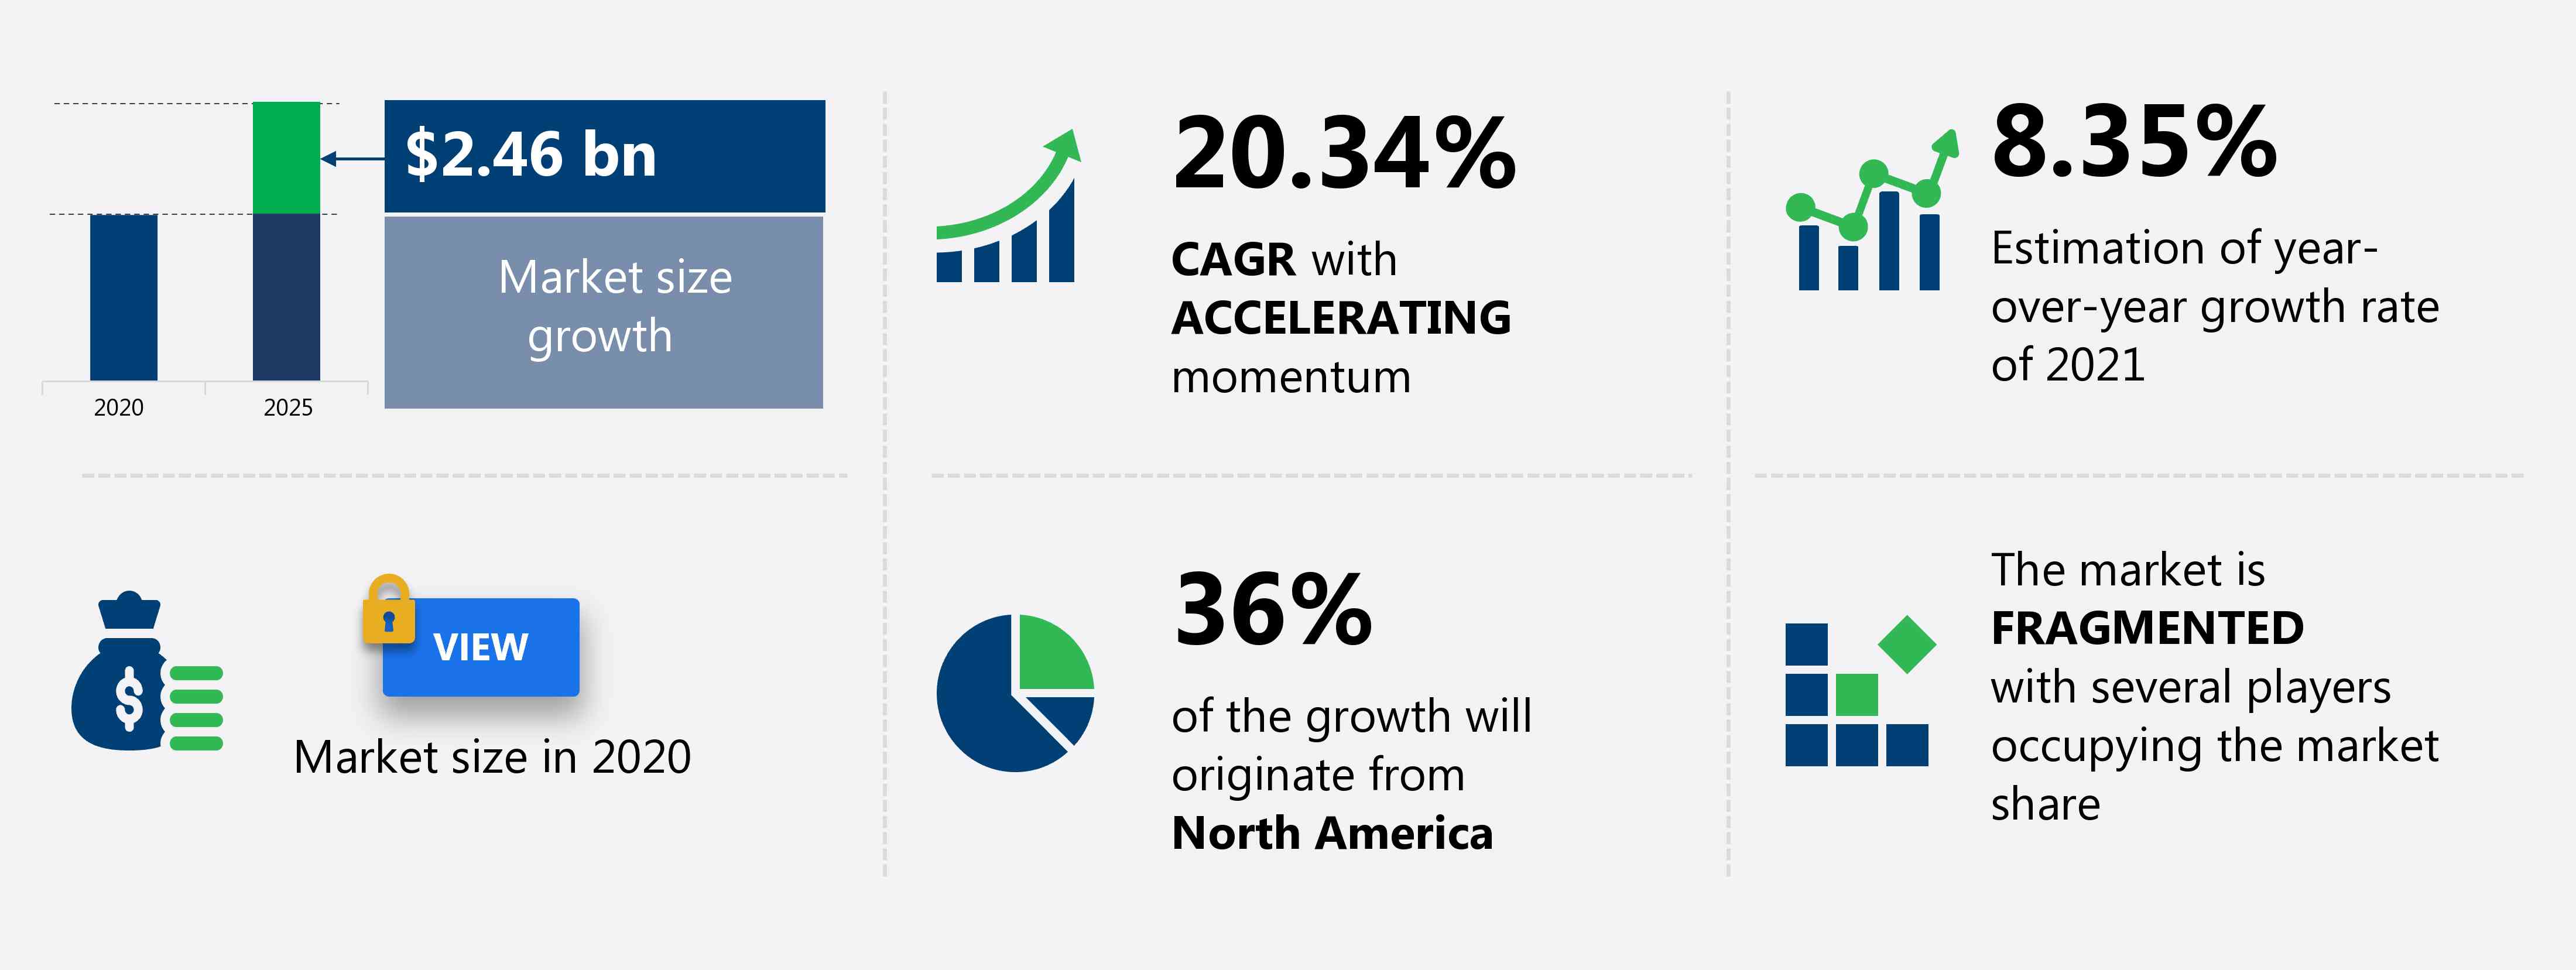
The commercial aerospace 3d printing market share is expected to increase by USD 2.46 billion from 2020 to 2025, and the market’s growth momentum will accelerate at a CAGR of 20.34%.
This commercial aerospace 3d printing market research report provides valuable insights on the post COVID-19 impact on the market, which will help companies evaluate their business approaches. Furthermore, this report extensively covers commercial aerospace 3d printing market segmentations by 3D printing vertical (printing technologies and materials) and geography (North America, Europe, APAC, South America, and MEA). The commercial aerospace 3d printing market report also offers information on several market vendors, including 3D Systems Corp., Arconic Inc., EOS GmbH, General Electric Co., Hoganas AB, Materialise NV, Melrose Industries Plc, Sandvik AB, Stratasys Ltd., and The ExOne Company among others.
What will the Commercial Aerospace 3D Printing Market Size be During the Forecast Period?
Download the Free Report Sample to Unlock the Commercial Aerospace 3D Printing Market Size for the Forecast Period and Other Important Statistics
Commercial Aerospace 3D Printing Market: Key Drivers, Trends, and Challenges
Based on our research output, there has been a negative impact on the market growth during and post COVID-19 era. The improved part performance with weight reduction is notably driving the commercial aerospace 3d printing market growth, although factors such as restriction for build-up envelope and product size may impede market growth. Our research analysts have studied the historical data and deduced the key market drivers and the COVID-19 pandemic impact on the commercial aerospace 3d printing industry. The holistic analysis of the drivers will help in deducing end goals and refining marketing strategies to gain a competitive edge.
Key Commercial Aerospace 3D Printing Market Driver
The improved part performance with weight reduction is a major factor driving the global commercial aerospace 3D printing market share growth. 3D printing technology has provided designers with the freedom to explore complex part designs that can deliver maximum performance. It also facilitates the integration of parts. As conventional methods are required to check for the feasibility in product manufacturing, designers must consider the manufacturing constraints involved. With 3D printing, it is feasible to produce lightweight structures for prototyping the final product. The technology enables the creation of intricate geometries that can drastically reduce the weight of a component while maintaining its structural strength. The reduction in weight helps designers achieve lower material costs along with fuel savings. In the aerospace industry, reducing the overall weight of components is crucial for lowering fuel consumption and carbon dioxide emissions. On that note, Airbus is trying to attain certification for its lighter cabin partition. Experts from Airbus Group's subsidiary, APWorks, and Autodesk developed and reinvented different design variants and finalized a version that mimics the bone and cell structure. Such factors and innovations will drive the growth of the market.
Key Commercial Aerospace 3D Printing Market Trend
Combining 3D printing with traditional manufacturing is another factor supporting the global commercial aerospace 3D printing market share growth. The trend of 3D printing is in its initial phase of development, but it has a wide impact on several manufacturing industries. Researchers have paired traditional manufacturing with 3D printing and are anticipating greater profitability with this combination. For instance, Siemens offers the new NX Hybrid additive manufacturing software that uses conventional manufacturing and additive manufacturing for production. It is a hybrid process that combines conventional processes such as boring, milling, and grinding with additive manufacturing like 3D printing. The company used the laser deposition process for building burner heads of gas turbines with metal powder. The burner was developed in innovative shapes such as honeycomb. It allowed the conversion of a solid structure to a hollow shape, with relative weight savings. Further, conventional manufacturing such as grinding, polishing, and buffing was used to build high-precision parts. Recent technological improvements in 3D printers that can work with metal and aluminum will likely increase their acceptance in this industry.
Key Commercial Aerospace 3D Printing Market Challenge
The restrictions for build-up envelope and product size will be a major challenge for the global commercial aerospace 3D printing market share growth during the forecast period. An aircraft consists of very large components, and the acceptance of 3D printing will depend on how these products can be produced using the technology. Most technologies offer systems with a limited building scope, which makes 3D printing applicable for only small components. This is applicable to almost all 3D printing processes, but the major issue in aircraft is with powder bed fusion process a widely applied technology for metal printing. The biggest building scope for standard metal printing with the powder fusion bed process measures 0.8X0.4X0.5 m. There is a possibility to customize machines for customers, but this incurs high costs. The aerospace industry is focusing on upgrading the current technology for printing large products. For instance, Oak Ridge National laboratory and Boeing holds a world record for manufacturing the largest solid 3D printed object, called the trim and drill tool, which is used to create the wings of Boeing's Next-Generation 777X jet. The inability of 3D printers to produce large components hinders its wide-scale adoption in the aerospace industry.
This commercial aerospace 3d printing market analysis report also provides detailed information on other upcoming trends and challenges that will have a far-reaching effect on the market growth. The actionable insights on the trends and challenges will help companies evaluate and develop growth strategies for 2021-2025.
Parent Market Analysis
Technavio categorizes the global commercial aerospace 3D printing market as a part of the global aerospace and defense market. Our research report has extensively covered external factors influencing the parent market growth potential in the coming years, which will determine the levels of growth of the commercial aerospace 3d printing market during the forecast period.
Who are the Major Commercial Aerospace 3D Printing Market Vendors?
The report analyzes the market’s competitive landscape and offers information on several market vendors, including:
- 3D Systems Corp.
- Arconic Inc.
- EOS GmbH
- General Electric Co.
- Hoganas AB
- Materialise NV
- Melrose Industries Plc
- Sandvik AB
- Stratasys Ltd.
- The ExOne Company
This statistical study of the commercial aerospace 3d printing market encompasses successful business strategies deployed by the key vendors. The commercial aerospace 3d printing market is fragmented and the vendors are deploying growth strategies such as investing in R&D to compete in the market.
Product Insights and News
- 3D Systems Corp.- The company provides 3D printing machines such as the SLA printer, SLS printer, and multi-jet printer for different applications like healthcare, automotive, aerospace, government, defense, technology, electronics, education, consumer goods, and energy.
To make the most of the opportunities and recover from post COVID-19 impact, market vendors should focus more on the growth prospects in the fast-growing segments, while maintaining their positions in the slow-growing segments.
The commercial aerospace 3d printing market forecast report offers in-depth insights into key vendor profiles. The profiles include information on the production, sustainability, and prospects of the leading companies.
Commercial Aerospace 3D Printing Market Value Chain Analysis
Our report provides extensive information on the value chain analysis for the commercial aerospace 3d printing market, which vendors can leverage to gain a competitive advantage during the forecast period. The end-to-end understanding of the value chain is essential in profit margin optimization and evaluation of business strategies. The data available in our value chain analysis segment can help vendors drive costs and enhance customer services during the forecast period.
The value chain of global aerospace and defense market includes the following core components:
- Inputs
- Inbound logistics
- Operations
- Outbound logistics
- Marketing and sales
- Service
- Support activities
- Innovation
The report has further elucidated on other innovative approaches being followed by manufacturers to ensure a sustainable market presence.
Which are the Key Regions for Commercial Aerospace 3D Printing Market?
For more insights on the market share of various regions Request for a FREE sample now!
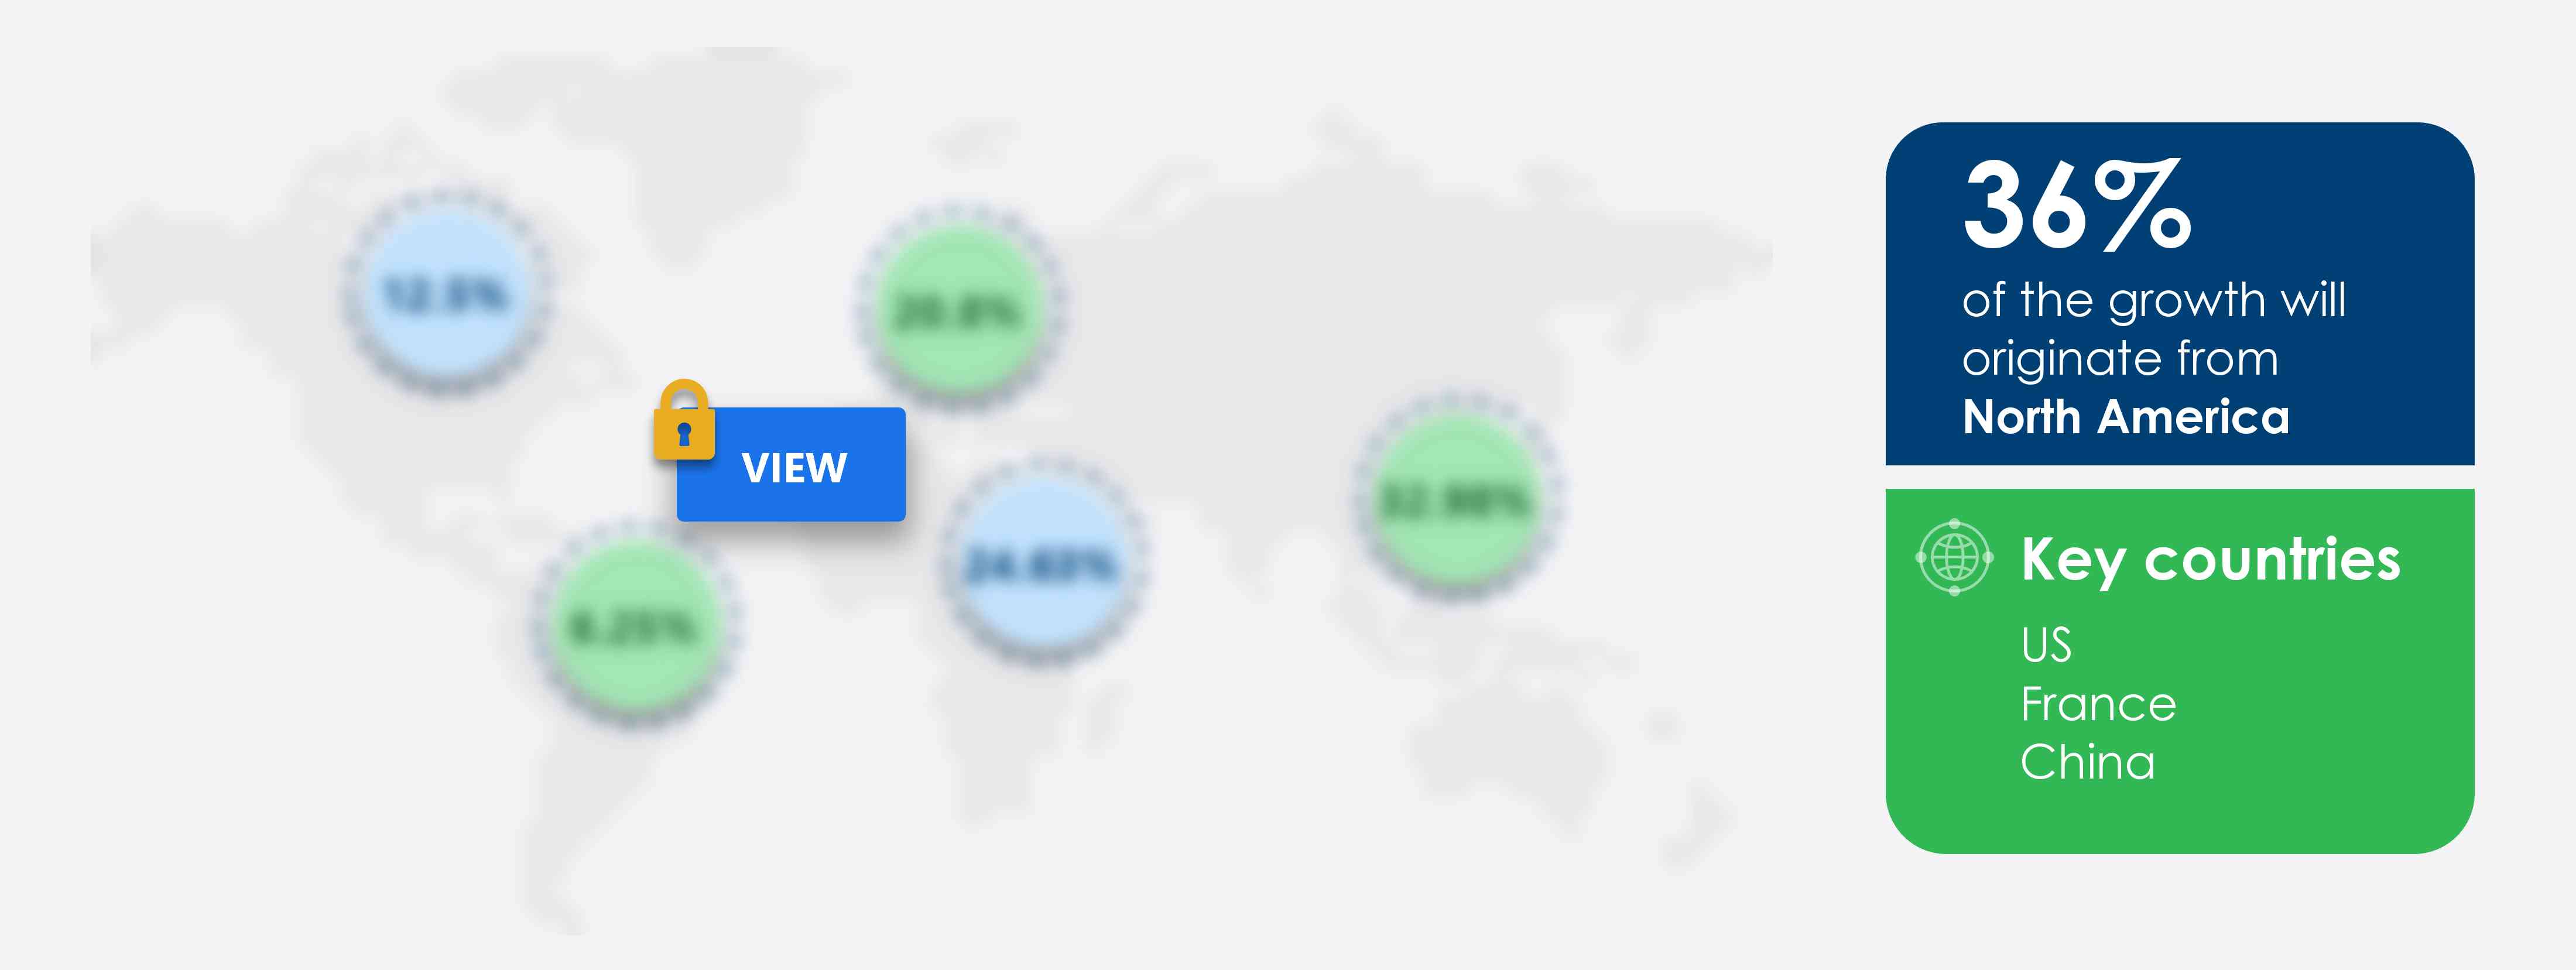
36% of the market’s growth will originate from North America during the forecast period. US and Canada are the key markets for commercial aerospace 3d printing market in North America. Market growth in this region will be slower than the growth of the market in Europe and APAC.
The expansion of facilities and extensive use of 3D printing technology for different components and parts will facilitate the commercial aerospace 3d printing market growth in North America over the forecast period. This market research report entails detailed information on the competitive intelligence, marketing gaps, and regional opportunities in store for vendors, which will assist in creating efficient business plans.
COVID Impact and Recovery Analysis
The outbreak of the COVID-19 pandemic in the region severely impacted the regional aviation industry. According to the IATA, in June 2020, the international traffic fell by 86.1%, and the domestic traffic demand fell by 63.9% on a year-over-year (Y-o-Y) basis. According to the Bureau of Transportation Statistics, the number of airline passengers combining both international and domestic, declined by 80% in 2020 when compared to the previous year. However, in June 2020, airlines carried over 93% more passengers as compared with May 2020, owing to relaxation in travel restrictions. Therefore, with the relaxation in traveling norms and the resumption of airline services in the region, air traveling, is expected to propel the demand for aircraft manufacturing, thereby driving the growth of the market in focus in North America.
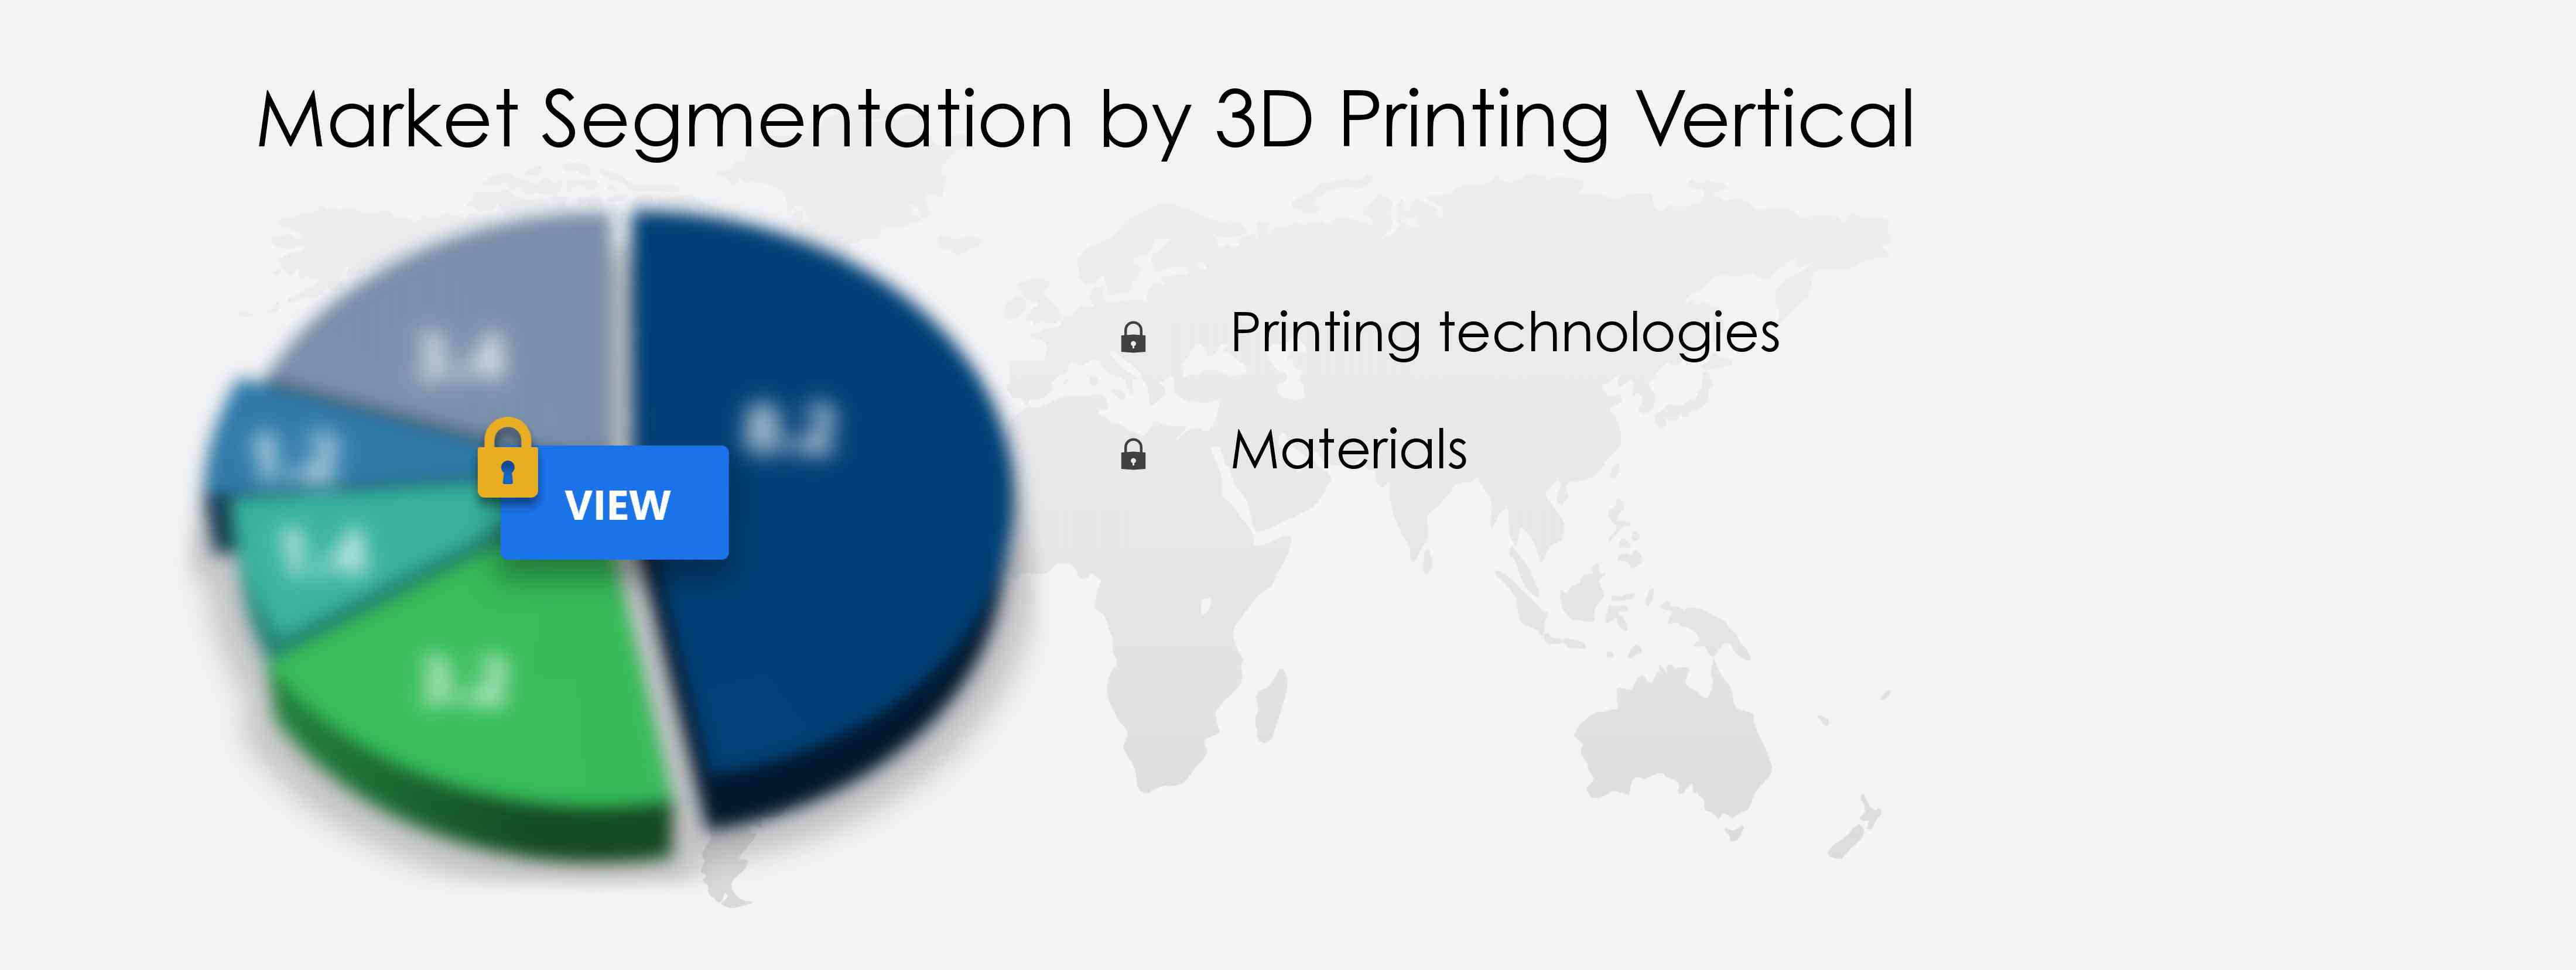
What are the Revenue-generating 3D Printing Vertical Segments in the Commercial Aerospace 3D Printing Market?
To gain further insights on the market contribution of various segments Request for a FREE sample
The commercial aerospace 3d printing market share growth by the printing technologies segment will be significant during the forecast period. Advancements in 3D printing technology have led to the development of many new processes such as binder jetting, stereolithography, directed energy deposition (DED), material jetting, and sheet lamination. Of which, the binder jetting and direct energy deposition techniques have been notably used in the manufacturing of aircraft components.
This report provides an accurate prediction of the contribution of all the segments to the growth of the commercial aerospace 3d printing market size and actionable market insights on post COVID-19 impact on each segment.
|
Commercial Aerospace 3D Printing Market Scope |
|
|
Report Coverage |
Details |
|
Page number |
120 |
|
Base year |
2020 |
|
Forecast period |
2021-2025 |
|
Growth momentum & CAGR |
Accelerate at a CAGR of 20.34% |
|
Market growth 2021-2025 |
$ 2.46 billion |
|
Market structure |
Fragmented |
|
YoY growth (%) |
8.35 |
|
Regional analysis |
North America, Europe, APAC, South America, and MEA |
|
Performing market contribution |
North America at 36% |
|
Key consumer countries |
US, France, China, Germany, and Canada |
|
Competitive landscape |
Leading companies, Competitive strategies, Consumer engagement scope |
|
Key companies profiled |
3D Systems Corp., Arconic Inc., EOS GmbH, General Electric Co., Hoganas AB, Materialise NV, Melrose Industries Plc, Sandvik AB, Stratasys Ltd., and The ExOne Company |
|
Market dynamics |
Parent market analysis, Market growth inducers and obstacles, Fast-growing and slow-growing segment analysis, COVID 19 impact and recovery analysis and future consumer dynamics, Market condition analysis for forecast period |
|
Customization purview |
If our report has not included the data that you are looking for, you can reach out to our analysts and get segments customized. |
What are the Key Data Covered in this Commercial Aerospace 3D Printing Market Report?
- CAGR of the market during the forecast period 2021-2025
- Detailed information on factors that will drive commercial aerospace 3d printing market growth during the next five years
- Precise estimation of the commercial aerospace 3d printing market size and its contribution to the parent market
- Accurate predictions on upcoming trends and changes in consumer behavior
- The growth of the commercial aerospace 3d printing industry across North America, Europe, APAC, South America, and MEA
- A thorough analysis of the market’s competitive landscape and detailed information on vendors
- Comprehensive details of factors that will challenge the growth of commercial aerospace 3d printing market vendors
We can help! Our analysts can customize this report to meet your requirements. Get in touch
 RIA -
RIA - 
