Commercial Telematics Market Analysis, Size, and Forecast 2026-2030: North America (US, Canada, and Mexico), Europe (Germany, UK, and France), APAC (China, Japan, and India), South America (Brazil and Argentina), Middle East and Africa (UAE, Saudi Arabia, and South Africa), and Rest of World (ROW)

Commercial Telematics Market Analysis, Size, and Forecast 2026-2030:
North America (US, Canada, and Mexico), Europe (Germany, UK, and France), APAC (China, Japan, and India), South America (Brazil and Argentina), Middle East and Africa (UAE, Saudi Arabia, and South Africa), and Rest of World (ROW)

Published: Apr 2026 293 Pages SKU: IRTNTR41390

Market Overview at a Glance

$35.74 B
Market Opportunity
11.9%
CAGR 2025 - 2030
33.1%
North America Growth
$30.77 B
Solutions segment 2024

Commercial Telematics Market Size 2026-2030

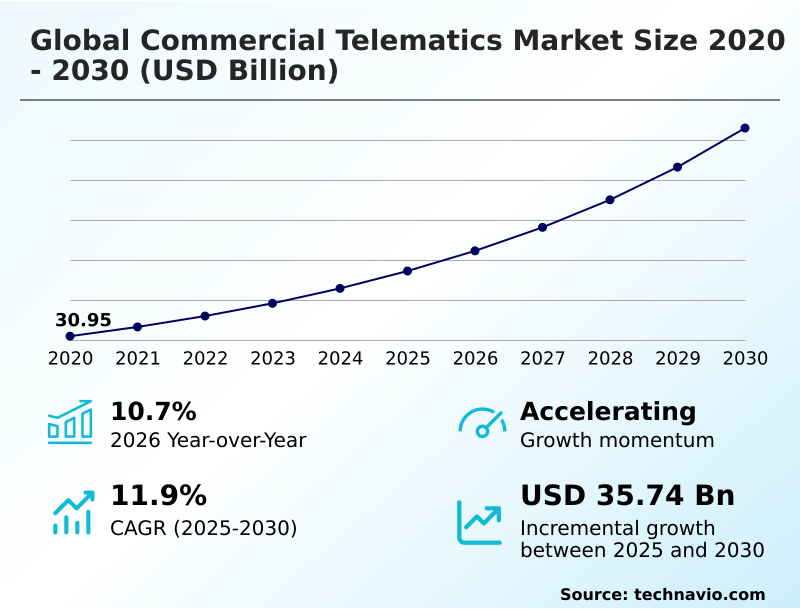
The commercial telematics market size is valued to increase by USD 35.74 billion, at a CAGR of 11.9% from 2025 to 2030. Regulatory mandates and global safety standardization protocols will drive the commercial telematics market.

Major Market Trends & Insights

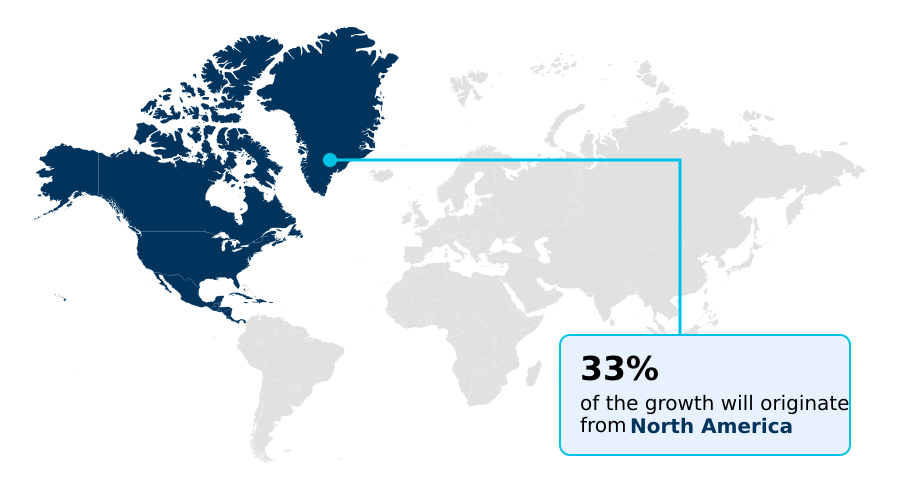
  • North America dominated the market and accounted for a 33.1% growth during the forecast period.
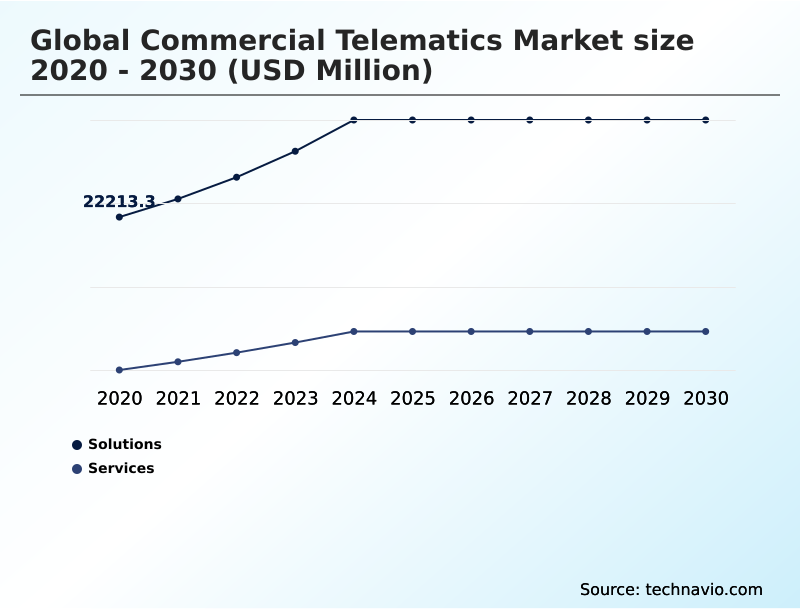
  • By Product - Solutions segment was valued at USD 30.77 billion in 2024
  • By Platform - Embedded systems segment accounted for the largest market revenue share in 2024

Market Size & Forecast

  • Market Opportunities: USD 52.04 billion
  • Market Future Opportunities: USD 35.74 billion
  • CAGR from 2025 to 2030 : 11.9%

Market Summary

  • The commercial telematics market is undergoing a profound evolution, transitioning from basic location tracking to a sophisticated ecosystem for intelligent asset management. This shift is driven by the pressing need for enhanced operational efficiency and stringent regulatory adherence. Modern platforms provide deep visibility into fleet activity, enabling significant reductions in fuel consumption, optimized maintenance schedules, and improved driver performance.
  • For instance, a logistics company managing a cold-chain supply route leverages telematics to ensure compliance and efficiency. The system monitors cargo temperature in real-time, uses predictive analytics to reroute vehicles around traffic, and logs driver hours to meet safety mandates.
  • This level of data-driven insight, powered by a central cloud platform and enabled by real-time data integration, transforms telematics from a simple monitoring tool into a critical component of strategic business operations, directly impacting profitability and risk management.

What will be the Size of the Commercial Telematics Market during the forecast period?

Get Key Insights on Market Forecast (PDF) Request Free Sample

How is the Commercial Telematics Market Segmented?

The commercial telematics industry research report provides comprehensive data (region-wise segment analysis), with forecasts and estimates in "USD million" for the period 2026-2030, as well as historical data from 2020-2024 for the following segments.

  • Product
    • Solutions
    • Services
  • Platform
    • Embedded systems
    • Tethered systems
    • Smartphone integration systems
  • Solution
    • Fleet management
    • Vehicle tracking
    • Satellite navigation
  • Geography
    • North America
      • US
      • Canada
      • Mexico
    • Europe
      • Germany
      • UK
      • France
    • APAC
      • China
      • Japan
      • India
    • South America
      • Brazil
      • Argentina
    • Middle East and Africa
      • UAE
      • Saudi Arabia
      • South Africa
    • Rest of World (ROW)

By Product Insights

The solutions segment is estimated to witness significant growth during the forecast period.

The commercial telematics market is segmented by distinct product and platform types, addressing varied operational needs.

The solutions segment, which includes integrated hardware and software, provides the core infrastructure for data acquisition through systems like the telematics control unit and onboard diagnostics port. This enables critical functions such as fleet intelligence and asset tracking.

The services segment focuses on recurring revenue streams from data analytics, consulting, and managed security.

Platform segmentation further divides the market into embedded systems, which are factory-installed for deep vehicle integration, tethered systems offering a balance of data depth and flexibility, and smartphone integration systems that leverage mobile devices for driver-centric applications.

This granular segmentation allows businesses to adopt real-time data integration strategies that improve route efficiency by over 15% by utilizing accelerometer data and machine learning algorithms for proactive safety.

Request Free Sample

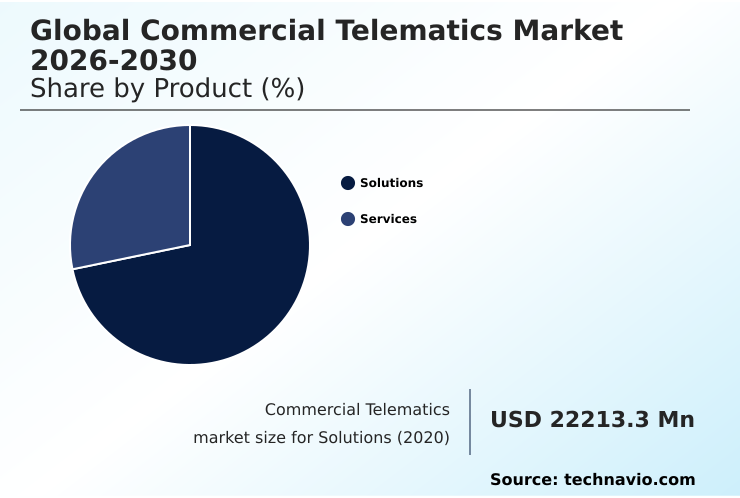
The Solutions segment was valued at USD 30.77 billion in 2024 and showed a gradual increase during the forecast period.

Request Free Sample

Regional Analysis

North America is estimated to contribute 33.1% to the growth of the global market during the forecast period.Technavio’s analysts have elaborately explained the regional trends and drivers that shape the market during the forecast period.

See How Commercial Telematics Market Demand is Rising in North America Request Free Sample

The geographic landscape of the commercial telematics market is characterized by a divergence between mature and high-growth regions.

North America and Europe lead in adoption, driven by stringent regulations and a focus on optimizing complex logistics networks, enabling fleets to achieve up to a 15% reduction in fuel costs.

North America alone is projected to account for 33% of the market's incremental growth.

In contrast, APAC is the fastest-growing region, where governments are mandating telematics for safety and infrastructure modernization, spurring rapid adoption of driver fatigue monitoring and cargo security solutions.

South America shows the highest growth potential, with a strong focus on asset preservation and security.

This regional diversification requires providers to offer tailored solutions, from advanced cross-border logistics support in developed markets to ruggedized hardware for remote asset management in emerging economies.

Market Dynamics

Our researchers analyzed the data with 2025 as the base year, along with the key drivers, trends, and challenges. A holistic analysis of drivers will help companies refine their marketing strategies to gain a competitive advantage.

  • Strategic adoption of telematics begins with companies comparing embedded vs aftermarket telematics solutions to find the best fit for their operational model. For specialized sectors, solutions are tailored, such as telematics for last-mile delivery optimization, which prioritizes route efficiency, or telematics solutions for cold chain logistics, focusing on temperature integrity.
  • The hardware and software adapt to different asset types, with predictive maintenance for heavy-duty trucks to minimize service interruptions and ruggedized telematics for construction equipment management in harsh environments. The rise of sustainable transport is addressed by commercial telematics for electric fleets, which focuses on battery and charging management.
  • A primary goal for all adopters is optimizing fuel efficiency with telematics, which is achieved through detailed data analysis. A significant benefit is improving driver safety with real-time coaching, which directly leads to telematics data for insurance premium reduction. AI-powered video telematics for safety provides objective evidence for incident analysis, while compliance with electronic logging device mandates is streamlined.
  • Technologically, the 5G impact on commercial vehicle telematics is enabling more data-rich applications. Businesses are focused on reducing vehicle downtime with analytics, where fleets using predictive data see a reduction in unplanned downtime that is twice as effective as those relying on scheduled servicing. Even smaller operations can benefit from smartphone-based telematics for small fleets.
  • Challenges remain, such as securing telematics data from cyber attacks and overcoming telematics network dead zones, but benefits like seamless telematics integration with ERP systems and asset tracking for non-powered trailers continue to drive the market forward, supported by telematics data for carbon footprint reporting.

What are the key market drivers leading to the rise in the adoption of Commercial Telematics Industry?

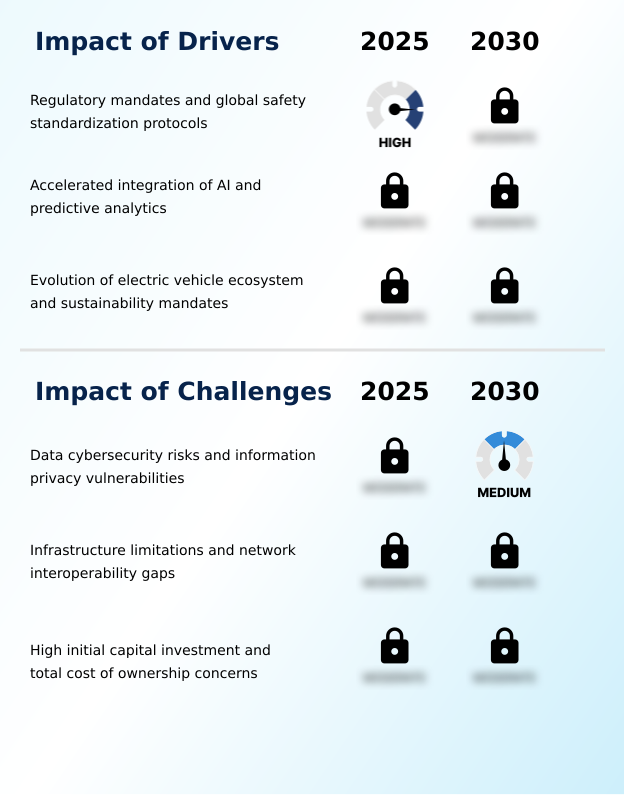
  • Regulatory mandates and global safety standardization protocols are a key driver of market growth.

  • Market growth is propelled by a confluence of regulatory, technological, and environmental drivers. Government mandates for electronic logging devices (ELD) and safety systems have made adoption non-negotiable in many regions, with compliant fleets seeing hours-of-service violations fall by over 50%.
  • The accelerated integration of AI and predictive analytics provides a strong ROI, as AI-powered driver coaching can decrease harsh braking events by 20%, directly improving safety and reducing wear.
  • Furthermore, the evolution of the electric vehicle ecosystem and sustainability mandates are pushing telematics into a new role.
  • Digital fleet management platforms are now essential tools for carbon footprint reporting and managing the complexities of charging infrastructure management, making them indispensable for green logistics initiatives.

What are the market trends shaping the Commercial Telematics Industry?

  • The market is experiencing a significant trend toward the convergence of 5G connectivity. This shift enables high-bandwidth vehicle-to-network architectures for advanced applications.

  • Key market trends are redefining operational capabilities through advanced technology. The convergence toward 5G connectivity is enabling high-bandwidth applications like high-definition video streaming from a telematics gateway, which can reduce incident review times by half. This supports a proactive safety stance and more effective driver coaching.
  • Simultaneously, the proliferation of AI-driven predictive analytics and fleet intelligence is transforming maintenance, with machine learning models improving scheduling accuracy by over 40%. This shift away from reactive repairs significantly boosts asset preservation.
  • Another major trend is the alignment with decarbonization goals, leading to the rise of specialized electric vehicle management systems and EV readiness modules that are crucial for managing mixed fleet management and ensuring carbon emission compliance.

What challenges does the Commercial Telematics Industry face during its growth?

  • Data cybersecurity risks and information privacy vulnerabilities represent a key challenge affecting industry growth.

  • Despite strong growth drivers, significant challenges persist, centered on security, infrastructure, and cost. Data cybersecurity risks and information privacy vulnerabilities are paramount, as a single breach can incur recovery costs exceeding the initial system investment by a factor of three. This necessitates robust hardware-based encryption.
  • Infrastructure limitations create network interoperability gaps, with connectivity dead zones affecting up to 10% of routes in some areas and disrupting real-time data integration. This is often addressed with store-and-forward mechanisms, which add latency.
  • Finally, high initial capital investment and total cost of ownership concerns remain a barrier, particularly as sophisticated systems increase in price, making it difficult for smaller operators to justify the expense without clear, short-term ROI, even with telematics-as-a-service models.

Exclusive Technavio Analysis on Customer Landscape

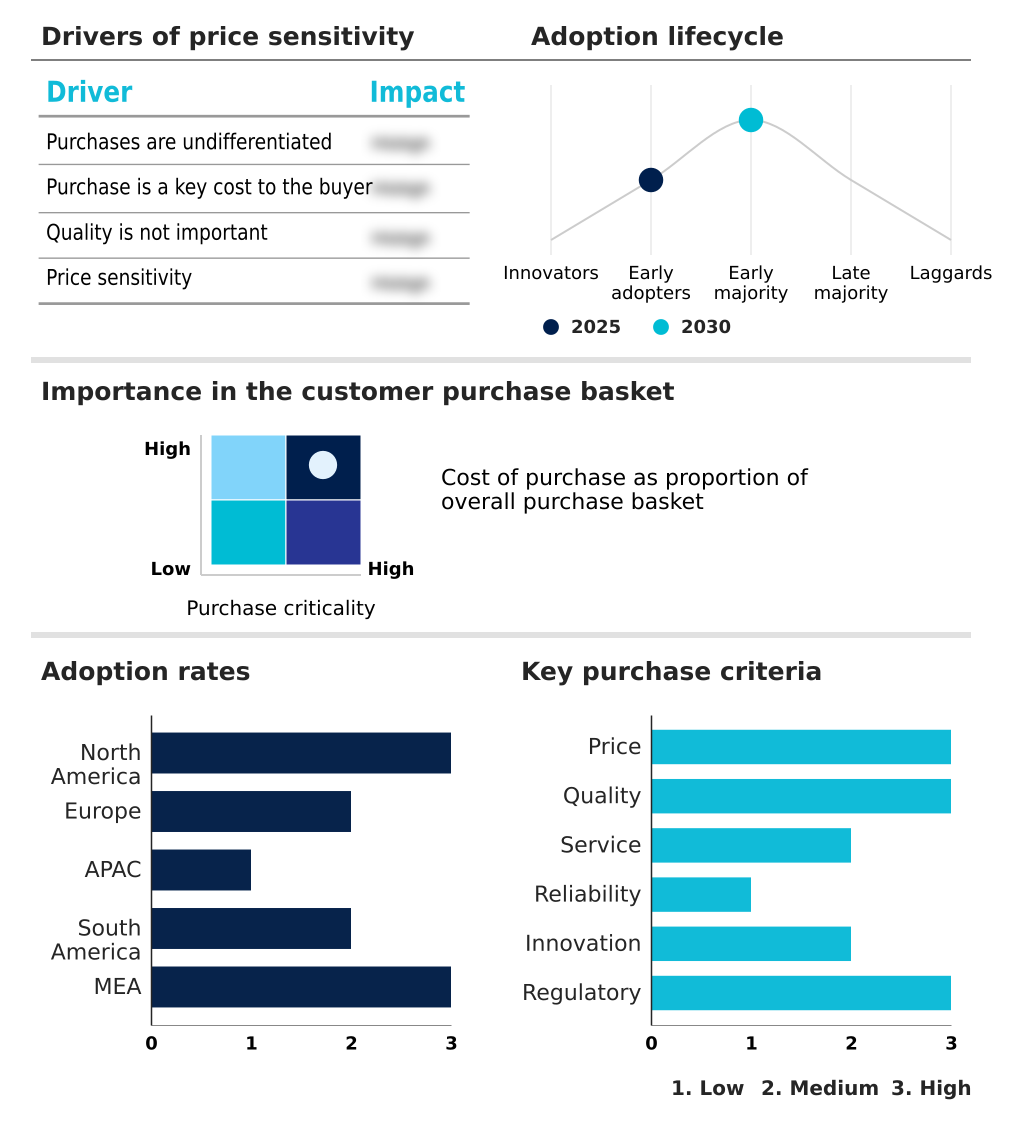
The commercial telematics market forecasting report includes the adoption lifecycle of the market, covering from the innovator’s stage to the laggard’s stage. It focuses on adoption rates in different regions based on penetration. Furthermore, the commercial telematics market report also includes key purchase criteria and drivers of price sensitivity to help companies evaluate and develop their market growth analysis strategies.

Customer Landscape of Commercial Telematics Industry

Competitive Landscape

Companies are implementing various strategies, such as strategic alliances, commercial telematics market forecast, partnerships, mergers and acquisitions, geographical expansion, and product/service launches, to enhance their presence in the industry.

CalAmp Corp. - Delivers cloud-based platforms and connected intelligence solutions, providing critical data for mobile asset monitoring and fleet protection.

The industry research and growth report includes detailed analyses of the competitive landscape of the market and information about key companies, including:

  • CalAmp Corp.
  • Continental AG
  • DENSO Corp.
  • Geotab Inc.
  • Harman International Industries
  • Lytx Inc
  • NetraDyne Inc.
  • Octo Telematics S.p.A.
  • Omnitracs LLC
  • PowerFleet Inc.
  • Qualcomm Inc.
  • Robert Bosch GmbH
  • Samsara Inc.
  • Solera Holdings LLC
  • Teletrac Navman US Ltd.
  • TomTom NV
  • Trimble Inc.
  • Verizon Connect
  • Vontier Corp.
  • Zonar Systems Inc.

Qualitative and quantitative analysis of companies has been conducted to help clients understand the wider business environment as well as the strengths and weaknesses of key industry players. Data is qualitatively analyzed to categorize companies as pure play, category-focused, industry-focused, and diversified; it is quantitatively analyzed to categorize companies as dominant, leading, strong, tentative, and weak.

Recent Development and News in Commercial telematics market

  • In January 2025, ZF Friedrichshafen AG launched its AI-driven fleet orchestration system, SCALAR, in New Delhi to automate real-time planning and dispatching operations for commercial transporters, enhancing decision-making for commercial operators.
  • In November 2024, Geotab Inc. announced the general availability of Geotab Ace, a generative AI assistant designed to process vast quantities of fleet data and provide immediate, natural-language responses to complex operational queries.
  • In March 2025, the Federal Motor Carrier Safety Administration (FMCSA) in the US implemented an updated technical audit framework for Electronic Logging Devices, requiring providers to undergo rigorous annual security certifications to remain on the approved registry.
  • In April 2025, Continental AG announced a strategic restructuring of its automotive group to focus specifically on the burgeoning market for connected and sustainable mobility solutions, aligning with the dual trends of digitalization and electrification.

Dive into Technavio’s robust research methodology, blending expert interviews, extensive data synthesis, and validated models for unparalleled Commercial Telematics Market insights. See full methodology.

Market Scope
Page number 293
Base year 2025
Historic period 2020-2024
Forecast period 2026-2030
Growth momentum & CAGR Accelerate at a CAGR of 11.9%
Market growth 2026-2030 USD 35741.0 million
Market structure Fragmented
YoY growth 2025-2026(%) 10.7%
Key countries US, Canada, Mexico, Germany, UK, France, Italy, Spain, The Netherlands, China, Japan, India, South Korea, Australia, Indonesia, Brazil, Argentina, Chile, UAE, Saudi Arabia, South Africa, Egypt and Nigeria
Competitive landscape Leading Companies, Market Positioning of Companies, Competitive Strategies, and Industry Risks

Request Free Sample

Research Analyst Overview

  • The commercial telematics market has evolved into a cornerstone of modern logistics, moving far beyond simple tracking. At its core, the telematics control unit interfaces with the onboard diagnostics port to collect a rich stream of data, including engine diagnostics and accelerometer data, transmitted via cellular networks or satellite networks to a central cloud platform.
  • Here, machine learning algorithms analyze fuel consumption patterns and other metrics to deliver predictive maintenance alerts and facilitate driver behavior monitoring. This shift toward intelligent analysis is critical, as firms utilizing these insights report up to a 30% reduction in unplanned vehicle downtime.
  • The integration of advanced features like computer vision for video telematics and specialized electric vehicle management for battery health monitoring is becoming standard. Furthermore, functionalities such as carbon footprint reporting and support for EV readiness modules are now influencing boardroom-level capital expenditure decisions, solidifying telematics as an indispensable strategic asset for any enterprise reliant on mobile operations.

What are the Key Data Covered in this Commercial Telematics Market Research and Growth Report?

  • What is the expected growth of the Commercial Telematics Market between 2026 and 2030?

    • USD 35.74 billion, at a CAGR of 11.9%

  • What segmentation does the market report cover?

    • The report is segmented by Product (Solutions, and Services), Platform (Embedded systems, Tethered systems, and Smartphone integration systems), Solution (Fleet management, Vehicle tracking, and Satellite navigation) and Geography (North America, Europe, APAC, South America, Middle East and Africa)

  • Which regions are analyzed in the report?

    • North America, Europe, APAC, South America and Middle East and Africa

  • What are the key growth drivers and market challenges?

    • Regulatory mandates and global safety standardization protocols , Data cybersecurity risks and information privacy vulnerabilities

  • Who are the major players in the Commercial Telematics Market?

    • CalAmp Corp., Continental AG, DENSO Corp., Geotab Inc., Harman International Industries, Lytx Inc, NetraDyne Inc., Octo Telematics S.p.A., Omnitracs LLC, PowerFleet Inc., Qualcomm Inc., Robert Bosch GmbH, Samsara Inc., Solera Holdings LLC, Teletrac Navman US Ltd., TomTom NV, Trimble Inc., Verizon Connect, Vontier Corp. and Zonar Systems Inc.

Market Research Insights

  • The dynamic nature of the market is fueled by the continuous pursuit of enhanced operational visibility and cost reduction. The adoption of platforms enabling proactive safety stance measures has been shown to reduce accident-related costs by up to 40% for some fleets. Furthermore, advanced analytics tools are improving fleet intelligence by over 25%, allowing for more precise supply chain synchronization.
  • This data-driven approach facilitates superior insurance risk mitigation and strengthens digital fleet management strategies. The ability to achieve such measurable outcomes underscores the technology's critical role in optimizing logistics and transport operations in a competitive landscape where efficiency gains are paramount.

We can help! Our analysts can customize this commercial telematics market research report to meet your requirements.

Get in touch

1. Executive Summary

1.1 Market overview

Executive Summary - Chart on Market Overview
Executive Summary - Data Table on Market Overview
Executive Summary - Chart on Global Market Characteristics
Executive Summary - Chart on Market by Geography
Executive Summary - Chart on Market Segmentation by Product
Executive Summary - Chart on Market Segmentation by Platform
Executive Summary - Chart on Market Segmentation by Solution
Executive Summary - Chart on Incremental Growth
Executive Summary - Data Table on Incremental Growth
Executive Summary - Chart on Company Market Positioning

2. Technavio Analysis

2.1 Analysis of price sensitivity, lifecycle, customer purchase basket, adoption rates, and purchase criteria

2.2 Criticality of inputs and Factors of differentiation

Chart on Overview on criticality of inputs and factors of differentiation

2.3 Factors of disruption

Chart on Overview on factors of disruption

2.4 Impact of drivers and challenges

Chart on Impact of drivers and challenges in 2025 and 2030

3. Market Landscape

3.1 Market ecosystem

Chart on Parent Market
Data Table on - Parent Market

3.2 Market characteristics

Chart on Market characteristics analysis

3.3 Value chain analysis

Chart on Value chain analysis

4. Market Sizing

4.1 Market definition

Data Table on Offerings of companies included in the market definition

4.2 Market segment analysis

Market segments

4.3 Market size 2025

4.4 Market outlook: Forecast for 2025-2030

Chart on Global - Market size and forecast 2025-2030 ($ million)
Data Table on Global - Market size and forecast 2025-2030 ($ million)
Chart on Global Market: Year-over-year growth 2025-2030 (%)
Data Table on Global Market: Year-over-year growth 2025-2030 (%)

5. Historic Market Size

5.1 Global Commercial Telematics Market 2020 - 2024

Historic Market Size - Data Table on Global Commercial Telematics Market 2020 - 2024 ($ million)

5.2 Product segment analysis 2020 - 2024

Historic Market Size - Product Segment 2020 - 2024 ($ million)

5.3 Platform segment analysis 2020 - 2024

Historic Market Size - Platform Segment 2020 - 2024 ($ million)

5.4 Solution segment analysis 2020 - 2024

Historic Market Size - Solution Segment 2020 - 2024 ($ million)

5.5 Geography segment analysis 2020 - 2024

Historic Market Size - Geography Segment 2020 - 2024 ($ million)

5.6 Country segment analysis 2020 - 2024

Historic Market Size - Country Segment 2020 - 2024 ($ million)

6. Qualitative Analysis

6.1 Impact of AI on global commercial telematics market

6.2 Impact of geopolitical conflicts on global commercial telematics market

7. Five Forces Analysis

7.1 Five forces summary

Five forces analysis - Comparison between 2025 and 2030

7.2 Bargaining power of buyers

Bargaining power of buyers - Impact of key factors 2025 and 2030

7.3 Bargaining power of suppliers

Bargaining power of suppliers - Impact of key factors in 2025 and 2030

7.4 Threat of new entrants

Threat of new entrants - Impact of key factors in 2025 and 2030

7.5 Threat of substitutes

Threat of substitutes - Impact of key factors in 2025 and 2030

7.6 Threat of rivalry

Threat of rivalry - Impact of key factors in 2025 and 2030

7.7 Market condition

Chart on Market condition - Five forces 2025 and 2030

8. Market Segmentation by Product

8.1 Market segments

Chart on Product - Market share 2025-2030 (%)
Data Table on Product - Market share 2025-2030 (%)

8.2 Comparison by Product

Chart on Comparison by Product
Data Table on Comparison by Product

8.3 Solutions - Market size and forecast 2025-2030

Chart on Solutions - Market size and forecast 2025-2030 ($ million)
Data Table on Solutions - Market size and forecast 2025-2030 ($ million)
Chart on Solutions - Year-over-year growth 2025-2030 (%)
Data Table on Solutions - Year-over-year growth 2025-2030 (%)

8.4 Services - Market size and forecast 2025-2030

Chart on Services - Market size and forecast 2025-2030 ($ million)
Data Table on Services - Market size and forecast 2025-2030 ($ million)
Chart on Services - Year-over-year growth 2025-2030 (%)
Data Table on Services - Year-over-year growth 2025-2030 (%)

8.5 Market opportunity by Product

Market opportunity by Product ($ million)
Data Table on Market opportunity by Product ($ million)

9. Market Segmentation by Platform

9.1 Market segments

Chart on Platform - Market share 2025-2030 (%)
Data Table on Platform - Market share 2025-2030 (%)

9.2 Comparison by Platform

Chart on Comparison by Platform
Data Table on Comparison by Platform

9.3 Embedded systems - Market size and forecast 2025-2030

Chart on Embedded systems - Market size and forecast 2025-2030 ($ million)
Data Table on Embedded systems - Market size and forecast 2025-2030 ($ million)
Chart on Embedded systems - Year-over-year growth 2025-2030 (%)
Data Table on Embedded systems - Year-over-year growth 2025-2030 (%)

9.4 Tethered systems - Market size and forecast 2025-2030

Chart on Tethered systems - Market size and forecast 2025-2030 ($ million)
Data Table on Tethered systems - Market size and forecast 2025-2030 ($ million)
Chart on Tethered systems - Year-over-year growth 2025-2030 (%)
Data Table on Tethered systems - Year-over-year growth 2025-2030 (%)

9.5 Smartphone integration systems - Market size and forecast 2025-2030

Chart on Smartphone integration systems - Market size and forecast 2025-2030 ($ million)
Data Table on Smartphone integration systems - Market size and forecast 2025-2030 ($ million)
Chart on Smartphone integration systems - Year-over-year growth 2025-2030 (%)
Data Table on Smartphone integration systems - Year-over-year growth 2025-2030 (%)

9.6 Market opportunity by Platform

Market opportunity by Platform ($ million)
Data Table on Market opportunity by Platform ($ million)

10. Market Segmentation by Solution

10.1 Market segments

Chart on Solution - Market share 2025-2030 (%)
Data Table on Solution - Market share 2025-2030 (%)

10.2 Comparison by Solution

Chart on Comparison by Solution
Data Table on Comparison by Solution

10.3 Fleet management - Market size and forecast 2025-2030

Chart on Fleet management - Market size and forecast 2025-2030 ($ million)
Data Table on Fleet management - Market size and forecast 2025-2030 ($ million)
Chart on Fleet management - Year-over-year growth 2025-2030 (%)
Data Table on Fleet management - Year-over-year growth 2025-2030 (%)

10.4 Vehicle tracking - Market size and forecast 2025-2030

Chart on Vehicle tracking - Market size and forecast 2025-2030 ($ million)
Data Table on Vehicle tracking - Market size and forecast 2025-2030 ($ million)
Chart on Vehicle tracking - Year-over-year growth 2025-2030 (%)
Data Table on Vehicle tracking - Year-over-year growth 2025-2030 (%)

10.5 Satellite navigation - Market size and forecast 2025-2030

Chart on Satellite navigation - Market size and forecast 2025-2030 ($ million)
Data Table on Satellite navigation - Market size and forecast 2025-2030 ($ million)
Chart on Satellite navigation - Year-over-year growth 2025-2030 (%)
Data Table on Satellite navigation - Year-over-year growth 2025-2030 (%)

10.6 Market opportunity by Solution

Market opportunity by Solution ($ million)
Data Table on Market opportunity by Solution ($ million)

11. Customer Landscape

11.1 Customer landscape overview

Analysis of price sensitivity, lifecycle, customer purchase basket, adoption rates, and purchase criteria

12. Geographic Landscape

12.1 Geographic segmentation

Chart on Market share by geography 2025-2030 (%)
Data Table on Market share by geography 2025-2030 (%)

12.2 Geographic comparison

Chart on Geographic comparison
Data Table on Geographic comparison

12.3 North America - Market size and forecast 2025-2030

Chart on North America - Market size and forecast 2025-2030 ($ million)
Data Table on North America - Market size and forecast 2025-2030 ($ million)
Chart on North America - Year-over-year growth 2025-2030 (%)
Data Table on North America - Year-over-year growth 2025-2030 (%)
Chart on Regional Comparison - North America
Data Table on Regional Comparison - North America

12.3.1 US - Market size and forecast 2025-2030

Chart on US - Market size and forecast 2025-2030 ($ million)
Data Table on US - Market size and forecast 2025-2030 ($ million)
Chart on US - Year-over-year growth 2025-2030 (%)
Data Table on US - Year-over-year growth 2025-2030 (%)

12.3.2 Canada - Market size and forecast 2025-2030

Chart on Canada - Market size and forecast 2025-2030 ($ million)
Data Table on Canada - Market size and forecast 2025-2030 ($ million)
Chart on Canada - Year-over-year growth 2025-2030 (%)
Data Table on Canada - Year-over-year growth 2025-2030 (%)

12.3.3 Mexico - Market size and forecast 2025-2030

Chart on Mexico - Market size and forecast 2025-2030 ($ million)
Data Table on Mexico - Market size and forecast 2025-2030 ($ million)
Chart on Mexico - Year-over-year growth 2025-2030 (%)
Data Table on Mexico - Year-over-year growth 2025-2030 (%)

12.4 Europe - Market size and forecast 2025-2030

Chart on Europe - Market size and forecast 2025-2030 ($ million)
Data Table on Europe - Market size and forecast 2025-2030 ($ million)
Chart on Europe - Year-over-year growth 2025-2030 (%)
Data Table on Europe - Year-over-year growth 2025-2030 (%)
Chart on Regional Comparison - Europe
Data Table on Regional Comparison - Europe

12.4.1 Germany - Market size and forecast 2025-2030

Chart on Germany - Market size and forecast 2025-2030 ($ million)
Data Table on Germany - Market size and forecast 2025-2030 ($ million)
Chart on Germany - Year-over-year growth 2025-2030 (%)
Data Table on Germany - Year-over-year growth 2025-2030 (%)

12.4.2 UK - Market size and forecast 2025-2030

Chart on UK - Market size and forecast 2025-2030 ($ million)
Data Table on UK - Market size and forecast 2025-2030 ($ million)
Chart on UK - Year-over-year growth 2025-2030 (%)
Data Table on UK - Year-over-year growth 2025-2030 (%)

12.4.3 France - Market size and forecast 2025-2030

Chart on France - Market size and forecast 2025-2030 ($ million)
Data Table on France - Market size and forecast 2025-2030 ($ million)
Chart on France - Year-over-year growth 2025-2030 (%)
Data Table on France - Year-over-year growth 2025-2030 (%)

12.4.4 Italy - Market size and forecast 2025-2030

Chart on Italy - Market size and forecast 2025-2030 ($ million)
Data Table on Italy - Market size and forecast 2025-2030 ($ million)
Chart on Italy - Year-over-year growth 2025-2030 (%)
Data Table on Italy - Year-over-year growth 2025-2030 (%)

12.4.5 Spain - Market size and forecast 2025-2030

Chart on Spain - Market size and forecast 2025-2030 ($ million)
Data Table on Spain - Market size and forecast 2025-2030 ($ million)
Chart on Spain - Year-over-year growth 2025-2030 (%)
Data Table on Spain - Year-over-year growth 2025-2030 (%)

12.4.6 The Netherlands - Market size and forecast 2025-2030

Chart on The Netherlands - Market size and forecast 2025-2030 ($ million)
Data Table on The Netherlands - Market size and forecast 2025-2030 ($ million)
Chart on The Netherlands - Year-over-year growth 2025-2030 (%)
Data Table on The Netherlands - Year-over-year growth 2025-2030 (%)

12.5 APAC - Market size and forecast 2025-2030

Chart on APAC - Market size and forecast 2025-2030 ($ million)
Data Table on APAC - Market size and forecast 2025-2030 ($ million)
Chart on APAC - Year-over-year growth 2025-2030 (%)
Data Table on APAC - Year-over-year growth 2025-2030 (%)
Chart on Regional Comparison - APAC
Data Table on Regional Comparison - APAC

12.5.1 China - Market size and forecast 2025-2030

Chart on China - Market size and forecast 2025-2030 ($ million)
Data Table on China - Market size and forecast 2025-2030 ($ million)
Chart on China - Year-over-year growth 2025-2030 (%)
Data Table on China - Year-over-year growth 2025-2030 (%)

12.5.2 Japan - Market size and forecast 2025-2030

Chart on Japan - Market size and forecast 2025-2030 ($ million)
Data Table on Japan - Market size and forecast 2025-2030 ($ million)
Chart on Japan - Year-over-year growth 2025-2030 (%)
Data Table on Japan - Year-over-year growth 2025-2030 (%)

12.5.3 India - Market size and forecast 2025-2030

Chart on India - Market size and forecast 2025-2030 ($ million)
Data Table on India - Market size and forecast 2025-2030 ($ million)
Chart on India - Year-over-year growth 2025-2030 (%)
Data Table on India - Year-over-year growth 2025-2030 (%)

12.5.4 South Korea - Market size and forecast 2025-2030

Chart on South Korea - Market size and forecast 2025-2030 ($ million)
Data Table on South Korea - Market size and forecast 2025-2030 ($ million)
Chart on South Korea - Year-over-year growth 2025-2030 (%)
Data Table on South Korea - Year-over-year growth 2025-2030 (%)

12.5.5 Australia - Market size and forecast 2025-2030

Chart on Australia - Market size and forecast 2025-2030 ($ million)
Data Table on Australia - Market size and forecast 2025-2030 ($ million)
Chart on Australia - Year-over-year growth 2025-2030 (%)
Data Table on Australia - Year-over-year growth 2025-2030 (%)

12.5.6 Indonesia - Market size and forecast 2025-2030

Chart on Indonesia - Market size and forecast 2025-2030 ($ million)
Data Table on Indonesia - Market size and forecast 2025-2030 ($ million)
Chart on Indonesia - Year-over-year growth 2025-2030 (%)
Data Table on Indonesia - Year-over-year growth 2025-2030 (%)

12.6 South America - Market size and forecast 2025-2030

Chart on South America - Market size and forecast 2025-2030 ($ million)
Data Table on South America - Market size and forecast 2025-2030 ($ million)
Chart on South America - Year-over-year growth 2025-2030 (%)
Data Table on South America - Year-over-year growth 2025-2030 (%)
Chart on Regional Comparison - South America
Data Table on Regional Comparison - South America

12.6.1 Brazil - Market size and forecast 2025-2030

Chart on Brazil - Market size and forecast 2025-2030 ($ million)
Data Table on Brazil - Market size and forecast 2025-2030 ($ million)
Chart on Brazil - Year-over-year growth 2025-2030 (%)
Data Table on Brazil - Year-over-year growth 2025-2030 (%)

12.6.2 Argentina - Market size and forecast 2025-2030

Chart on Argentina - Market size and forecast 2025-2030 ($ million)
Data Table on Argentina - Market size and forecast 2025-2030 ($ million)
Chart on Argentina - Year-over-year growth 2025-2030 (%)
Data Table on Argentina - Year-over-year growth 2025-2030 (%)

12.6.3 Chile - Market size and forecast 2025-2030

Chart on Chile - Market size and forecast 2025-2030 ($ million)
Data Table on Chile - Market size and forecast 2025-2030 ($ million)
Chart on Chile - Year-over-year growth 2025-2030 (%)
Data Table on Chile - Year-over-year growth 2025-2030 (%)

12.7 Middle East and Africa - Market size and forecast 2025-2030

Chart on Middle East and Africa - Market size and forecast 2025-2030 ($ million)
Data Table on Middle East and Africa - Market size and forecast 2025-2030 ($ million)
Chart on Middle East and Africa - Year-over-year growth 2025-2030 (%)
Data Table on Middle East and Africa - Year-over-year growth 2025-2030 (%)
Chart on Regional Comparison - Middle East and Africa
Data Table on Regional Comparison - Middle East and Africa

12.7.1 UAE - Market size and forecast 2025-2030

Chart on UAE - Market size and forecast 2025-2030 ($ million)
Data Table on UAE - Market size and forecast 2025-2030 ($ million)
Chart on UAE - Year-over-year growth 2025-2030 (%)
Data Table on UAE - Year-over-year growth 2025-2030 (%)

12.7.2 Saudi Arabia - Market size and forecast 2025-2030

Chart on Saudi Arabia - Market size and forecast 2025-2030 ($ million)
Data Table on Saudi Arabia - Market size and forecast 2025-2030 ($ million)
Chart on Saudi Arabia - Year-over-year growth 2025-2030 (%)
Data Table on Saudi Arabia - Year-over-year growth 2025-2030 (%)

12.7.3 South Africa - Market size and forecast 2025-2030

Chart on South Africa - Market size and forecast 2025-2030 ($ million)
Data Table on South Africa - Market size and forecast 2025-2030 ($ million)
Chart on South Africa - Year-over-year growth 2025-2030 (%)
Data Table on South Africa - Year-over-year growth 2025-2030 (%)

12.7.4 Egypt - Market size and forecast 2025-2030

Chart on Egypt - Market size and forecast 2025-2030 ($ million)
Data Table on Egypt - Market size and forecast 2025-2030 ($ million)
Chart on Egypt - Year-over-year growth 2025-2030 (%)
Data Table on Egypt - Year-over-year growth 2025-2030 (%)

12.7.5 Nigeria - Market size and forecast 2025-2030

Chart on Nigeria - Market size and forecast 2025-2030 ($ million)
Data Table on Nigeria - Market size and forecast 2025-2030 ($ million)
Chart on Nigeria - Year-over-year growth 2025-2030 (%)
Data Table on Nigeria - Year-over-year growth 2025-2030 (%)

12.8 Market opportunity by geography

Market opportunity by geography ($ million)
Data Tables on Market opportunity by geography ($ million)

13. Drivers, Challenges, and Opportunity

13.1 Market drivers

Regulatory mandates and global safety standardization protocols
Accelerated integration of AI and predictive analytics
Evolution of electric vehicle ecosystem and sustainability mandates

13.2 Market challenges

Data cybersecurity risks and information privacy vulnerabilities
Infrastructure limitations and network interoperability gaps
High initial capital investment and total cost of ownership concerns

13.3 Impact of drivers and challenges

Impact of drivers and challenges in 2025 and 2030

13.4 Market opportunities

Convergence of 5G connectivity and high bandwidth vehicle to network architectures
Proliferation of AI driven predictive analytics and fleet intelligence
Decarbonization pressures and integration of electric vehicle management systems

14. Competitive Landscape

14.1 Overview

14.2

Overview on criticality of inputs and factors of differentiation

14.3 Landscape disruption

Overview on factors of disruption

14.4 Industry risks

Impact of key risks on business

15. Competitive Analysis

15.1 Companies profiled

Companies covered

15.2 Company ranking index

15.3 Market positioning of companies

Matrix on companies position and classification

15.4 CalAmp Corp.

CalAmp Corp. - Overview
CalAmp Corp. - Product / Service
CalAmp Corp. - Key offerings
SWOT

15.5 Continental AG

Continental AG - Overview
Continental AG - Business segments
Continental AG - Key offerings
Continental AG - Segment focus
SWOT

15.6 DENSO Corp.

DENSO Corp. - Overview
DENSO Corp. - Business segments
DENSO Corp. - Key offerings
DENSO Corp. - Segment focus
SWOT

15.7 Geotab Inc.

Geotab Inc. - Overview
Geotab Inc. - Product / Service
Geotab Inc. - Key offerings
SWOT

15.8 Harman International Industries

Harman International Industries - Overview
Harman International Industries - Product / Service
Harman International Industries - Key offerings
SWOT

15.9 Omnitracs LLC

Omnitracs LLC - Overview
Omnitracs LLC - Product / Service
Omnitracs LLC - Key offerings
SWOT

15.10 PowerFleet Inc.

PowerFleet Inc. - Overview
PowerFleet Inc. - Product / Service
PowerFleet Inc. - Key news
PowerFleet Inc. - Key offerings
SWOT

15.11 Qualcomm Inc.

Qualcomm Inc. - Overview
Qualcomm Inc. - Business segments
Qualcomm Inc. - Key news
Qualcomm Inc. - Key offerings
Qualcomm Inc. - Segment focus
SWOT

15.12 Robert Bosch GmbH

Robert Bosch GmbH - Overview
Robert Bosch GmbH - Product / Service
Robert Bosch GmbH - Key offerings
SWOT

15.13 Solera Holdings LLC

Solera Holdings LLC - Overview
Solera Holdings LLC - Product / Service
Solera Holdings LLC - Key offerings
SWOT

15.14 Teletrac Navman US Ltd.

Teletrac Navman US Ltd. - Overview
Teletrac Navman US Ltd. - Product / Service
Teletrac Navman US Ltd. - Key offerings
SWOT

15.15 TomTom NV

TomTom NV - Overview
TomTom NV - Business segments
TomTom NV - Key offerings
TomTom NV - Segment focus
SWOT

15.16 Trimble Inc.

Trimble Inc. - Overview
Trimble Inc. - Business segments
Trimble Inc. - Key offerings
Trimble Inc. - Segment focus
SWOT

15.17 Verizon Connect

Verizon Connect - Overview
Verizon Connect - Product / Service
Verizon Connect - Key offerings
SWOT

15.18 Vontier Corp.

Vontier Corp. - Overview
Vontier Corp. - Product / Service
Vontier Corp. - Key offerings
SWOT

16. Appendix

16.1 Scope of the report

Market definition
Objectives
Notes and caveats

16.2 Inclusions and exclusions checklist

Inclusions checklist
Exclusions checklist

16.3 Currency conversion rates for US$

16.4 Research methodology

16.5 Data procurement

Information sources

16.6 Data validation

16.7 Validation techniques employed for market sizing

16.8 Data synthesis

16.9 360 degree market analysis

16.10 List of abbreviations

Research Methodology

Technavio presents a detailed picture of the market by way of study, synthesis, and summation of data from multiple sources. The analysts have presented the various facets of the market with a particular focus on identifying the key industry influencers. The data thus presented is comprehensive, reliable, and the result of extensive research, both primary and secondary.

INFORMATION SOURCES

Primary sources

  • Manufacturers and suppliers
  • Channel partners
  • Industry experts
  • Strategic decision makers

Secondary sources

  • Industry journals and periodicals
  • Government data
  • Financial reports of key industry players
  • Historical data
  • Press releases

DATA ANALYSIS

Data Synthesis

  • Collation of data
  • Estimation of key figures
  • Analysis of derived insights

Data Validation

  • Triangulation with data models
  • Reference against proprietary databases
  • Corroboration with industry experts

REPORT WRITING

Qualitative

  • Market drivers
  • Market challenges
  • Market trends
  • Five forces analysis

Quantitative

  • Market size and forecast
  • Market segmentation
  • Geographical insights
  • Competitive landscape

Interested in this report?

Get your sample now to see our research methodology and insights!

Download Now

Frequently Asked Questions

Commercial Telematics market growth will increase by USD 35741.0 million during 2026-2030.

The Commercial Telematics market is expected to grow at a CAGR of 11.9% during 2026-2030.

Commercial Telematics market is segmented by Product (Solutions, Services) Platform (Embedded systems, Tethered systems, Smartphone integration systems) Solution (Fleet management, Vehicle tracking, Satellite navigation)

CalAmp Corp., Continental AG, DENSO Corp., Geotab Inc., Harman International Industries, Lytx Inc, NetraDyne Inc., Octo Telematics S.p.A., Omnitracs LLC, PowerFleet Inc., Qualcomm Inc., Robert Bosch GmbH, Samsara Inc., Solera Holdings LLC, Teletrac Navman US Ltd., TomTom NV, Trimble Inc., Verizon Connect, Vontier Corp., Zonar Systems Inc. are a few of the key vendors in the Commercial Telematics market.

North America will register the highest growth rate of 33.1% among the other regions. Therefore, the Commercial Telematics market in North America is expected to garner significant business opportunities for the vendors during the forecast period.

US, Canada, Mexico, Germany, UK, France, Italy, Spain, The Netherlands, China, Japan, India, South Korea, Australia, Indonesia, Brazil, Argentina, Chile, UAE, Saudi Arabia, South Africa, Egypt, Nigeria

  • Regulatory mandates and global safety standardization protocols is the driving factor this market.

The Commercial Telematics market vendors should focus on grabbing business opportunities from the Product segment as it accounted for the largest market share in the base year.
RIA - Research AI Assistant
Ask RIA