Communication Test Equipment Market Size 2026-2030
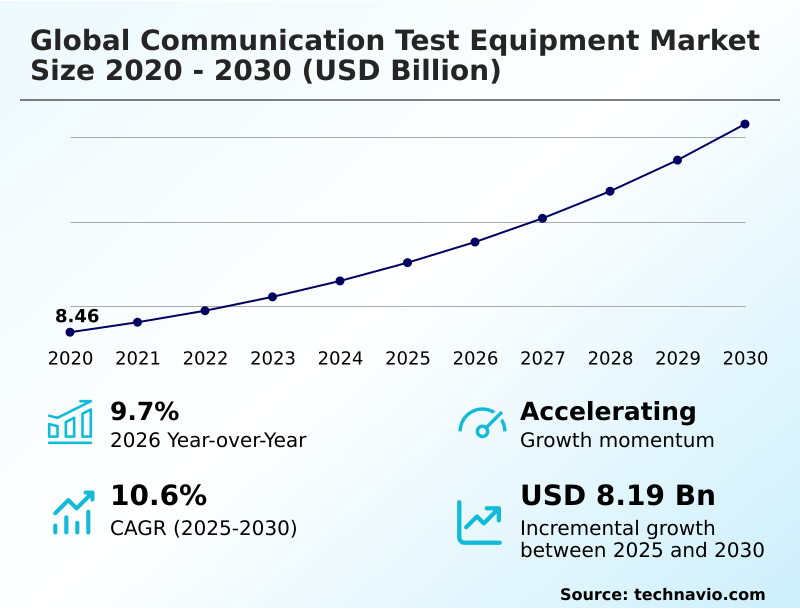
The communication test equipment market size is valued to increase by USD 8.19 billion, at a CAGR of 10.6% from 2025 to 2030. Transition toward 5G-advanced and early-stage 6G validation will drive the communication test equipment market.
Major Market Trends & Insights
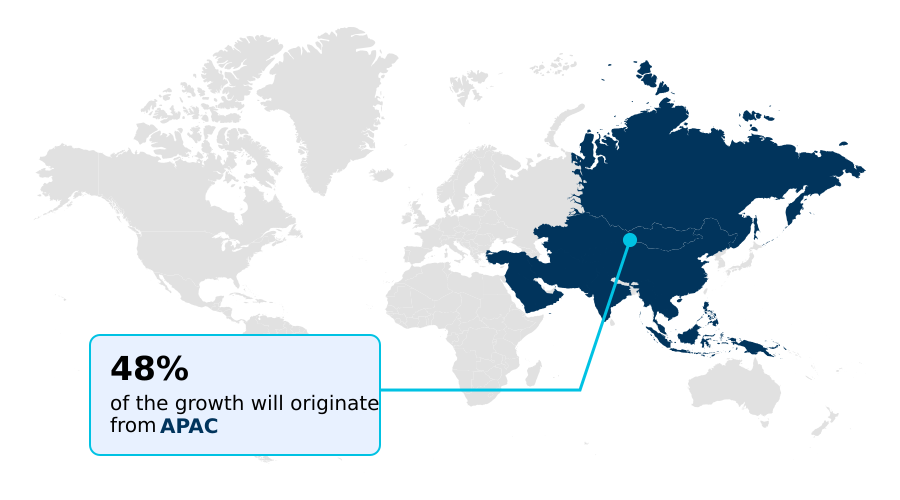
- APAC dominated the market and accounted for a 47.7% growth during the forecast period.
- By Application - Telecommunication segment was valued at USD 4.16 billion in 2024
- By Type - Field test equipment segment accounted for the largest market revenue share in 2024
Market Size & Forecast
- Market Opportunities: USD 12.30 billion
- Market Future Opportunities: USD 8.19 billion
- CAGR from 2025 to 2030 : 10.6%
Market Summary
- The communication test equipment market is undergoing a significant technical expansion, driven by the transition toward next-generation network architectures and increasing wireless standard complexity. As industries move beyond 5G deployments, the focus shifts to 5G-Advanced and early 6G research, demanding high precision in signal analysis, network emulation, and performance validation.
- The integration of AI and machine learning into testing platforms is a critical trend, enabling more efficient automated calibration and predictive diagnostics. For instance, a network operator can leverage AI-driven analytics for predictive fault detection, which improves network uptime by identifying potential signal interference or hardware degradation before it impacts users, thereby reducing operational costs.
- Furthermore, the rapid growth of high-capacity optical networks for data center interconnects and subsea cabling has intensified demand for advanced fiber optic testing solutions capable of handling multi-terabit speeds. The diversification of applications into non-terrestrial networks and satellite-to-mobile communications also requires specialized instrumentation to manage complex simulations, ensuring that emerging infrastructures meet rigorous latency and bandwidth requirements.
What will be the Size of the Communication Test Equipment Market during the forecast period?
Get Key Insights on Market Forecast (PDF) Get Free Sample
How is the Communication Test Equipment Market Segmented?
The communication test equipment industry research report provides comprehensive data (region-wise segment analysis), with forecasts and estimates in "USD million" for the period 2026-2030, as well as historical data from 2020-2024 for the following segments.
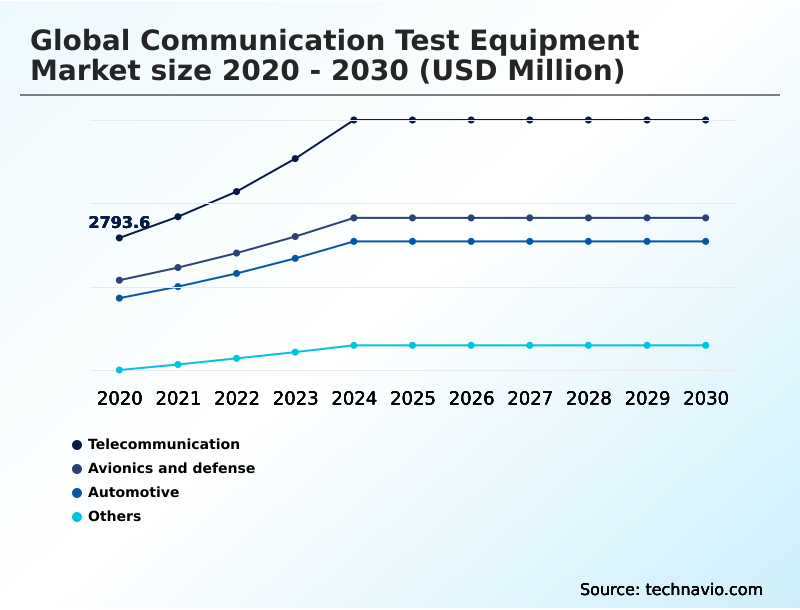
- Application
- Telecommunication
- Avionics and defense
- Automotive
- Others
- Type
- Field test equipment
- Laboratory test equipment
- Network test equipment
- Monitoring equipment
- Technology
- Wireless testing
- Optical fiber testing
- Geography
- APAC
- China
- Japan
- South Korea
- North America
- US
- Canada
- Mexico
- Europe
- Germany
- UK
- France
- South America
- Brazil
- Argentina
- Middle East and Africa
- Saudi Arabia
- UAE
- South Africa
- Rest of World (ROW)
- APAC
By Application Insights
The telecommunication segment is estimated to witness significant growth during the forecast period.
The telecommunication segment remains the primary application for communication test equipment, driven by the expansion of high-speed data networks and the shift to next-gen wireless architectures.
This domain demands rigorous protocol conformance, including signal integrity validation, for mobile infrastructure, fiber optic systems, and end-user devices.
The rollout of standalone 5G networks necessitates advanced over-the-air testing to validate beamforming, while AI-integrated network management tools automate anomaly detection and optimize spectrum efficiency, with some systems reducing network performance degradation by up to 20%.
As the industry prepares for 6G, the need for sub-terahertz frequency validation and high-frequency signal analysis will accelerate, solidifying this segment's role in driving innovation.
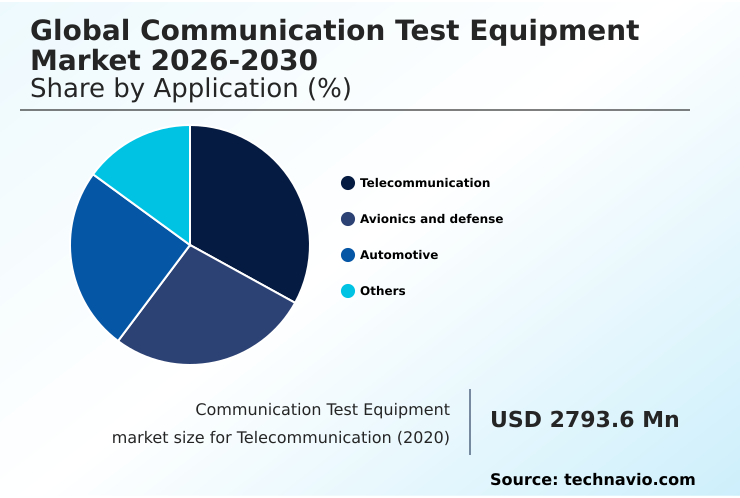
The Telecommunication segment was valued at USD 4.16 billion in 2024 and showed a gradual increase during the forecast period.
Regional Analysis
APAC is estimated to contribute 47.7% to the growth of the global market during the forecast period.Technavio’s analysts have elaborately explained the regional trends and drivers that shape the market during the forecast period.
See How Communication Test Equipment Market Demand is Rising in APAC Get Free Sample
The APAC region stands as the largest and most dynamic geography, fueled by rapid 5G network expansion and a massive electronics manufacturing ecosystem. It is the primary volume driver for both general-purpose and specialized mobile device and semiconductor validation solutions.
The region's 5G test equipment segment is projected to capture a market share exceeding 38%, driven by aggressive infrastructure densification.
This growth is complemented by the expansion of hyperscale data centers, creating a surge in demand for bit error rate testers and optical fiber characterization tools.
With automated production testing and early 6G research in sub-terahertz frequency analysis, APAC is set to remain the central laboratory for the future of wireless communication validation, and is expected to contribute nearly 48% of the market's incremental growth.
Market Dynamics
Our researchers analyzed the data with 2025 as the base year, along with the key drivers, trends, and challenges. A holistic analysis of drivers will help companies refine their marketing strategies to gain a competitive advantage.
- The evolution of communication networks necessitates a comprehensive testing strategy that addresses every stage of development and deployment. The journey begins with tackling sub-terahertz waveform analysis challenges inherent to 6G research. As designs mature, automated test for PCIe 6.0 interconnects becomes crucial for ensuring data center component reliability.
- Simultaneously, the industry is grappling with creating open-ran interoperability testing solutions to ensure seamless integration of multi-vendor hardware. In the optical domain, multicore fiber crosstalk measurement is essential for validating next-generation high-capacity backbones, while evaluating coherent optical communication techniques pushes the boundaries of long-haul data transmission.
- The expansion into new frontiers is evident with the focus on satellite-to-cell NTN protocol validation for global connectivity. Concurrently, the proliferation of Wi-Fi 8 and FR3 band testing ensures enhanced performance for consumer and industrial applications. Ensuring the physical layer's integrity requires advanced tools for automated fiber inspection for FTTx and bit error rate testing for ethernet.
- Furthermore, validating signal integrity in data centers is paramount as speeds increase. This complex environment demands end-to-end security audits for Open-RAN and effective RF spectrum monitoring in smart cities. Finally, achieving reliable autonomous systems depends on validating V2X communication reliability. Adopting automated workflows for these processes delivers operational cost reductions that are more than double those of traditional manual methods.
What are the key market drivers leading to the rise in the adoption of Communication Test Equipment Industry?
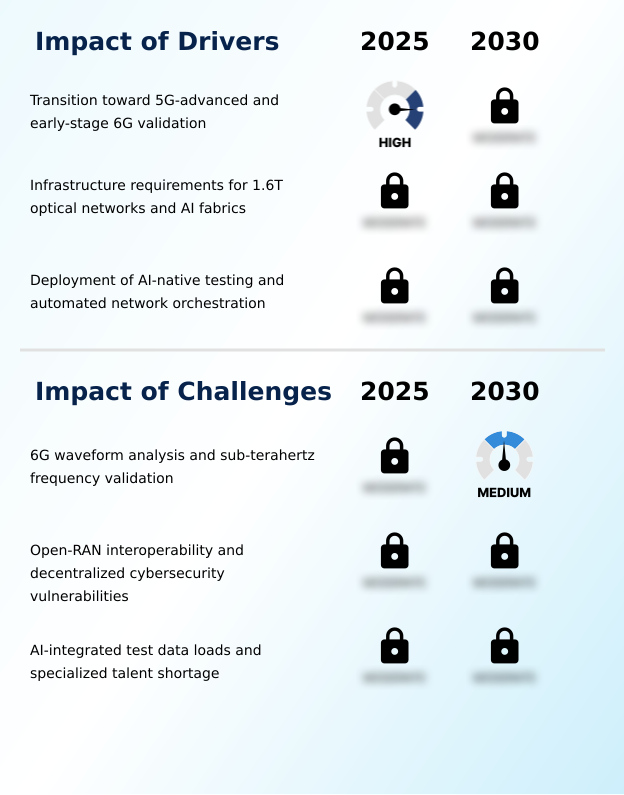
- A key market driver is the industry's transition toward 5G-Advanced technologies and the consequent need for early-stage 6G standardization and validation.
- Market growth is fundamentally driven by the transition toward next-generation network standards. The move to 5G-Advanced and early 6G validation necessitates wideband signal analyzers and generators for higher frequency ranges.
- A second major driver is the infrastructure requirement for 1.6T optical networks and AI fabrics, pushing the development of advanced sampling oscilloscopes that can validate 224G per-lane signaling. This has led to a 30% improvement in signal integrity verification accuracy.
- A third driver is the deployment of AI-native testing and automated network orchestration.
- This evolution toward AI-driven analytics provides real-time insights and predictive fault detection, reducing manual testing time by over 50% and simplifying complex test scenarios through intelligent automation and digital twin simulation.
What are the market trends shaping the Communication Test Equipment Industry?
- The market is shaped by the growth of validation capabilities for Wi-Fi 8. This includes specialized testing for the FR3 frequency band, a critical middle-ground between traditional cellular and millimeter-wave spectrums.
- Key trends are reshaping the market as demand for multi-gigabit wireless connectivity accelerates. The push for Wi-Fi 8 and FR3 frequency validation is driving the development of wide-bandwidth signal analyzers to support ultra-high reliability, with some solutions boosting data throughput by 40%.
- Simultaneously, the strategic expansion into non-terrestrial network and satellite-to-cell testing is becoming mainstream, integrating 4G, 5G, and NTN protocol validation within a single radio communication test station. This is critical for ensuring ubiquitous connectivity across land, sea, and air.
- Another significant trend is the expansion of multicore fiber and coherent optical evaluation, where new test equipment is essential for measuring inter-core crosstalk and transmission loss, improving network capacity by over 60% compared to single-core fibers.
What challenges does the Communication Test Equipment Industry face during its growth?
- A key challenge affecting market growth involves the complexities of 6G waveform analysis and the validation of sub-terahertz frequencies.
- The market faces significant structural challenges, beginning with the technical hurdles of 6G waveform analysis and sub-terahertz frequency validation, where existing hardware struggles with extreme signal attenuation.
- Secondly, the rapid adoption of Open-RAN architectures introduces interoperability barriers and cybersecurity vulnerabilities; industry studies show over 68% of professionals cite these as primary obstacles, leading to network performance degradation of up to 20%. Lastly, the reliance on AI-integrated test automation is hampered by a specialized talent shortage, with 35% of manufacturers reporting project delays.
- The high capital expenditure for AI-optimized hardware, which often carries a 40% price premium, further widens the technology gap for smaller enterprises.
Exclusive Technavio Analysis on Customer Landscape
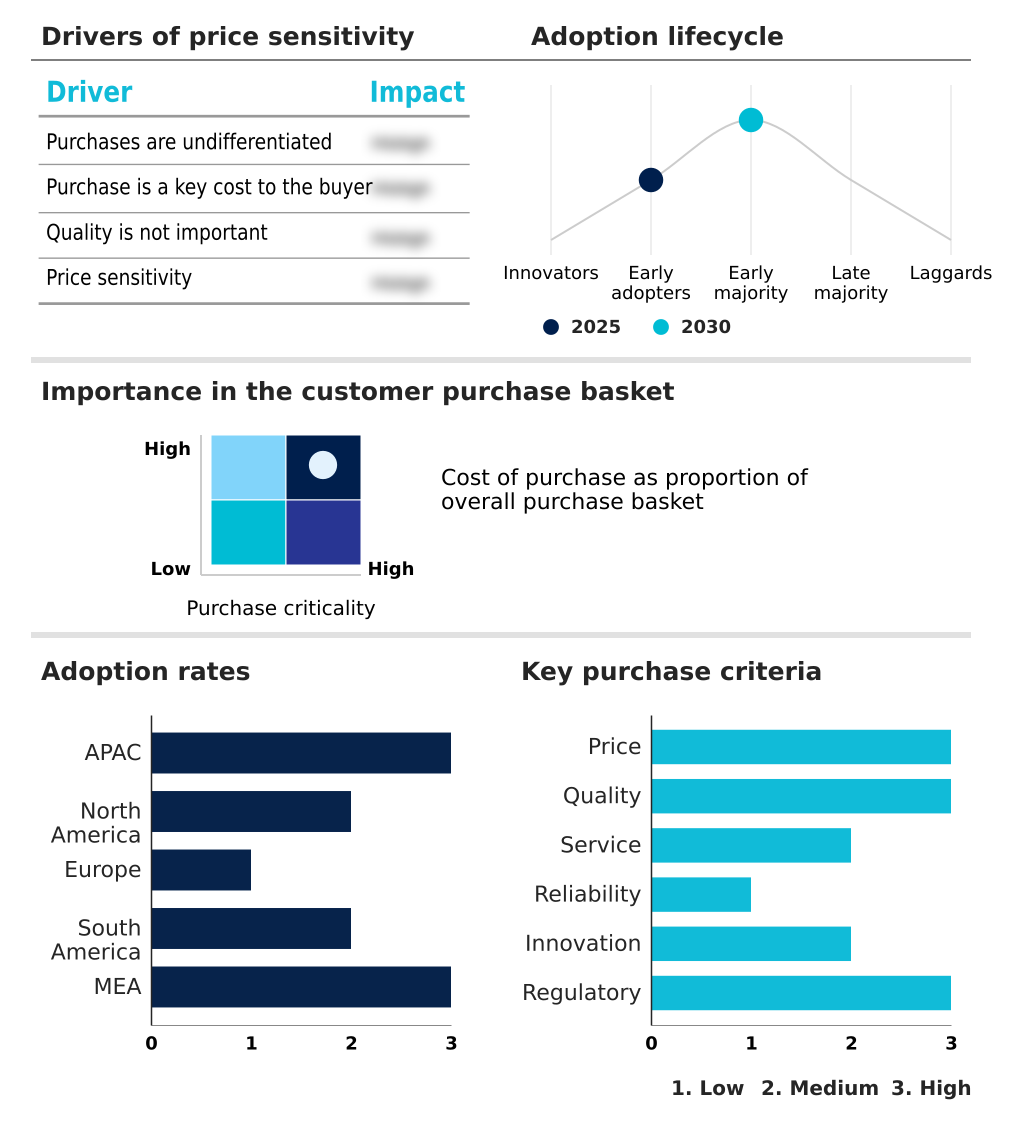
The communication test equipment market forecasting report includes the adoption lifecycle of the market, covering from the innovator’s stage to the laggard’s stage. It focuses on adoption rates in different regions based on penetration. Furthermore, the communication test equipment market report also includes key purchase criteria and drivers of price sensitivity to help companies evaluate and develop their market growth analysis strategies.
Customer Landscape of Communication Test Equipment Industry
Competitive Landscape
Companies are implementing various strategies, such as strategic alliances, communication test equipment market forecast, partnerships, mergers and acquisitions, geographical expansion, and product/service launches, to enhance their presence in the industry.
Advantest Corp. - Offerings include specialized test equipment, electronic measuring instruments, and automated solutions for validating the performance and reliability of wireless and electronic communication systems.
The industry research and growth report includes detailed analyses of the competitive landscape of the market and information about key companies, including:
- Advantest Corp.
- Analog Devices Inc.
- Anritsu Corp.
- Astronics Corp.
- Calnex Solutions Ltd.
- EXFO Inc.
- Farran
- GL Communications Inc.
- Good Will Instrument Co. Ltd.
- Keysight Technologies Inc.
- LitePoint Corp.
- National Instruments Corp.
- NetScout Systems Inc.
- Rohde and Schwarz GmbH
- Spirent Communications Plc
- Tektronix Inc.
- Teledyne LeCroy
- Texas Instruments Inc.
- Viavi Solutions Inc.
- Yokogawa Electric Corp.
Qualitative and quantitative analysis of companies has been conducted to help clients understand the wider business environment as well as the strengths and weaknesses of key industry players. Data is qualitatively analyzed to categorize companies as pure play, category-focused, industry-focused, and diversified; it is quantitatively analyzed to categorize companies as dominant, leading, strong, tentative, and weak.
Recent Development and News in Communication test equipment market
- In March 2025, Keysight Technologies Inc. announced new 224G test solutions engineered to validate 1.6T optical transceivers and AI data center fabrics, addressing the escalating bandwidth requirements driven by AI workloads.
- In February 2025, Anritsu Corp. showcased its integrated Non-Terrestrial Network (NTN) signaling test solutions and advanced channel emulators, designed to evaluate satellite-connected devices and verify global coverage capabilities.
- In November 2024, Rohde and Schwarz GmbH confirmed a strategic collaboration to utilize its CMP180 radio communication tester for validating next-generation Wi-Fi 8 access points, ensuring they meet global quality and performance standards.
- In September 2024, Teradyne Inc. announced a strategic partnership involving the acquisition of automated test equipment technology from a leading semiconductor firm to advance power semiconductor testing for telecommunications and electric vehicles.
Dive into Technavio’s robust research methodology, blending expert interviews, extensive data synthesis, and validated models for unparalleled Communication Test Equipment Market insights. See full methodology.
| Market Scope | |
|---|---|
| Page number | 302 |
| Base year | 2025 |
| Historic period | 2020-2024 |
| Forecast period | 2026-2030 |
| Growth momentum & CAGR | Accelerate at a CAGR of 10.6% |
| Market growth 2026-2030 | USD 8194.5 million |
| Market structure | Fragmented |
| YoY growth 2025-2026(%) | 9.7% |
| Key countries | China, Japan, South Korea, India, Taiwan, Indonesia, US, Canada, Mexico, Germany, UK, France, Italy, Spain, The Netherlands, Brazil, Argentina, Chile, Saudi Arabia, UAE, South Africa, Egypt and Nigeria |
| Competitive landscape | Leading Companies, Market Positioning of Companies, Competitive Strategies, and Industry Risks |
Research Analyst Overview
- The market's progression is defined by the relentless pursuit of higher data throughput and lower latency, compelling a constant evolution in testing methodologies. The transition to 5G-Advanced and early 6G validation drives the need for sophisticated instruments capable of sub-terahertz frequency characterization and validating AI-native testing protocols.
- A key boardroom consideration is the shift toward open-ran interoperability, which demands a strategic overhaul of procurement to avoid vendor lock-in while ensuring seamless performance. This requires precise protocol conformance and signal integrity checks. In the optical domain, the development of 1.6T optical networks and multicore fiber necessitates advanced coherent optical evaluation.
- Meanwhile, the growth of non-terrestrial network and satellite-to-cell testing expands the market's scope. The integration of AI-driven analytics allows for a reduction in manual testing workloads by more than 50%. This technological race is characterized by intense innovation in vector signal generators, network simulators, spectrum analyzers, and optical time-domain reflectometers to address emerging complexities.
- Mastery of these advanced testing paradigms is fundamental to achieving next-generation connectivity.
What are the Key Data Covered in this Communication Test Equipment Market Research and Growth Report?
-
What is the expected growth of the Communication Test Equipment Market between 2026 and 2030?
-
USD 8.19 billion, at a CAGR of 10.6%
-
-
What segmentation does the market report cover?
-
The report is segmented by Application (Telecommunication, Avionics and defense, Automotive, and Others), Type (Field test equipment, Laboratory test equipment, Network test equipment, and Monitoring equipment), Technology (Wireless testing, and Optical fiber testing) and Geography (APAC, North America, Europe, South America, Middle East and Africa)
-
-
Which regions are analyzed in the report?
-
APAC, North America, Europe, South America and Middle East and Africa
-
-
What are the key growth drivers and market challenges?
-
Transition toward 5G-advanced and early-stage 6G validation, 6G waveform analysis and sub-terahertz frequency validation
-
-
Who are the major players in the Communication Test Equipment Market?
-
Advantest Corp., Analog Devices Inc., Anritsu Corp., Astronics Corp., Calnex Solutions Ltd., EXFO Inc., Farran, GL Communications Inc., Good Will Instrument Co. Ltd., Keysight Technologies Inc., LitePoint Corp., National Instruments Corp., NetScout Systems Inc., Rohde and Schwarz GmbH, Spirent Communications Plc, Tektronix Inc., Teledyne LeCroy, Texas Instruments Inc., Viavi Solutions Inc. and Yokogawa Electric Corp.
-
Market Research Insights
- Market dynamics are shaped by a strategic pivot toward AI-driven automation in network test equipment to manage escalating complexity. Integrating AI into service assurance platforms has been shown to reduce manual testing time by over 50%, a critical efficiency gain for network operators.
- However, the adoption of Open-RAN architectures, while promoting vendor diversity, introduces significant interoperability challenges that can lead to network performance degradation of up to 20% in heterogeneous installations. This requires sophisticated, AI-driven test automation using telecom protocol analyzers to rectify interface friction. These automated test equipment systems are essential for maintaining quality of service as networks become more virtualized.
- The industry's evolution reflects a continuous effort to balance innovation with the practical need for reliable, high-performance network monitoring and validation across increasingly complex and disaggregated ecosystems.
We can help! Our analysts can customize this communication test equipment market research report to meet your requirements.
 RIA -
RIA - 
