US Community College Market Size 2026-2030
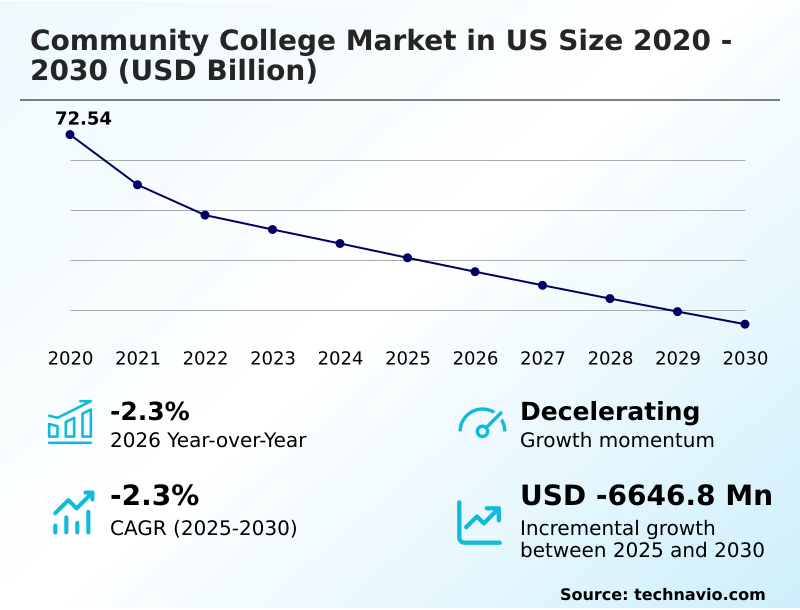
The US Community College Market size was valued at USD 60.22 billion in 2025, growing at a CAGR of -2.3% during the forecast period 2026-2030.
Major Market Trends & Insights
- By Revenue Stream - Government funds segment was valued at USD 27.83 billion in 2024
- By Courses - Associate degree segment accounted for the largest market revenue share in 2024
Market Size & Forecast
- Historic Market Opportunities 2020-2024: USD 18.96 billion
- Market Future Opportunities 2025-2030: USD 6.65 billion
- CAGR from 2025 to 2030 : -2.3%
Market Summary
- The community college market in US is undergoing a significant recalibration, with overall enrollment projected to decline by approximately 2.3% year-over-year due to demographic shifts and a robust job market.
- This pressure is forcing a strategic pivot from enrollment volume to student outcomes, where institutions implementing predictive student analytics have demonstrated an ability to increase retention rates by up to 15%. A key driver remains the strategic alignment with regional workforce development programs, providing a clear path to employment.
- However, this mission is consistently undermined by the persistent challenge of resource scarcity. As a real-world scenario, a community college receives, on average, 30% less in public funding per student than its four-year university counterparts, constraining its ability to invest in new technology and competitive faculty salaries.
- This funding gap directly impacts the quality of technical and vocational education and the ability to reduce the skills gap analysis for local employers.
What will be the Size of the US Community College Market during the forecast period?
Get Key Insights on Market Forecast (PDF) Request Free Sample
How is the US Community College Market Segmented?
The us community college industry research report provides comprehensive data (region-wise segment analysis), with forecasts and analysis for the period 2026-2030, as well as historical data from 2020-2024 for the following segments.
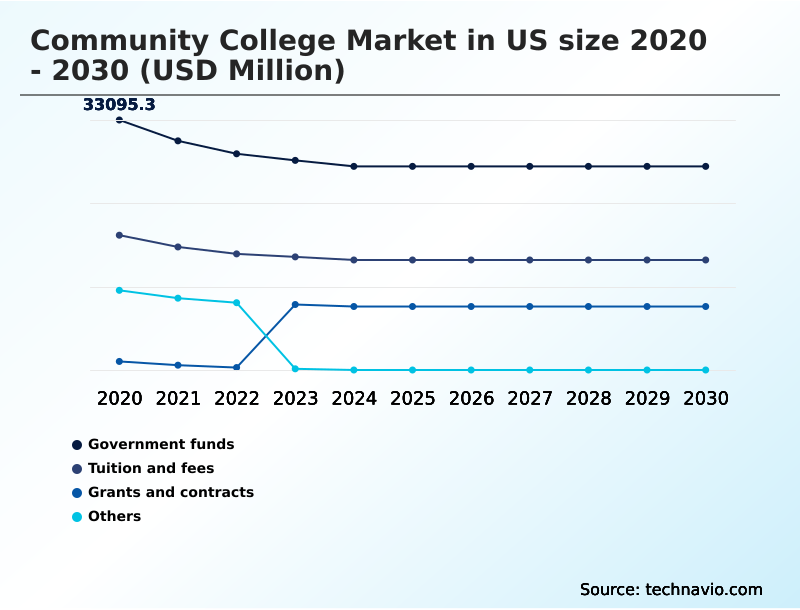
- Revenue stream
- Government funds
- Tuition and fees
- Grants and contracts
- Others
- Courses
- Associate degree
- TVET certification
- Continuing education
- Bachelors degree
- Delivery mode
- Online
- Hybrid
- On-campus
- Geography
- North America
- US
- North America
How is the US Community College Market Segmented by Revenue Stream?
The government funds segment is estimated to witness significant growth during the forecast period.
The government funds segment, which accounts for over 40% of total revenue, represents the most significant yet volatile income source for the community college market in US.
This revenue stream, primarily composed of state and local appropriations, is subject to economic cycles and political shifts, with funding per student varying by as much as 50% between different state systems.
This instability forces institutions to adapt enrollment management systems and financial aid management. A sudden 10% reduction in state funding can force a college to cut low-enrollment courses, directly impacting institutional effectiveness and student access to certain associate degree pathways.
Consequently, many institutions are now exploring performance-based funding models to create more predictable revenue streams tied to student success metrics.
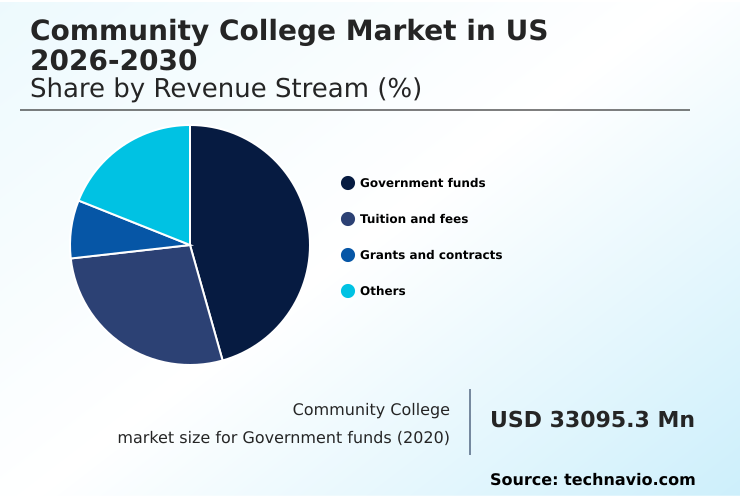
The Government funds segment was valued at USD 27.83 billion in 2024 and showed a gradual increase during the forecast period.
What are the key Drivers, Trends, and Challenges in the US Community College Market?
Our researchers analyzed the data with 2025 as the base year, along with the key drivers, trends, and challenges. A holistic analysis of drivers will help companies refine their marketing strategies to gain a competitive advantage.
- A critical focus for institutional strategy is the rigorous analysis of community college transfer success rates, which serves as a primary validator for academic programs and articulation agreements. This data is essential for marketing the value proposition, especially when students and families evaluate the total cost of associate degree vs bachelors.
- The long-term viability of these institutions increasingly depends on demonstrating community college workforce training effectiveness through tangible employment outcomes and wage gains for graduates. Simultaneously, the impact of online learning on community colleges continues to reshape delivery models, forcing investment in technology-enhanced classrooms and robust student engagement platforms to remain competitive.
- Underpinning these efforts is the need to prove community college student support services ROI. Institutions are finding that investments in wraparound support services, such as advising and tutoring, directly improve retention and completion, with data showing a potential 15% increase in course completion rates for students who utilize these resources, thereby bolstering all other key performance metrics.
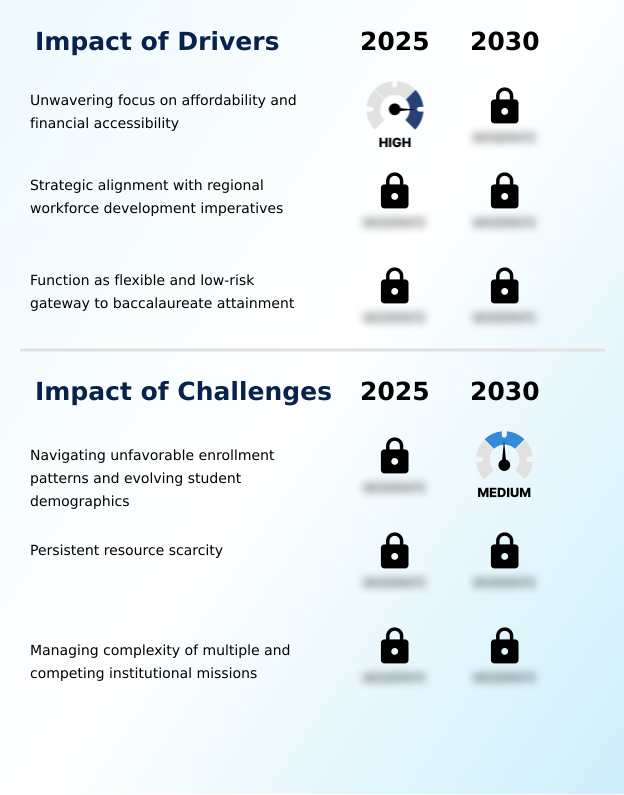
What are the key market drivers leading to the rise in the adoption of US Community College Industry?
- A primary driver for the community college market is the unwavering focus on affordability and broad financial accessibility, positioning these institutions as a crucial gateway to higher education and career advancement.
- The strategic alignment with regional workforce development imperatives is a powerful driver for the community college market in US.
- By using labor market intelligence to inform curriculum design, institutions can increase enrollment in high-demand career and technical education programs by as much as 15%.
- This symbiotic relationship with local employers, often formalized through public-private partnerships, ensures that technical and vocational education is directly relevant to industry needs.
- Graduates from programs that feature integrated experiential learning opportunities have been shown to command starting salaries that are, on average, 10% higher than their peers.
- This direct link between education and economic mobility solidifies the role of community colleges as essential engines for regional economic health and talent development.
What are the market trends shaping the US Community College Industry?
- The community college market is experiencing an intensified focus on non-credit programs and alternative credentialing. This shift represents a strategic pivot toward short-term, skill-based training aligned with immediate labor market demands.
- A primary trend reshaping the community college market in US is the expansion of non-credit programs and alternative credentials. This strategic shift is a direct response to employer demand for verifiable skills, with institutions offering stackable credentials seeing a 15% higher rate of students continuing on to a full degree compared to those in traditional, linear programs.
- The development of industry-recognized certifications, often created through public-private partnerships, has resulted in graduates seeing up to a 20% faster placement into jobs in high-demand fields. This focus on shorter, more flexible pathways, including digital badge systems and corporate training solutions, allows colleges to serve a broader demographic of adult learner programs while addressing immediate skills gap analysis.
What challenges does the US Community College Industry face during its growth?
- A significant challenge for the community college market is navigating unfavorable enrollment patterns and evolving student demographics, which creates operational volatility and strategic planning difficulties.
- Persistent resource scarcity remains a fundamental challenge for the community college market in US, directly constraining institutional effectiveness. On average, community colleges receive 30% less public funding per student compared to their four-year public university counterparts, despite serving populations with higher support needs. This funding disparity, coupled with the volatility of performance-based funding models, severely limits investment in critical areas.
- For instance, deferred maintenance on aging facilities can increase long-term operational costs by up to 20%, diverting funds from academic advising tools and student support. This forces an over-reliance on part-time adjunct faculty and restricts the capacity to offer competitive compensation, particularly in high-demand career and technical education fields.
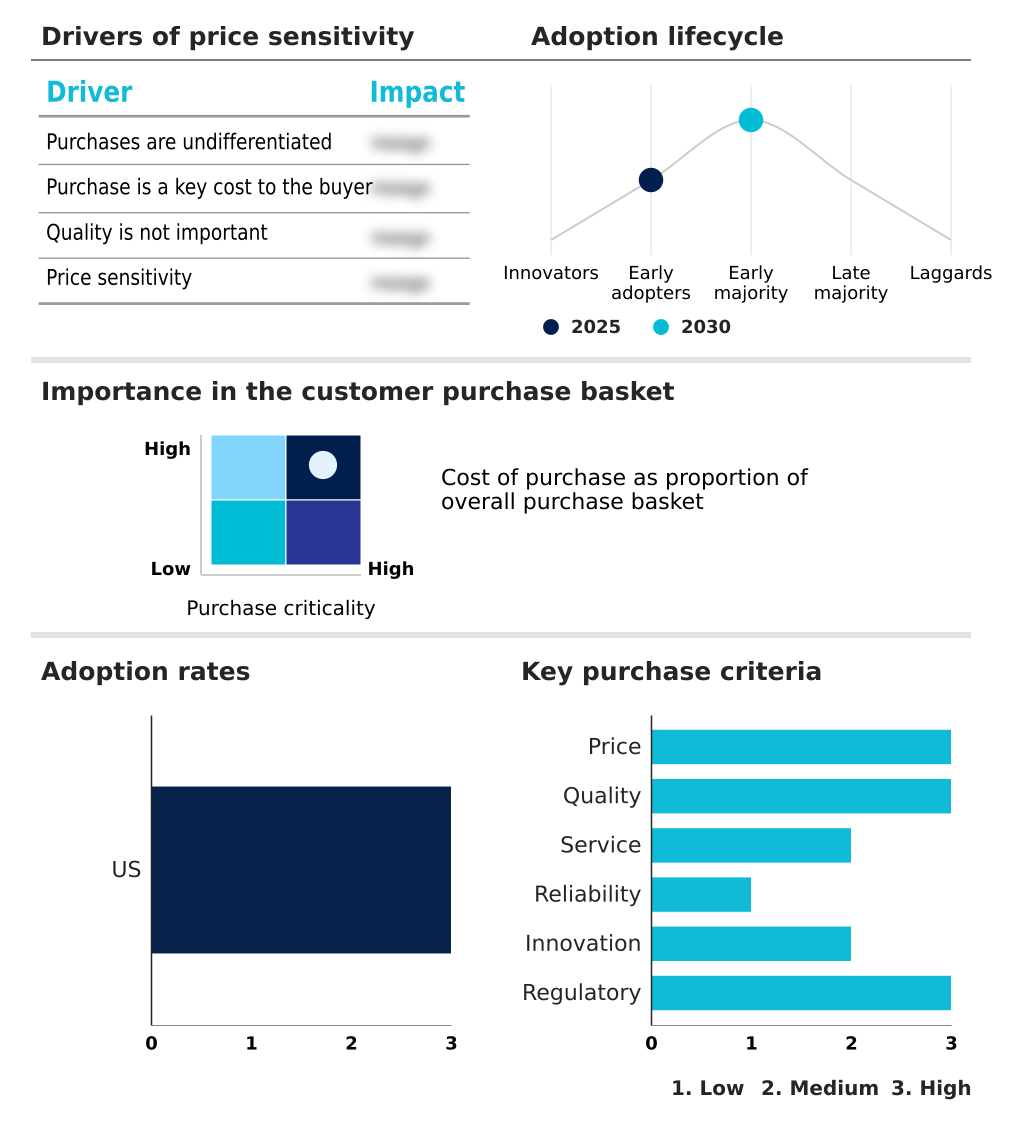
Exclusive Technavio Analysis on Customer Landscape
The us community college market forecasting report includes the adoption lifecycle of the market, covering from the innovator’s stage to the laggard’s stage. It focuses on adoption rates in different regions based on penetration. Furthermore, the us community college market report also includes key purchase criteria and drivers of price sensitivity to help companies evaluate and develop their market growth analysis strategies.
Customer Landscape of US Community College Industry
Competitive Landscape
Companies are implementing various strategies, such as strategic alliances, us community college market forecast, partnerships, mergers and acquisitions, geographical expansion, and product/service launches, to enhance their presence in the industry.
Alaska Vocational Technical Center - Analyzes specialized vocational training programs designed for workforce skill development and immediate entry into technical fields.
The industry research and growth report includes detailed analyses of the competitive landscape of the market and information about key companies, including:
- Alaska Vocational Technical Center
- Central Louisiana Tech Community
- Clackamas Community College
- Cleveland Community College
- College of San Mateo
- De Anza College
- Foothill College
- Garden City Community College
- Glendale Community College
- Lake Area Technical College
- Las Positas College
- Mt. San Antonio College
- NCK Tech.
- North Florida College
- Northeast Community College
- Northwest Iowa Community College
- Pasadena City College
- Saddleback College
- Santa Barbara City College
- Walla Walla Community College
Qualitative and quantitative analysis of companies has been conducted to help clients understand the wider business environment as well as the strengths and weaknesses of key industry players. Data is qualitatively analyzed to categorize companies as pure play, category-focused, industry-focused, and diversified; it is quantitatively analyzed to categorize companies as dominant, leading, strong, tentative, and weak.
Market Intelligence Radar: High-Impact Developments & Growth Signals
- In the Education Services industry, a significant regulatory shift toward performance-based funding models is altering how public funds are allocated, tying a larger portion of community college budgets to specific student success metrics such as completion and transfer rates.
- The widespread adoption of predictive student analytics and AI-powered advising tools is transforming institutional operations, enabling proactive interventions that address student risk factors and support guided pathways models to improve retention.
- A major market trend is the unbundling of traditional degrees into shorter, more flexible non-credit credentialing programs, compelling community colleges to rapidly develop stackable credentials and digital badge systems to compete with alternative online providers.
- There is a growing expectation for institutions to provide comprehensive wraparound support services, addressing non-academic barriers like food and housing insecurity, which is now seen as a critical strategy for improving equity and student persistence.
Dive into Technavio’s robust research methodology, blending expert interviews, extensive data synthesis, and validated models for unparalleled US Community College Market insights. See full methodology.
| Market Scope | |
|---|---|
| Page number | 188 |
| Base year | 2025 |
| Historic period | 2020-2024 |
| Forecast period | 2026-2030 |
| Growth momentum & CAGR | Decelerate at a CAGR of -2.3% |
| Market growth 2026-2030 | USD -6646.8 million |
| Market structure | Fragmented |
| YoY growth 2025-2026(%) | -2.3% |
| Key countries | US |
| Competitive landscape | Leading Companies, Market Positioning of Companies, Competitive Strategies, and Industry Risks |
Research Analyst Overview
- The community college market in US ecosystem, which facilitates over USD 60 billion in educational transactions, is a complex network of stakeholders. The value chain begins with suppliers, including faculty, technology providers of student information systems, and publishers of open educational resources. Community colleges act as the central service providers, transforming these inputs into associate degree pathways and non-credit credentialing.
- This process is governed by regulatory bodies, primarily regional accreditors that enforce program accreditation standards. The output is delivered to students, the primary consumers, and employers, the ultimate end-users of the skilled talent produced.
- Public-private partnerships are a critical enabling component, with industry collaborations now influencing the curriculum design of over 40% of new career and technical education programs, ensuring alignment with current skills gap analysis.
What are the Key Data Covered in this US Community College Market Research and Growth Report?
-
What is the expected growth of the US Community College Market between 2026 and 2030?
-
The US Community College Market is expected to grow by USD 6.65 billion during 2026-2030, registering a CAGR of -2.3%. Year-over-year growth in 2026 is estimated at -2.3%%. This acceleration is shaped by unwavering focus on affordability and financial accessibility, which is intensifying demand across multiple end-use verticals covered in the report.
-
-
What segmentation does the market report cover?
-
The report is segmented by Revenue Stream (Government funds, Tuition and fees, Grants and contracts, and Others), Courses (Associate degree, TVET certification, Continuing education, and Bachelors degree), Delivery Mode (Online, Hybrid, and On-campus) and Geography (North America). Among these, the Government funds segment is estimated to witness significant growth during the forecast period, driven by rising adoption across key application areas. Each segment includes detailed qualitative and quantitative analysis, along with historical data from 2020-2024 and forecasts through 2030 with year-over-year growth rates.
-
-
Which regions are analyzed in the report?
-
The report covers North America. Country-level analysis includes US, with dedicated market size tables and year-over-year growth for each.
-
-
What are the key growth drivers and market challenges?
-
The primary driver is unwavering focus on affordability and financial accessibility, which is accelerating investment and industry demand. The main challenge is navigating unfavorable enrollment patterns and evolving student demographics, creating operational barriers for key market participants. The report quantifies the impact of each driver and challenge across 2026 and 2030 with comparative analysis.
-
-
Who are the major players in the US Community College Market?
-
Key vendors include Alaska Vocational Technical Center, Central Louisiana Tech Community, Clackamas Community College, Cleveland Community College, College of San Mateo, De Anza College, Foothill College, Garden City Community College, Glendale Community College, Lake Area Technical College, Las Positas College, Mt. San Antonio College, NCK Tech., North Florida College, Northeast Community College, Northwest Iowa Community College, Pasadena City College, Saddleback College, Santa Barbara City College and Walla Walla Community College. The report provides qualitative and quantitative analysis categorizing companies as dominant, leading, strong, tentative, and weak based on their market positioning. Company profiles include business segment analysis, SWOT assessment, key offerings, and recent strategic developments.
-
Market Research Insights
- The competitive landscape of the community college market in US is highly fragmented, with the top 20 institutions, including Lake Area Technical College and North Florida College, capturing less than 15% of the total student population.
- In response to intense competition from online universities, leading colleges are heavily investing in student retention analytics, with some reporting a 5% to 10% improvement in student persistence after implementing early-alert systems. These technological investments are a direct reaction to the market need for flexible, high-quality educational pathways.
- For instance, developing robust public-private partnerships allows institutions to secure alternative funding and ensure curriculum relevance. This strategic adaptation is critical as institutions grapple with the challenge of declining state funding while striving to meet the evolving demands of both students and regional employers for advanced workforce development programs.
We can help! Our analysts can customize this us community college market research report to meet your requirements.
 RIA -
RIA - 
