Compensation Software Market Analysis, Size, and Forecast 2026-2030: North America (US, Canada, and Mexico), Europe (Germany, UK, and France), APAC (China, India, and Japan), South America (Brazil and Argentina), Middle East and Africa (South Africa, Saudi Arabia, and UAE), and Rest of World (ROW)

Compensation Software Market Analysis, Size, and Forecast 2026-2030:
North America (US, Canada, and Mexico), Europe (Germany, UK, and France), APAC (China, India, and Japan), South America (Brazil and Argentina), Middle East and Africa (South Africa, Saudi Arabia, and UAE), and Rest of World (ROW)

Published: Mar 2026 292 Pages SKU: IRTNTR73215

Market Overview at a Glance

$2.11 B
Market Opportunity
6.9%
CAGR 2025 - 2030
35.3%
North America Growth
$3.21 B
Large enterprises segment 2024

Compensation Software Market Size 2026-2030

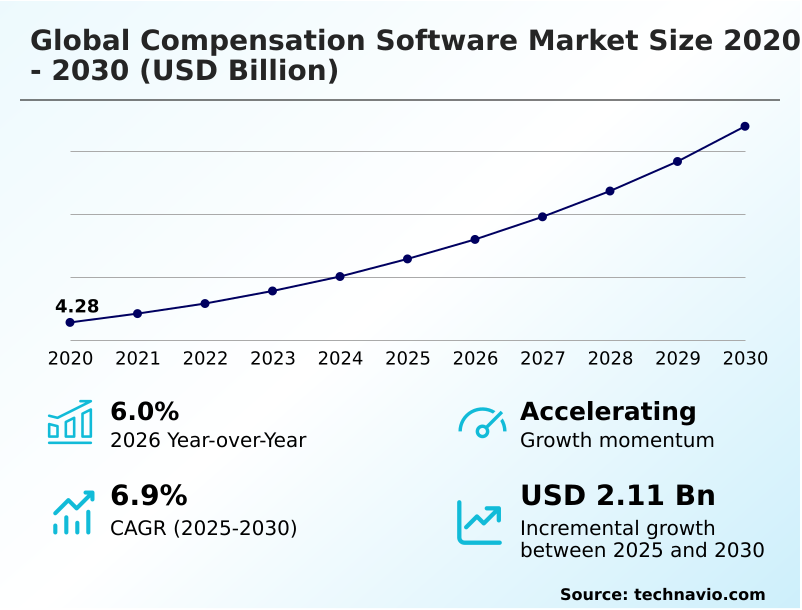
The compensation software market size is valued to increase by USD 2.11 billion, at a CAGR of 6.9% from 2025 to 2030. Adopting pricing strategies of companies in compensation software will drive the compensation software market.

Major Market Trends & Insights

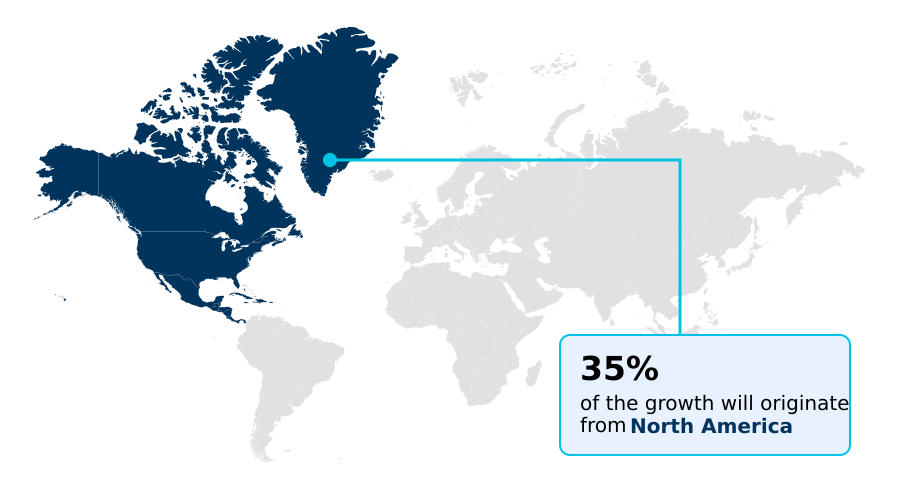
  • North America dominated the market and accounted for a 35.3% growth during the forecast period.
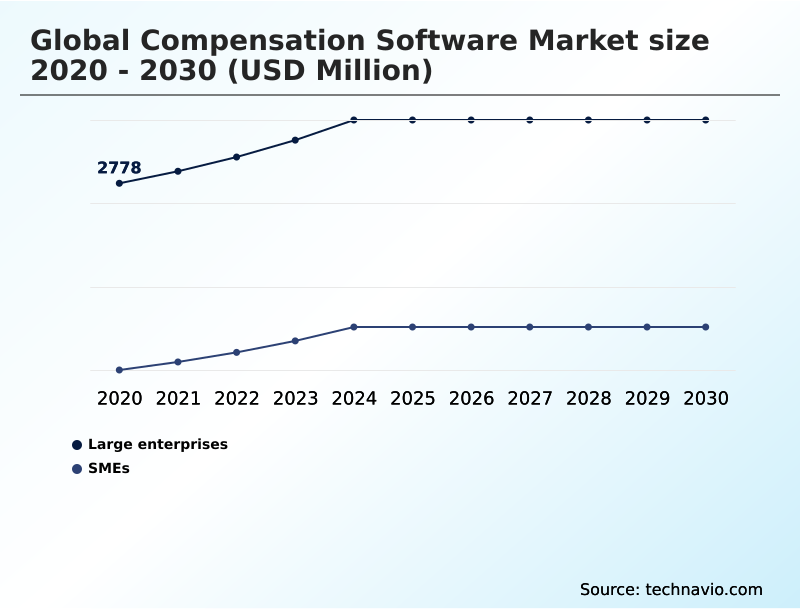
  • By End-user - Large enterprises segment was valued at USD 3.21 billion in 2024
  • By Deployment - Cloud-based segment accounted for the largest market revenue share in 2024

Market Size & Forecast

  • Market Opportunities: USD 3.11 billion
  • Market Future Opportunities: USD 2.11 billion
  • CAGR from 2025 to 2030 : 6.9%

Market Summary

  • The compensation software market is evolving from a transactional administrative tool to a strategic asset for human capital management. A key driver is the increasing demand for automated compensation management to ensure accuracy, efficiency, and governance, especially as organizations expand globally. The adoption of SaaS-based compensation platforms is accelerating, offering scalability and lower upfront costs.
  • For instance, a multinational enterprise can use a unified platform to manage pay transparency regulations across different jurisdictions, running real-time budget simulations to ensure compliance without exceeding financial targets. This capability reduces legal risk and improves employee trust. However, the market faces challenges from high implementation costs and persistent data privacy and security concerns, which can temper adoption rates.
  • Trends such as the integration of AI for predictive analytics, the focus on pay equity auditing, and the need for total rewards communication are reshaping vendor offerings, pushing them toward more intelligent and comprehensive solutions that align compensation with strategic business outcomes.

What will be the Size of the Compensation Software Market during the forecast period?

Get Key Insights on Market Forecast (PDF) Request Free Sample

How is the Compensation Software Market Segmented?

The compensation software industry research report provides comprehensive data (region-wise segment analysis), with forecasts and estimates in "USD million" for the period 2026-2030, as well as historical data from 2020-2024 for the following segments.

  • End-user
    • Large enterprises
    • SMEs
  • Deployment
    • Cloud-based
    • On-premises
  • Application
    • Base pay management
    • Incentive management
    • Equity management
    • Others
  • Geography
    • North America
      • US
      • Canada
      • Mexico
    • Europe
      • Germany
      • UK
      • France
    • APAC
      • China
      • India
      • Japan
    • South America
      • Brazil
      • Argentina
    • Middle East and Africa
      • South Africa
      • Saudi Arabia
      • UAE
    • Rest of World (ROW)

By End-user Insights

The large enterprises segment is estimated to witness significant growth during the forecast period.

Large enterprises represent a dominant share of the compensation software market, driven by the need for centralized data governance across complex global operations.

These organizations require platforms that can handle real-time currency fluctuations and integrate with existing enterprise resource planning (ERP) systems. The adoption of AI-powered compensation analytics helps leadership model various budget scenarios, improving allocation accuracy by over 15%.

Managing long-term incentive plans and ensuring compliance with disparate regulatory requirements, such as pay equity mandates, necessitates sophisticated, secure, and scalable solutions.

A unified data model is essential for predictive analytics, which informs employee retention strategies and aligns total rewards with corporate objectives, making these systems a strategic necessity for maintaining competitive advantage and operational stability in a dynamic talent landscape.

Request Free Sample

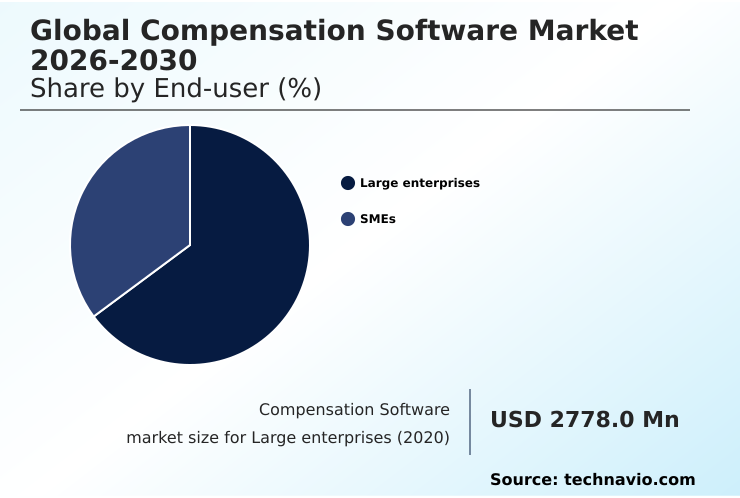
The Large enterprises segment was valued at USD 3.21 billion in 2024 and showed a gradual increase during the forecast period.

Request Free Sample

Regional Analysis

North America is estimated to contribute 35.3% to the growth of the global market during the forecast period.Technavio’s analysts have elaborately explained the regional trends and drivers that shape the market during the forecast period.

See How Compensation Software Market Demand is Rising in North America Request Free Sample

The market's geographic landscape is defined by varying maturity and regulatory pressures. North America leads in adoption, with organizations leveraging sophisticated total rewards communication and compensation planning tools to navigate stringent state-level pay transparency laws.

Firms in this region report a 35% faster audit completion time using automated systems. Europe follows closely, where compliance with cross-border data transfers and EU directives necessitates platforms with strong data governance.

Meanwhile, APAC is the fastest-growing region, where the focus is on standardizing variable pay and bonus management.

The adoption of cloud-based systems in this region has increased by over 50% in recent years as companies seek scalable solutions for managing a mobile workforce and complex localized benefits administration.

Market Dynamics

Our researchers analyzed the data with 2025 as the base year, along with the key drivers, trends, and challenges. A holistic analysis of drivers will help companies refine their marketing strategies to gain a competitive advantage.

  • As organizations seek to optimize their human capital strategies, the effective use of technology becomes paramount. The central question is no longer just about managing payroll but how to automate bonus and incentive calculations to drive performance. For multinational corporations, a key consideration is choosing software for managing global pay equity, which requires robust tools for salary benchmarking and analysis.
  • This ties into the broader challenge of linking performance ratings to compensation in a fair and transparent manner, a task that manual processes cannot handle at scale.
  • The debate over cloud compensation software vs on-premise solutions continues, with cloud adoption growing due to its flexibility, though some sectors still prefer on-premise for its perceived security in managing executive deferred compensation plans. Modern platforms are now essential for tracking and administering long-term incentive programs effectively, as they provide clear visibility into vesting schedules and potential payouts.
  • The ability of a system to streamline the total rewards statement process is a critical differentiator, helping employees understand the full value of their package. Furthermore, advanced software is a key tool to manage pay transparency reporting requirements, reducing compliance risks significantly.
  • Organizations that successfully implement these solutions often see more than a 60% reduction in time spent on compensation cycle administration compared to those relying on spreadsheets. Effectively managing equity awards for startups and creating a competitive salary structure are additional functions that these systems facilitate, ensuring that talent acquisition and retention goals are met.

What are the key market drivers leading to the rise in the adoption of Compensation Software Industry?

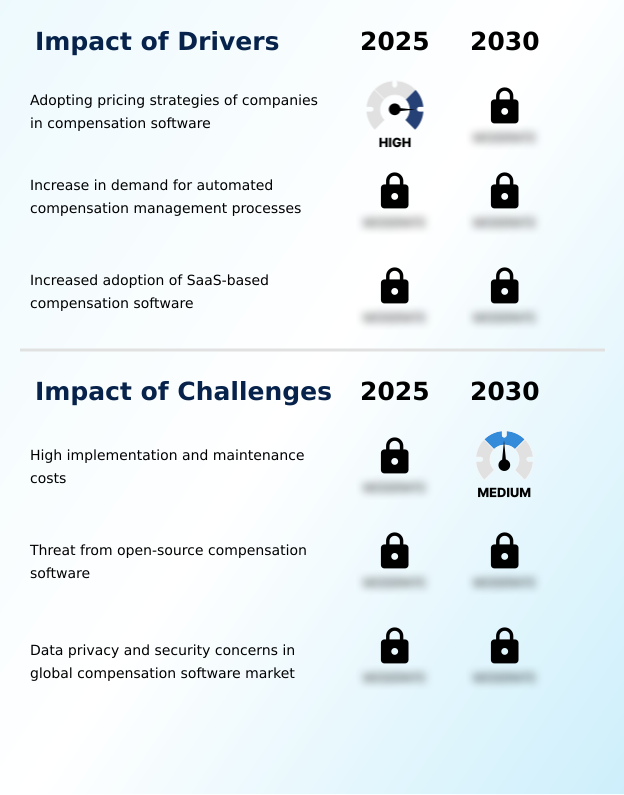
  • The adoption of flexible and evolving pricing strategies by compensation software vendors is a key driver for market growth.

  • Market growth is significantly propelled by the increasing demand for automated compensation management, which addresses the inefficiencies and risks of manual processes.
  • Automation streamlines workflows for base pay management and complex salary structure design, leading to a 90% reduction in calculation errors compared to spreadsheet-based methods.
  • The widespread adoption of SaaS-based compensation models is another primary driver, as it lowers entry barriers for SMEs through flexible pay-per-employee pricing and eliminates the need for on-premise infrastructure.
  • This accessibility has broadened the customer base by over 30% in emerging markets.
  • Additionally, the ability of these cloud platforms to provide real-time budget simulation and facilitate seamless payroll system integration makes them indispensable for agile and data-driven financial planning, solidifying their role as a critical business tool.

What are the market trends shaping the Compensation Software Industry?

  • A key market trend is the increasing demand for integrated Human Capital Management (HCM) solutions. This shift is driven by the organizational need to unify workforce data and streamline HR processes.

  • Key market trends are reshaping compensation management from a back-office function to a strategic driver of talent strategy. The increasing demand for integrated HCM solutions is central to this shift, as organizations aim to eliminate data silos and create a unified view of workforce information.
  • This integration enables a more holistic approach, where performance-linked rewards are directly tied to business outcomes. Systems with embedded pay equity auditing capabilities are becoming standard, with adopters reporting a 40% reduction in time spent on compliance analysis.
  • Furthermore, the rise of digital HR technology is driving the adoption of platforms with advanced real-time analytics dashboards and employee self-service portals, which improve transparency and engagement. Companies utilizing these tools have seen a 15% increase in employee satisfaction scores related to compensation clarity and fairness.

What challenges does the Compensation Software Industry face during its growth?

  • High implementation and maintenance costs represent a significant challenge, restraining broader adoption and affecting industry growth.

  • Despite strong growth drivers, the market faces significant challenges that can restrain adoption, particularly concerning data governance and security. The highly sensitive nature of information stored in these systems, such as details for executive compensation modules and deferred compensation plans, makes them prime targets for cyberattacks.
  • A single data breach can lead to severe financial penalties, with some regulatory fines exceeding those of other IT system breaches by up to 25%. Furthermore, high implementation costs and the complexities of migrating from legacy systems present a major barrier for many organizations.
  • The need for continuous system maintenance and updates to comply with evolving regulations also adds to the total cost of ownership, which can be 15-20% higher than initial projections if not managed properly.

Exclusive Technavio Analysis on Customer Landscape

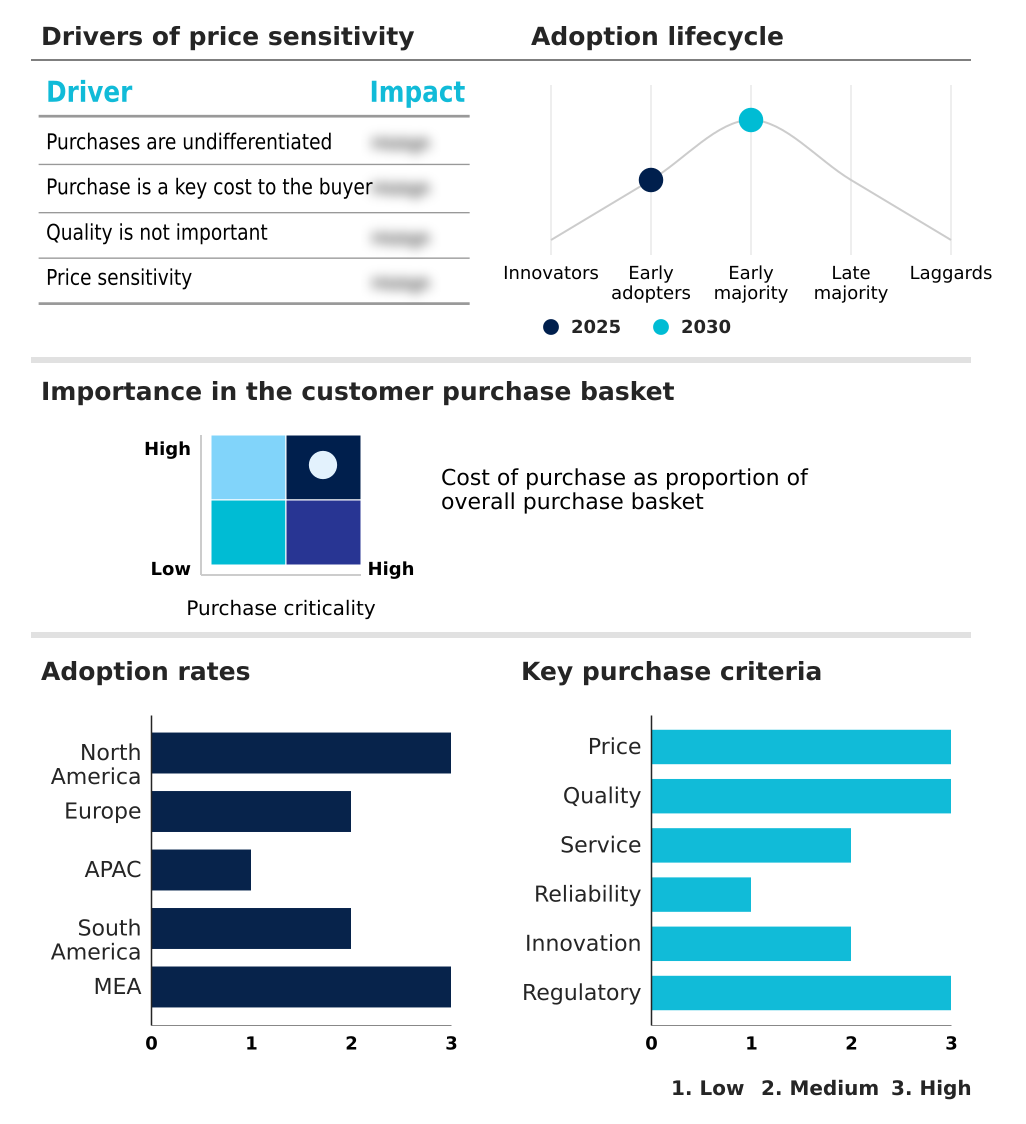
The compensation software market forecasting report includes the adoption lifecycle of the market, covering from the innovator’s stage to the laggard’s stage. It focuses on adoption rates in different regions based on penetration. Furthermore, the compensation software market report also includes key purchase criteria and drivers of price sensitivity to help companies evaluate and develop their market growth analysis strategies.

Customer Landscape of Compensation Software Industry

Competitive Landscape

Companies are implementing various strategies, such as strategic alliances, compensation software market forecast, partnerships, mergers and acquisitions, geographical expansion, and product/service launches, to enhance their presence in the industry.

Automatic Data Processing Inc. - Key offerings focus on automating salary planning, incentive management, and total rewards, providing data-driven tools for strategic compensation decisions and pay equity compliance.

The industry research and growth report includes detailed analyses of the competitive landscape of the market and information about key companies, including:

  • Automatic Data Processing Inc.
  • beqom SA
  • BullseyeEngagement LLC
  • Cegid Group
  • ClearCompany LLC
  • CompLogix
  • CompUp
  • Cornerstone OnDemand Inc.
  • Decusoft Inc.
  • Execupay Inc.
  • Greytip Software Pvt. Ltd.
  • HRSoft
  • JSM Technologies Pvt. Ltd.
  • Nitso Technologies Pvt. Ltd.
  • Paycom Software Inc.
  • Payscale Inc.
  • SAP SE
  • UKG Inc.
  • Workday Inc.

Qualitative and quantitative analysis of companies has been conducted to help clients understand the wider business environment as well as the strengths and weaknesses of key industry players. Data is qualitatively analyzed to categorize companies as pure play, category-focused, industry-focused, and diversified; it is quantitatively analyzed to categorize companies as dominant, leading, strong, tentative, and weak.

Recent Development and News in Compensation software market

  • In October 2024, Paycom Software Inc. announced a strategic partnership with a leading financial services firm to integrate its payroll and compensation modules, enhancing real-time data synchronization for incentive management.
  • In January 2025, beqom SA completed a significant funding round to expand its AI-driven compensation planning and pay equity analysis capabilities, targeting further penetration into the North American market.
  • In February 2025, Workday Inc. integrated a new suite of predictive analytics tools into its platform, designed to forecast the impact of salary adjustments on employee retention rates by simulating various budgetary scenarios.
  • In March 2025, SAP SE introduced an update to its SuccessFactors suite that provides automated auditing tools to ensure adherence to the European Union's Pay Transparency Directive.

Dive into Technavio’s robust research methodology, blending expert interviews, extensive data synthesis, and validated models for unparalleled Compensation Software Market insights. See full methodology.

Market Scope
Page number 292
Base year 2025
Historic period 2020-2024
Forecast period 2026-2030
Growth momentum & CAGR Accelerate at a CAGR of 6.9%
Market growth 2026-2030 USD 2108.9 million
Market structure Fragmented
YoY growth 2025-2026(%) 6.0%
Key countries US, Canada, Mexico, Germany, UK, France, Italy, The Netherlands, Spain, China, India, Japan, Australia, South Korea, Indonesia, Brazil, Argentina, Chile, South Africa, Saudi Arabia, UAE, Egypt and Nigeria
Competitive landscape Leading Companies, Market Positioning of Companies, Competitive Strategies, and Industry Risks

Request Free Sample

Research Analyst Overview

  • The compensation software market has matured from an administrative function to a cornerstone of strategic human capital management. The evolution is marked by a definitive shift toward AI-powered compensation analytics and automated workflows, which are now critical for maintaining competitive and equitable pay structures.
  • Platforms offering merit increase automation and sales incentive management are becoming standard as organizations seek to link pay directly to performance outcomes. A central trend influencing boardroom strategy is the use of AI-driven pay equity auditing to mitigate litigation risks and bolster ESG reporting credentials.
  • This strategic alignment is further supported by solutions for total compensation management and robust payroll system integration, which provide a unified view of labor costs. Implementations focused on incentive management automation have demonstrated a 30% reduction in payout errors, highlighting the tangible ROI.
  • As regulatory pressures mount, features supporting compliance reporting and pay structure design are no longer optional but essential for navigating the complexities of the modern global workforce.

What are the Key Data Covered in this Compensation Software Market Research and Growth Report?

  • What is the expected growth of the Compensation Software Market between 2026 and 2030?

    • USD 2.11 billion, at a CAGR of 6.9%

  • What segmentation does the market report cover?

    • The report is segmented by End-user (Large enterprises, and SMEs), Deployment (Cloud-based, and On-premises), Application (Base pay management, Incentive management, Equity management, and Others) and Geography (North America, Europe, APAC, South America, Middle East and Africa)

  • Which regions are analyzed in the report?

    • North America, Europe, APAC, South America and Middle East and Africa

  • What are the key growth drivers and market challenges?

    • Adopting pricing strategies of companies in compensation software, High implementation and maintenance costs

  • Who are the major players in the Compensation Software Market?

    • Automatic Data Processing Inc., beqom SA, BullseyeEngagement LLC, Cegid Group, ClearCompany LLC, CompLogix, CompUp, Cornerstone OnDemand Inc., Decusoft Inc., Execupay Inc., Greytip Software Pvt. Ltd., HRSoft, JSM Technologies Pvt. Ltd., Nitso Technologies Pvt. Ltd., Paycom Software Inc., Payscale Inc., SAP SE, UKG Inc. and Workday Inc.

Market Research Insights

  • Market dynamics are shifting as organizations prioritize data-driven pay decisions and unified workforce data. The adoption of integrated HCM solutions has proven to reduce payroll processing errors by up to 20%, creating a strong business case for investment. This integration enables a holistic view, connecting performance management with compensation outcomes.
  • Furthermore, the complexity of multi-country payroll has driven demand for platforms that offer centralized control with localized flexibility. Firms that leverage employee self-service portals and real-time analytics dashboards report a 15% improvement in talent retention for critical roles, as transparency in total rewards and performance-linked pay fosters employee trust and engagement.
  • These platforms are becoming crucial for supporting skills-based work models and global business services.

We can help! Our analysts can customize this compensation software market research report to meet your requirements.

Get in touch

1. Executive Summary

1.1 Market overview

Executive Summary - Chart on Market Overview
Executive Summary - Data Table on Market Overview
Executive Summary - Chart on Global Market Characteristics
Executive Summary - Chart on Market by Geography
Executive Summary - Chart on Market Segmentation by End-user
Executive Summary - Chart on Market Segmentation by Deployment
Executive Summary - Chart on Market Segmentation by Application
Executive Summary - Chart on Incremental Growth
Executive Summary - Data Table on Incremental Growth
Executive Summary - Chart on Company Market Positioning

2. Technavio Analysis

2.1 Analysis of price sensitivity, lifecycle, customer purchase basket, adoption rates, and purchase criteria

2.2 Criticality of inputs and Factors of differentiation

Chart on Overview on criticality of inputs and factors of differentiation

2.3 Factors of disruption

Chart on Overview on factors of disruption

2.4 Impact of drivers and challenges

Chart on Impact of drivers and challenges in 2025 and 2030

3. Market Landscape

3.1 Market ecosystem

Chart on Parent Market
Data Table on - Parent Market

3.2 Market characteristics

Chart on Market characteristics analysis

3.3 Value chain analysis

Chart on Value chain analysis

4. Market Sizing

4.1 Market definition

Data Table on Offerings of companies included in the market definition

4.2 Market segment analysis

Market segments

4.3 Market size 2025

4.4 Market outlook: Forecast for 2025-2030

Chart on Global - Market size and forecast 2025-2030 ($ million)
Data Table on Global - Market size and forecast 2025-2030 ($ million)
Chart on Global Market: Year-over-year growth 2025-2030 (%)
Data Table on Global Market: Year-over-year growth 2025-2030 (%)

5. Historic Market Size

5.1 Global Compensation Software Market 2020 - 2024

Historic Market Size - Data Table on Global Compensation Software Market 2020 - 2024 ($ million)

5.2 End-user segment analysis 2020 - 2024

Historic Market Size - End-user Segment 2020 - 2024 ($ million)

5.3 Deployment segment analysis 2020 - 2024

Historic Market Size - Deployment Segment 2020 - 2024 ($ million)

5.4 Application segment analysis 2020 - 2024

Historic Market Size - Application Segment 2020 - 2024 ($ million)

5.5 Geography segment analysis 2020 - 2024

Historic Market Size - Geography Segment 2020 - 2024 ($ million)

5.6 Country segment analysis 2020 - 2024

Historic Market Size - Country Segment 2020 - 2024 ($ million)

6. Qualitative Analysis

6.1 The Impact of AI on Global Compensation Software Market

7. Five Forces Analysis

7.1 Five forces summary

Five forces analysis - Comparison between 2025 and 2030

7.2 Bargaining power of buyers

Bargaining power of buyers - Impact of key factors 2025 and 2030

7.3 Bargaining power of suppliers

Bargaining power of suppliers - Impact of key factors in 2025 and 2030

7.4 Threat of new entrants

Threat of new entrants - Impact of key factors in 2025 and 2030

7.5 Threat of substitutes

Threat of substitutes - Impact of key factors in 2025 and 2030

7.6 Threat of rivalry

Threat of rivalry - Impact of key factors in 2025 and 2030

7.7 Market condition

Chart on Market condition - Five forces 2025 and 2030

8. Market Segmentation by End-user

8.1 Market segments

Chart on End-user - Market share 2025-2030 (%)
Data Table on End-user - Market share 2025-2030 (%)

8.2 Comparison by End-user

Chart on Comparison by End-user
Data Table on Comparison by End-user

8.3 Large enterprises - Market size and forecast 2025-2030

Chart on Large enterprises - Market size and forecast 2025-2030 ($ million)
Data Table on Large enterprises - Market size and forecast 2025-2030 ($ million)
Chart on Large enterprises - Year-over-year growth 2025-2030 (%)
Data Table on Large enterprises - Year-over-year growth 2025-2030 (%)

8.4 SMEs - Market size and forecast 2025-2030

Chart on SMEs - Market size and forecast 2025-2030 ($ million)
Data Table on SMEs - Market size and forecast 2025-2030 ($ million)
Chart on SMEs - Year-over-year growth 2025-2030 (%)
Data Table on SMEs - Year-over-year growth 2025-2030 (%)

8.5 Market opportunity by End-user

Market opportunity by End-user ($ million)
Data Table on Market opportunity by End-user ($ million)

9. Market Segmentation by Deployment

9.1 Market segments

Chart on Deployment - Market share 2025-2030 (%)
Data Table on Deployment - Market share 2025-2030 (%)

9.2 Comparison by Deployment

Chart on Comparison by Deployment
Data Table on Comparison by Deployment

9.3 Cloud-based - Market size and forecast 2025-2030

Chart on Cloud-based - Market size and forecast 2025-2030 ($ million)
Data Table on Cloud-based - Market size and forecast 2025-2030 ($ million)
Chart on Cloud-based - Year-over-year growth 2025-2030 (%)
Data Table on Cloud-based - Year-over-year growth 2025-2030 (%)

9.4 On-premises - Market size and forecast 2025-2030

Chart on On-premises - Market size and forecast 2025-2030 ($ million)
Data Table on On-premises - Market size and forecast 2025-2030 ($ million)
Chart on On-premises - Year-over-year growth 2025-2030 (%)
Data Table on On-premises - Year-over-year growth 2025-2030 (%)

9.5 Market opportunity by Deployment

Market opportunity by Deployment ($ million)
Data Table on Market opportunity by Deployment ($ million)

10. Market Segmentation by Application

10.1 Market segments

Chart on Application - Market share 2025-2030 (%)
Data Table on Application - Market share 2025-2030 (%)

10.2 Comparison by Application

Chart on Comparison by Application
Data Table on Comparison by Application

10.3 Base pay management - Market size and forecast 2025-2030

Chart on Base pay management - Market size and forecast 2025-2030 ($ million)
Data Table on Base pay management - Market size and forecast 2025-2030 ($ million)
Chart on Base pay management - Year-over-year growth 2025-2030 (%)
Data Table on Base pay management - Year-over-year growth 2025-2030 (%)

10.4 Incentive management - Market size and forecast 2025-2030

Chart on Incentive management - Market size and forecast 2025-2030 ($ million)
Data Table on Incentive management - Market size and forecast 2025-2030 ($ million)
Chart on Incentive management - Year-over-year growth 2025-2030 (%)
Data Table on Incentive management - Year-over-year growth 2025-2030 (%)

10.5 Equity management - Market size and forecast 2025-2030

Chart on Equity management - Market size and forecast 2025-2030 ($ million)
Data Table on Equity management - Market size and forecast 2025-2030 ($ million)
Chart on Equity management - Year-over-year growth 2025-2030 (%)
Data Table on Equity management - Year-over-year growth 2025-2030 (%)

10.6 Others - Market size and forecast 2025-2030

Chart on Others - Market size and forecast 2025-2030 ($ million)
Data Table on Others - Market size and forecast 2025-2030 ($ million)
Chart on Others - Year-over-year growth 2025-2030 (%)
Data Table on Others - Year-over-year growth 2025-2030 (%)

10.7 Market opportunity by Application

Market opportunity by Application ($ million)
Data Table on Market opportunity by Application ($ million)

11. Customer Landscape

11.1 Customer landscape overview

Analysis of price sensitivity, lifecycle, customer purchase basket, adoption rates, and purchase criteria

12. Geographic Landscape

12.1 Geographic segmentation

Chart on Market share by geography 2025-2030 (%)
Data Table on Market share by geography 2025-2030 (%)

12.2 Geographic comparison

Chart on Geographic comparison
Data Table on Geographic comparison

12.3 North America - Market size and forecast 2025-2030

Chart on North America - Market size and forecast 2025-2030 ($ million)
Data Table on North America - Market size and forecast 2025-2030 ($ million)
Chart on North America - Year-over-year growth 2025-2030 (%)
Data Table on North America - Year-over-year growth 2025-2030 (%)
Chart on Regional Comparison - North America
Data Table on Regional Comparison - North America

12.3.1 US - Market size and forecast 2025-2030

Chart on US - Market size and forecast 2025-2030 ($ million)
Data Table on US - Market size and forecast 2025-2030 ($ million)
Chart on US - Year-over-year growth 2025-2030 (%)
Data Table on US - Year-over-year growth 2025-2030 (%)

12.3.2 Canada - Market size and forecast 2025-2030

Chart on Canada - Market size and forecast 2025-2030 ($ million)
Data Table on Canada - Market size and forecast 2025-2030 ($ million)
Chart on Canada - Year-over-year growth 2025-2030 (%)
Data Table on Canada - Year-over-year growth 2025-2030 (%)

12.3.3 Mexico - Market size and forecast 2025-2030

Chart on Mexico - Market size and forecast 2025-2030 ($ million)
Data Table on Mexico - Market size and forecast 2025-2030 ($ million)
Chart on Mexico - Year-over-year growth 2025-2030 (%)
Data Table on Mexico - Year-over-year growth 2025-2030 (%)

12.4 Europe - Market size and forecast 2025-2030

Chart on Europe - Market size and forecast 2025-2030 ($ million)
Data Table on Europe - Market size and forecast 2025-2030 ($ million)
Chart on Europe - Year-over-year growth 2025-2030 (%)
Data Table on Europe - Year-over-year growth 2025-2030 (%)
Chart on Regional Comparison - Europe
Data Table on Regional Comparison - Europe

12.4.1 Germany - Market size and forecast 2025-2030

Chart on Germany - Market size and forecast 2025-2030 ($ million)
Data Table on Germany - Market size and forecast 2025-2030 ($ million)
Chart on Germany - Year-over-year growth 2025-2030 (%)
Data Table on Germany - Year-over-year growth 2025-2030 (%)

12.4.2 UK - Market size and forecast 2025-2030

Chart on UK - Market size and forecast 2025-2030 ($ million)
Data Table on UK - Market size and forecast 2025-2030 ($ million)
Chart on UK - Year-over-year growth 2025-2030 (%)
Data Table on UK - Year-over-year growth 2025-2030 (%)

12.4.3 France - Market size and forecast 2025-2030

Chart on France - Market size and forecast 2025-2030 ($ million)
Data Table on France - Market size and forecast 2025-2030 ($ million)
Chart on France - Year-over-year growth 2025-2030 (%)
Data Table on France - Year-over-year growth 2025-2030 (%)

12.4.4 Italy - Market size and forecast 2025-2030

Chart on Italy - Market size and forecast 2025-2030 ($ million)
Data Table on Italy - Market size and forecast 2025-2030 ($ million)
Chart on Italy - Year-over-year growth 2025-2030 (%)
Data Table on Italy - Year-over-year growth 2025-2030 (%)

12.4.5 The Netherlands - Market size and forecast 2025-2030

Chart on The Netherlands - Market size and forecast 2025-2030 ($ million)
Data Table on The Netherlands - Market size and forecast 2025-2030 ($ million)
Chart on The Netherlands - Year-over-year growth 2025-2030 (%)
Data Table on The Netherlands - Year-over-year growth 2025-2030 (%)

12.4.6 Spain - Market size and forecast 2025-2030

Chart on Spain - Market size and forecast 2025-2030 ($ million)
Data Table on Spain - Market size and forecast 2025-2030 ($ million)
Chart on Spain - Year-over-year growth 2025-2030 (%)
Data Table on Spain - Year-over-year growth 2025-2030 (%)

12.5 APAC - Market size and forecast 2025-2030

Chart on APAC - Market size and forecast 2025-2030 ($ million)
Data Table on APAC - Market size and forecast 2025-2030 ($ million)
Chart on APAC - Year-over-year growth 2025-2030 (%)
Data Table on APAC - Year-over-year growth 2025-2030 (%)
Chart on Regional Comparison - APAC
Data Table on Regional Comparison - APAC

12.5.1 China - Market size and forecast 2025-2030

Chart on China - Market size and forecast 2025-2030 ($ million)
Data Table on China - Market size and forecast 2025-2030 ($ million)
Chart on China - Year-over-year growth 2025-2030 (%)
Data Table on China - Year-over-year growth 2025-2030 (%)

12.5.2 India - Market size and forecast 2025-2030

Chart on India - Market size and forecast 2025-2030 ($ million)
Data Table on India - Market size and forecast 2025-2030 ($ million)
Chart on India - Year-over-year growth 2025-2030 (%)
Data Table on India - Year-over-year growth 2025-2030 (%)

12.5.3 Japan - Market size and forecast 2025-2030

Chart on Japan - Market size and forecast 2025-2030 ($ million)
Data Table on Japan - Market size and forecast 2025-2030 ($ million)
Chart on Japan - Year-over-year growth 2025-2030 (%)
Data Table on Japan - Year-over-year growth 2025-2030 (%)

12.5.4 Australia - Market size and forecast 2025-2030

Chart on Australia - Market size and forecast 2025-2030 ($ million)
Data Table on Australia - Market size and forecast 2025-2030 ($ million)
Chart on Australia - Year-over-year growth 2025-2030 (%)
Data Table on Australia - Year-over-year growth 2025-2030 (%)

12.5.5 South Korea - Market size and forecast 2025-2030

Chart on South Korea - Market size and forecast 2025-2030 ($ million)
Data Table on South Korea - Market size and forecast 2025-2030 ($ million)
Chart on South Korea - Year-over-year growth 2025-2030 (%)
Data Table on South Korea - Year-over-year growth 2025-2030 (%)

12.5.6 Indonesia - Market size and forecast 2025-2030

Chart on Indonesia - Market size and forecast 2025-2030 ($ million)
Data Table on Indonesia - Market size and forecast 2025-2030 ($ million)
Chart on Indonesia - Year-over-year growth 2025-2030 (%)
Data Table on Indonesia - Year-over-year growth 2025-2030 (%)

12.6 South America - Market size and forecast 2025-2030

Chart on South America - Market size and forecast 2025-2030 ($ million)
Data Table on South America - Market size and forecast 2025-2030 ($ million)
Chart on South America - Year-over-year growth 2025-2030 (%)
Data Table on South America - Year-over-year growth 2025-2030 (%)
Chart on Regional Comparison - South America
Data Table on Regional Comparison - South America

12.6.1 Brazil - Market size and forecast 2025-2030

Chart on Brazil - Market size and forecast 2025-2030 ($ million)
Data Table on Brazil - Market size and forecast 2025-2030 ($ million)
Chart on Brazil - Year-over-year growth 2025-2030 (%)
Data Table on Brazil - Year-over-year growth 2025-2030 (%)

12.6.2 Argentina - Market size and forecast 2025-2030

Chart on Argentina - Market size and forecast 2025-2030 ($ million)
Data Table on Argentina - Market size and forecast 2025-2030 ($ million)
Chart on Argentina - Year-over-year growth 2025-2030 (%)
Data Table on Argentina - Year-over-year growth 2025-2030 (%)

12.6.3 Chile - Market size and forecast 2025-2030

Chart on Chile - Market size and forecast 2025-2030 ($ million)
Data Table on Chile - Market size and forecast 2025-2030 ($ million)
Chart on Chile - Year-over-year growth 2025-2030 (%)
Data Table on Chile - Year-over-year growth 2025-2030 (%)

12.7 Middle East and Africa - Market size and forecast 2025-2030

Chart on Middle East and Africa - Market size and forecast 2025-2030 ($ million)
Data Table on Middle East and Africa - Market size and forecast 2025-2030 ($ million)
Chart on Middle East and Africa - Year-over-year growth 2025-2030 (%)
Data Table on Middle East and Africa - Year-over-year growth 2025-2030 (%)
Chart on Regional Comparison - Middle East and Africa
Data Table on Regional Comparison - Middle East and Africa

12.7.1 South Africa - Market size and forecast 2025-2030

Chart on South Africa - Market size and forecast 2025-2030 ($ million)
Data Table on South Africa - Market size and forecast 2025-2030 ($ million)
Chart on South Africa - Year-over-year growth 2025-2030 (%)
Data Table on South Africa - Year-over-year growth 2025-2030 (%)

12.7.2 Saudi Arabia - Market size and forecast 2025-2030

Chart on Saudi Arabia - Market size and forecast 2025-2030 ($ million)
Data Table on Saudi Arabia - Market size and forecast 2025-2030 ($ million)
Chart on Saudi Arabia - Year-over-year growth 2025-2030 (%)
Data Table on Saudi Arabia - Year-over-year growth 2025-2030 (%)

12.7.3 UAE - Market size and forecast 2025-2030

Chart on UAE - Market size and forecast 2025-2030 ($ million)
Data Table on UAE - Market size and forecast 2025-2030 ($ million)
Chart on UAE - Year-over-year growth 2025-2030 (%)
Data Table on UAE - Year-over-year growth 2025-2030 (%)

12.7.4 Egypt - Market size and forecast 2025-2030

Chart on Egypt - Market size and forecast 2025-2030 ($ million)
Data Table on Egypt - Market size and forecast 2025-2030 ($ million)
Chart on Egypt - Year-over-year growth 2025-2030 (%)
Data Table on Egypt - Year-over-year growth 2025-2030 (%)

12.7.5 Nigeria - Market size and forecast 2025-2030

Chart on Nigeria - Market size and forecast 2025-2030 ($ million)
Data Table on Nigeria - Market size and forecast 2025-2030 ($ million)
Chart on Nigeria - Year-over-year growth 2025-2030 (%)
Data Table on Nigeria - Year-over-year growth 2025-2030 (%)

12.8 Market opportunity by geography

Market opportunity by geography ($ million)
Data Tables on Market opportunity by geography ($ million)

13. Drivers, Challenges, and Opportunity

13.1 Market drivers

Adopting pricing strategies of companies in compensation software
Increase in demand for automated compensation management processes
Increased adoption of SaaS-based compensation software

13.2 Market challenges

High implementation and maintenance costs
Threat from open-source compensation software
Data privacy and security concerns in global compensation software market

13.3 Impact of drivers and challenges

Impact of drivers and challenges in 2025 and 2030

13.4 Market opportunities

Growing demand for integrated HCM solutions
Rise of multi-country and centralized outsourcing models
Increasing adoption of digital HR technology

14. Competitive Landscape

14.1 Overview

14.2

Overview on criticality of inputs and factors of differentiation

14.3 Landscape disruption

Overview on factors of disruption

14.4 Industry risks

Impact of key risks on business

15. Competitive Analysis

15.1 Companies profiled

Companies covered

15.2 Company ranking index

15.3 Market positioning of companies

Matrix on companies position and classification

15.4 Automatic Data Processing Inc.

Automatic Data Processing Inc. - Overview
Automatic Data Processing Inc. - Business segments
Automatic Data Processing Inc. - Key news
Automatic Data Processing Inc. - Key offerings
Automatic Data Processing Inc. - Segment focus
SWOT

15.5 beqom SA

beqom SA - Overview
beqom SA - Product / Service
beqom SA - Key offerings
SWOT

15.6 BullseyeEngagement LLC

BullseyeEngagement LLC - Overview
BullseyeEngagement LLC - Product / Service
BullseyeEngagement LLC - Key offerings
SWOT

15.7 Cegid Group

Cegid Group - Overview
Cegid Group - Product / Service
Cegid Group - Key offerings
SWOT

15.8 ClearCompany LLC

ClearCompany LLC - Overview
ClearCompany LLC - Product / Service
ClearCompany LLC - Key offerings
SWOT

15.9 Cornerstone OnDemand Inc.

Cornerstone OnDemand Inc. - Overview
Cornerstone OnDemand Inc. - Product / Service
Cornerstone OnDemand Inc. - Key news
Cornerstone OnDemand Inc. - Key offerings
SWOT

15.10 Decusoft Inc.

Decusoft Inc. - Overview
Decusoft Inc. - Product / Service
Decusoft Inc. - Key offerings
SWOT

15.11 Execupay Inc.

Execupay Inc. - Overview
Execupay Inc. - Product / Service
Execupay Inc. - Key offerings
SWOT

15.12 Greytip Software Pvt. Ltd.

Greytip Software Pvt. Ltd. - Overview
Greytip Software Pvt. Ltd. - Product / Service
Greytip Software Pvt. Ltd. - Key offerings
SWOT

15.13 HRSoft

HRSoft - Overview
HRSoft - Product / Service
HRSoft - Key offerings
SWOT

15.14 JSM Technologies Pvt. Ltd.

JSM Technologies Pvt. Ltd. - Overview
JSM Technologies Pvt. Ltd. - Product / Service
JSM Technologies Pvt. Ltd. - Key offerings
SWOT

15.15 Paycom Software Inc.

Paycom Software Inc. - Overview
Paycom Software Inc. - Product / Service
Paycom Software Inc. - Key offerings
SWOT

15.16 SAP SE

SAP SE - Overview
SAP SE - Business segments
SAP SE - Key news
SAP SE - Key offerings
SAP SE - Segment focus
SWOT

15.17 UKG Inc.

UKG Inc. - Overview
UKG Inc. - Product / Service
UKG Inc. - Key offerings
SWOT

15.18 Workday Inc.

Workday Inc. - Overview
Workday Inc. - Product / Service
Workday Inc. - Key news
Workday Inc. - Key offerings
SWOT

16. Appendix

16.1 Scope of the report

Market definition
Objectives
Notes and caveats

16.2 Inclusions and exclusions checklist

Inclusions checklist
Exclusions checklist

16.3 Currency conversion rates for US$

16.4 Research methodology

16.5 Data procurement

Information sources

16.6 Data validation

16.7 Validation techniques employed for market sizing

16.8 Data synthesis

16.9 360 degree market analysis

16.10 List of abbreviations

Research Methodology

Technavio presents a detailed picture of the market by way of study, synthesis, and summation of data from multiple sources. The analysts have presented the various facets of the market with a particular focus on identifying the key industry influencers. The data thus presented is comprehensive, reliable, and the result of extensive research, both primary and secondary.

INFORMATION SOURCES

Primary sources

  • Manufacturers and suppliers
  • Channel partners
  • Industry experts
  • Strategic decision makers

Secondary sources

  • Industry journals and periodicals
  • Government data
  • Financial reports of key industry players
  • Historical data
  • Press releases

DATA ANALYSIS

Data Synthesis

  • Collation of data
  • Estimation of key figures
  • Analysis of derived insights

Data Validation

  • Triangulation with data models
  • Reference against proprietary databases
  • Corroboration with industry experts

REPORT WRITING

Qualitative

  • Market drivers
  • Market challenges
  • Market trends
  • Five forces analysis

Quantitative

  • Market size and forecast
  • Market segmentation
  • Geographical insights
  • Competitive landscape

Interested in this report?

Get your sample now to see our research methodology and insights!

Download Now

Frequently Asked Questions

Compensation Software market growth will increase by USD 2108.9 million during 2026-2030.

The Compensation Software market is expected to grow at a CAGR of 6.9% during 2026-2030.

Compensation Software market is segmented by End-user (Large enterprises, SMEs) Deployment (Cloud-based, On-premises) Application (Base pay management, Incentive management, Equity management, Others)

Automatic Data Processing Inc., beqom SA, BullseyeEngagement LLC, Cegid Group, ClearCompany LLC, CompLogix, CompUp, Cornerstone OnDemand Inc., Decusoft Inc., Execupay Inc., Greytip Software Pvt. Ltd., HRSoft, JSM Technologies Pvt. Ltd., Nitso Technologies Pvt. Ltd., Paycom Software Inc., Payscale Inc., SAP SE, UKG Inc., Workday Inc. are a few of the key vendors in the Compensation Software market.

North America will register the highest growth rate of 35.3% among the other regions. Therefore, the Compensation Software market in North America is expected to garner significant business opportunities for the vendors during the forecast period.

US, Canada, Mexico, Germany, UK, France, Italy, The Netherlands, Spain, China, India, Japan, Australia, South Korea, Indonesia, Brazil, Argentina, Chile, South Africa, Saudi Arabia, UAE, Egypt, Nigeria

  • Adopting pricing strategies of companies in compensation software is the driving factor this market.

The Compensation Software market vendors should focus on grabbing business opportunities from the End-user segment as it accounted for the largest market share in the base year.
RIA - Research AI Assistant
Ask RIA