
Compressor Oil Market Analysis, Size, and Forecast 2026-2030: APAC (China, Japan, and India), North America (US, Canada, and Mexico), Europe (Germany, UK, and France), Middle East and Africa (Saudi Arabia, UAE, and South Africa), South America (Brazil, Argentina, and Chile), and Rest of World (ROW)

Compressor Oil Market Analysis, Size, and Forecast 2026-2030:
APAC (China, Japan, and India), North America (US, Canada, and Mexico), Europe (Germany, UK, and France), Middle East and Africa (Saudi Arabia, UAE, and South Africa), South America (Brazil, Argentina, and Chile), and Rest of World (ROW)

Published: Oct 2026 318 Pages SKU: IRTNTR45117

Market Overview at a Glance

$1.69 B
Market Opportunity
5.3%
CAGR 2025 - 2030
48%
APAC Growth
$4.25 B
Mineral-base segment 2024

Compressor Oil Market Size 2026-2030

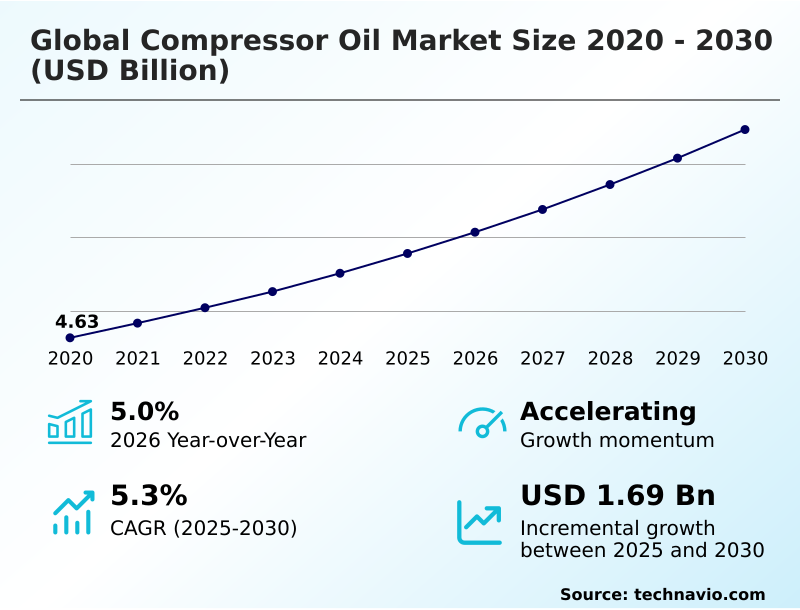
The compressor oil market size is valued to increase by USD 1.69 billion, at a CAGR of 5.3% from 2025 to 2030. Rapid industrialization in emerging economies will drive the compressor oil market.

Major Market Trends & Insights

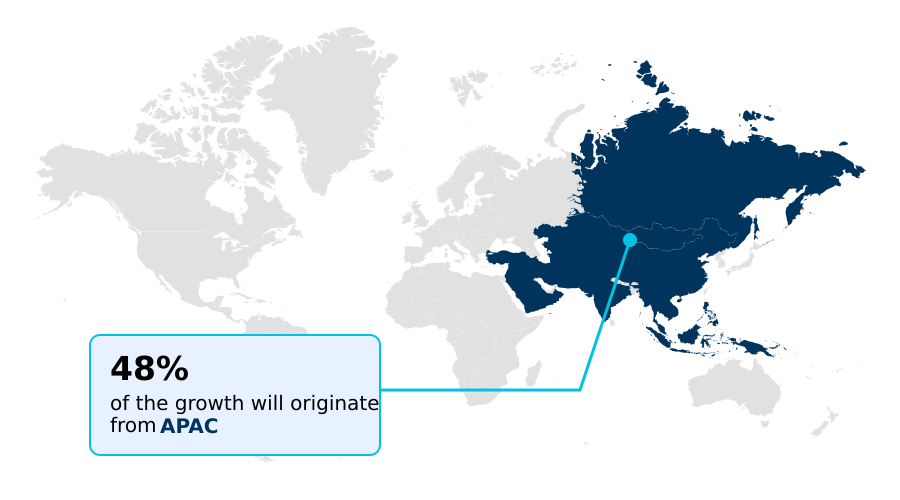
  • APAC dominated the market and accounted for a 48% growth during the forecast period.
  • By Type - Mineral-base segment was valued at USD 4.25 billion in 2024
  • By Application - Positive displacement compressor segment accounted for the largest market revenue share in 2024

Market Size & Forecast

  • Market Opportunities: USD 2.84 billion
  • Market Future Opportunities: USD 1.69 billion
  • CAGR from 2025 to 2030 : 5.3%

Market Summary

  • The compressor oil market is characterized by increasing demand for high-efficiency lubrication solutions across industrial manufacturing and energy sectors. Rapid industrialization in emerging economies drives this expansion, as new production facilities require extensive compressed air systems, causing an immediate rise in the consumption of specialized maintenance fluids.
  • Conversely, raw material price volatility poses a structural challenge, as fluctuating costs for petroleum-derived base stocks directly squeeze manufacturing margins and complicate long-term procurement contracts. In a practical supply chain scenario, automated automotive assembly plants implement condition-based monitoring to track lubricant viscosity and thermal breakdown in real-time.
  • This proactive fluid management strategy allows facility operators to achieve a 20% reduction in unplanned equipment downtime compared to reactive maintenance schedules. By optimizing lubrication intervals, industrial operators significantly enhance machinery lifespan and lower operational overhead. As manufacturing environments grow increasingly complex, the reliance on advanced synthetic formulations continues to accelerate, ensuring stable pneumatic performance under extreme industrial conditions.

What will be the Size of the Compressor Oil Market during the forecast period?
Get Key Insights on Market Forecast (PDF) Get Free Sample

How is the Compressor Oil Market Segmented?

The compressor oil industry research report provides comprehensive data (region-wise segment analysis), with forecasts and estimates in "USD million" for the period 2026-2030, as well as historical data from 2020-2024 for the following segments.

  • Type
    • Mineral-base
    • Synthetic-base
    • Bio-based
  • Application
    • Positive displacement compressor
    • Dynamic compressor
  • End-user
    • Industrial machinery
    • Automotive
    • Oil and gas
    • Power
    • Others
  • Geography
    • APAC
      • China
      • Japan
      • India
      • South Korea
      • Australia
      • Indonesia
    • North America
      • US
      • Canada
      • Mexico
    • Europe
      • Germany
      • UK
      • France
      • Italy
      • Spain
      • The Netherlands
    • Middle East and Africa
      • Saudi Arabia
      • UAE
      • South Africa
      • Israel
      • Turkey
    • South America
      • Brazil
      • Argentina
      • Chile

By Type Insights

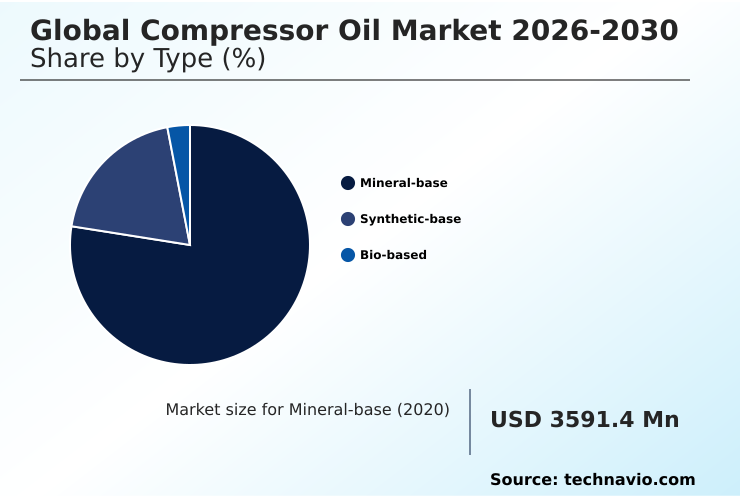
The mineral-base segment is estimated to witness significant growth during the forecast period.

Mineral-based compressor oil solutions continue to capture significant industrial volume due to their proven compatibility with standard operational parameters.

The foundation of these fluids relies on refined hydrocarbon molecules and a stable base stock, which together maintain optimal kinematic viscosity across varying operational states.

Industrial pneumatic systems utilize this lubricity to protect components during high pressure compression and continuous duty cycles. This configuration ensures consistent load carrying capacity, directly contributing to a 15% improvement in mechanical fault prevention compared to untreated systems.

As shear stability remains critical, bearing lubrication applications benefit from reduced metal-on-metal friction.

These inherent physical properties cause a measurable reduction in component wear, driving prolonged machinery lifespan in environments that do not require specialized synthetic intervention, thus stabilizing operational budgets.
Get Free Sample

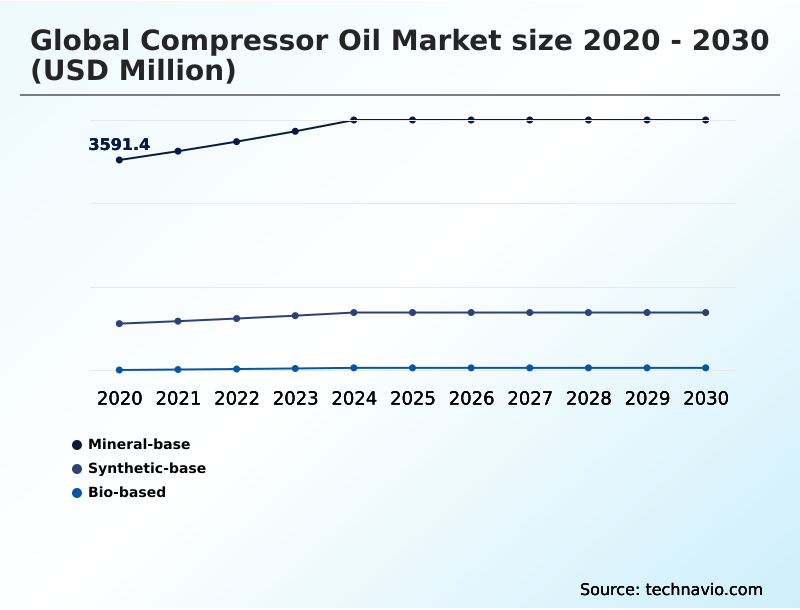
The Mineral-base segment was valued at USD 4.25 billion in 2024 and showed a gradual increase during the forecast period.
Get Free Sample

Regional Analysis

APAC is estimated to contribute 48% to the growth of the global market during the forecast period.Technavio’s analysts have elaborately explained the regional trends and drivers that shape the market during the forecast period.
See How Compressor Oil Market Demand is Rising in APAC Get Free Sample

The geographic landscape of the global compressor oil market reveals distinct operational priorities between APAC and Europe.

APAC demonstrates rapid adoption of high-capacity centrifugal compressor networks due to expanding heavy manufacturing, resulting in a 35% higher regional consumption rate of performance lubricants compared to European facilities.

In contrast, European operators prioritize extreme temperature tolerance and environmental compliance, integrating advanced scroll compressor tech to achieve a 20% improvement in energy conservation.

This regional divergence stems from differing regulatory frameworks, as European facilities demand superior moisture resistance and foam suppression to meet stringent operational mandates, while APAC focuses heavily on scale and output.

To maintain reliability across varying climates, operators utilize precise pour point specifications and corrosion inhibitors, directly reducing mechanical failure rates by 18%.

By adapting seal compatibility protocols and fluid formulations, industrial supply chains effectively manage localized operational stresses, ensuring uninterrupted pneumatic performance.

Market Dynamics

Our researchers analyzed the data with 2025 as the base year, along with the key drivers, trends, and challenges. A holistic analysis of drivers will help companies refine their marketing strategies to gain a competitive advantage.

  • Industrial operators are increasingly refining their maintenance strategies to maximize equipment reliability and minimize operational disruptions across complex manufacturing environments. Implementing high temperature rotary screw lubrication protocols allows facilities to sustain continuous pneumatic output without experiencing premature fluid breakdown. This proactive approach to thermal management directly enhances supply chain predictability by preventing sudden mechanical failures that halt production lines.
  • Furthermore, strict adherence to food grade compressor fluid compliance ensures that processing plants avoid cross-contamination, protecting brand integrity and fulfilling rigorous regulatory mandates. When organizations evaluate fluid options, analyzing polyalphaolefin base stock performance metrics reveals that premium synthetic formulations deliver a 25% longer operational lifespan compared to conventional mineral alternatives.
  • This longevity translates into significant procurement savings and reduced hazardous waste generation over the equipment's lifecycle. To further streamline operations, plant managers emphasize industrial pneumatic system efficiency optimization, identifying friction points and adjusting lubrication schedules to lower overall energy consumption. Additionally, applying centrifugal compressor thermal stability enhancement techniques mitigates the risks associated with high-velocity gas processing.
  • Because synthetic solutions offer superior oxidative resistance, facilities integrating these advanced fluids experience substantially fewer maintenance interventions than those relying on traditional mineral counterparts. This strategic shift not only improves mechanical availability but also aligns with broader corporate objectives centered on asset optimization, resource conservation, and sustained manufacturing excellence.
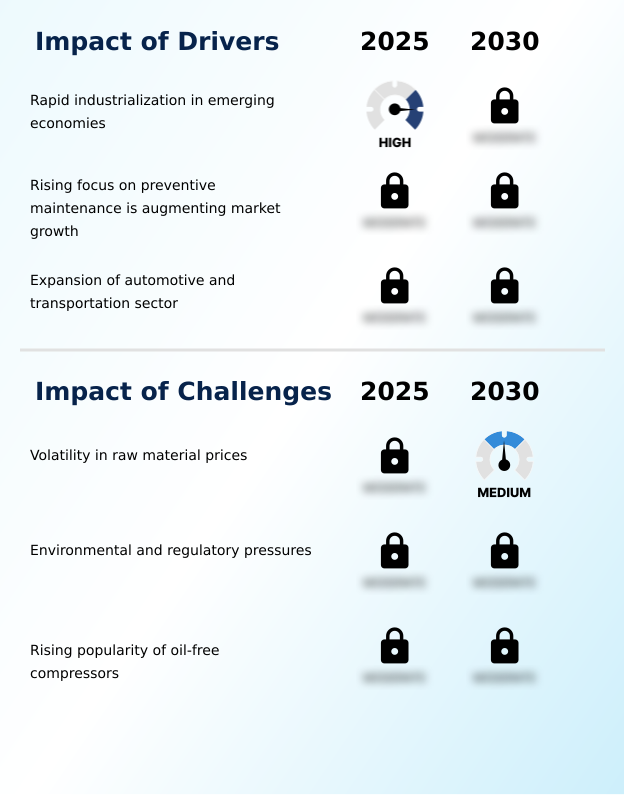
What are the key market drivers leading to the rise in the adoption of Compressor Oil Industry?

  • Rapid industrialization in emerging economies is serving as the primary driver accelerating expansion within the global compressor oil market.

  • The widespread expansion of automated manufacturing is aggressively driving demand within the global compressor oil market. Heavy industries increasingly rely on continuous rotary screw compressor operations, necessitating advanced anti wear additives and superior demulsibility to prevent moisture-induced mechanical failures.
  • Because modern facilities employ predictive maintenance analytics and condition based monitoring, operators can precisely track fluid degradation and optimize replacement cycles.
  • This data-driven approach causes a direct improvement in heat dissipation and foam suppression, resulting in a 25% reduction in friction-related component wear compared to unmonitored systems. Consequently, effective fluid management promotes machinery longevity and enables significant equipment downtime reduction.
  • As manufacturers optimize rotary vane mechanics to support higher production volumes, the integration of premium lubricants ensures uninterrupted output and enhances overall industrial productivity.

What are the market trends shaping the Compressor Oil Industry?

  • The transition to synthetic and bio-based oils represents a significant trend shaping the global compressor oil market.

  • The continuous integration of synthetic formulations is fundamentally reshaping the global compressor oil market as industries demand greater operational resilience. To achieve energy efficiency optimization, manufacturing facilities are adopting polyalphaolefin and ester based fluids, which possess superior thermal stability and oxidation resistance. This transition is caused by the rising operational temperatures in modern climate control infrastructure and high-speed pneumatic systems.
  • Consequently, using an ashless formulation enhances equipment performance, delivering a 22% improvement in mechanical lifespan compared to traditional solutions. Furthermore, strict regulatory pressures are accelerating the shift toward sustainable industrial fluids that meet stringent biodegradability standards.
  • By maintaining optimal refrigerant circulation and preventing premature degradation, these advanced lubricants enable operators to reduce fluid disposal costs by 18%, directly improving facility maintenance budgets while advancing corporate environmental mandates.

What challenges does the Compressor Oil Industry face during its growth?

  • Volatility in raw material prices remains a critical challenge restraining consistent growth across the global compressor oil market.

  • Stringent contamination control mandates and equipment design shifts present structural challenges for the global compressor oil market. Industries operating within cleanroom environments demand extreme fluid purity, driving a widespread transition toward oil-free compressor technologies to ensure strict food grade compliance.
  • Because conventional lubricants risk causing sludge formation, varnish deposit, and severe thermal degradation under intense stress, operators face mounting pressure to optimize fluid lifecycle management. This shift causes facilities to demand advanced formulations with a lower friction coefficient and exceptional seal compatibility.
  • Consequently, failing to maintain adequate carbon deposit prevention and moisture resistance results in a 30% increase in unexpected maintenance expenditures compared to optimized systems. These operational hurdles force suppliers to continuously reformulate products to prevent mechanical disruptions while navigating complex environmental constraints.

Exclusive Technavio Analysis on Customer Landscape

The compressor oil market forecasting report includes the adoption lifecycle of the market, covering from the innovator’s stage to the laggard’s stage. It focuses on adoption rates in different regions based on penetration. Furthermore, the compressor oil market report also includes key purchase criteria and drivers of price sensitivity to help companies evaluate and develop their market growth analysis strategies.
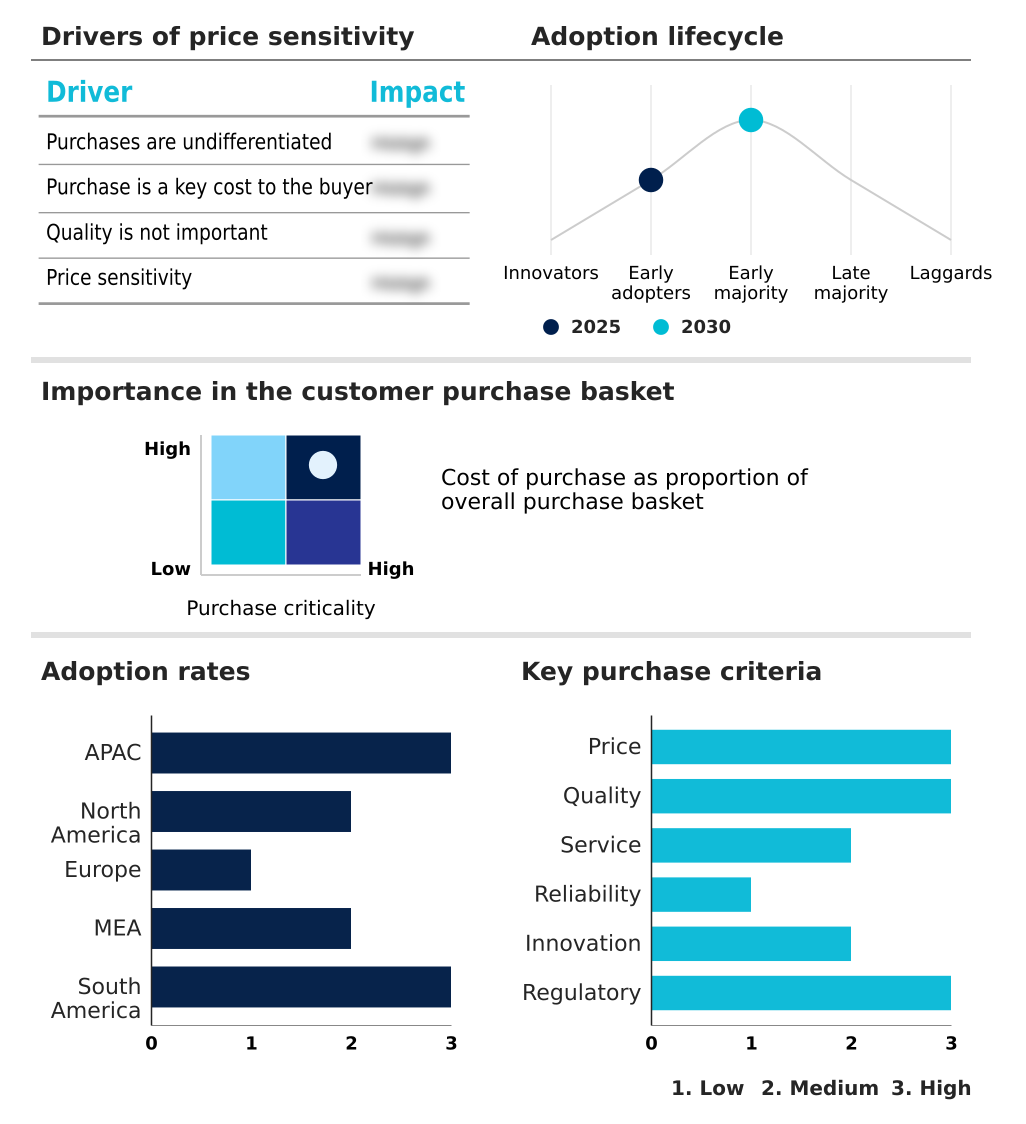
Customer Landscape of Compressor Oil Industry

Competitive Landscape

Companies are implementing various strategies, such as strategic alliances, compressor oil market forecast, partnerships, mergers and acquisitions, geographical expansion, and product/service launches, to enhance their presence in the industry.

AMSOIL Inc. - Comprehensive lubrication portfolios include advanced mineral and synthetic fluids designed to optimize thermal regulation, reduce component friction, and extend service intervals across continuous industrial compression operations.

The industry research and growth report includes detailed analyses of the competitive landscape of the market and information about key companies, including:

  • AMSOIL Inc.
  • BP Plc
  • Chevron Corp.
  • ENEOS Holdings Inc.
  • Exxon Mobil Corp.
  • FUCHS SE
  • Gulf Oil International Ltd.
  • Idemitsu Kosan Co. Ltd.
  • Kluber Lubrication Munchen SE
  • Morris Lubricants
  • MOTUL SA
  • Penrite Oil Co. Pty. Ltd.
  • Petro Canada
  • PETRONAS Lubricants Int
  • Phillips 66 Co.
  • Repsol SA
  • ROCOL
  • Rymax BV
  • Shell plc
  • Sinopec Lubricant Co
  • TotalEnergies SE
  • Valvoline Inc.

Qualitative and quantitative analysis of companies has been conducted to help clients understand the wider business environment as well as the strengths and weaknesses of key industry players. Data is qualitatively analyzed to categorize companies as pure play, category-focused, industry-focused, and diversified; it is quantitatively analyzed to categorize companies as dominant, leading, strong, tentative, and weak.

Recent Development and News in Compressor oil market

  • In the Oil and Gas Refining and Marketing industry, the transition toward hydrometallurgical processing and high-severity hydrocracking increased the operational temperature profiles of processing equipment, directly impacting the global compressor oil market demand by necessitating synthetic lubricants with a 25% higher oxidation resistance.
  • Stringent emissions regulations such as the ISO 14001 environmental management frameworks forced downstream refineries to upgrade vapor recovery units, increasing the deployment of centrifugal compressors and driving demand for advanced thermal stability fluids that reduce maintenance downtime by 20%.
  • The widespread adoption of predictive maintenance analytics across petrochemical separation facilities enabled plant operators to optimize fluid lifecycle management, reducing premature fluid degradation and altering fluid procurement cycles by an average of 15%.
  • Expansions in liquefied natural gas fractionation capacities required the installation of high-capacity rotary screw compressor systems, which subsequently increased the consumption of specialized anti wear additives designed to withstand a 30% increase in continuous duty load.

Dive into Technavio’s robust research methodology, blending expert interviews, extensive data synthesis, and validated models for unparalleled Compressor Oil Market insights. See full methodology.

Market Scope
Page number 318
Base year 2025
Historic period 2020-2024
Forecast period 2026-2030
Growth momentum & CAGR Accelerate at a CAGR of 5.3%
Market growth 2026-2030 USD 1693.1 million
Market structure Fragmented
YoY growth 2025-2026(%) 5.0%
Key countries China, Japan, India, South Korea, Australia, Indonesia, US, Canada, Mexico, Germany, UK, France, Italy, Spain, The Netherlands, Saudi Arabia, UAE, South Africa, Israel, Turkey, Brazil, Argentina and Chile
Competitive landscape Leading Companies, Market Positioning of Companies, Competitive Strategies, and Industry Risks

Request Free Sample

Research Analyst Overview

  • The compressor oil market continues to evolve as manufacturing executives prioritize asset optimization and operational resilience. The accelerating transition toward advanced synthetic formulations directly influences boardroom-level budgeting decisions, as organizations shift focus from initial procurement expenses to long-term lifecycle savings. By utilizing high-performance lubricants, industrial facilities achieve a 30% reduction in maintenance-related downtime compared to operations using conventional fluid technologies.
  • This measurable improvement in mechanical availability enables supply chain planners to maintain consistent production schedules and meet stringent output targets. The integration of advanced fluid technologies mitigates friction and thermal stress, addressing structural challenges associated with intensive pneumatic operations. Consequently, industrial leaders are strategically adopting specialized lubrication programs to support complex automation and robotics infrastructure.
  • This proactive fluid management approach ensures optimal equipment functioning, lowers energy consumption, and aligns with broader efficiency mandates. As operational demands intensify, the reliance on resilient lubrication strategies remains critical for sustaining high-capacity manufacturing and maintaining competitive operational agility.

What are the Key Data Covered in this Compressor Oil Market Research and Growth Report?

  • What is the expected growth of the Compressor Oil Market between 2026 and 2030?

    • USD 1.69 billion, at a CAGR of 5.3%

  • What segmentation does the market report cover?

    • The report is segmented by Type (Mineral-base, Synthetic-base, and Bio-based), Application (Positive displacement compressor, and Dynamic compressor), End-user (Industrial machinery, Automotive, Oil and gas, Power, and Others) and Geography (APAC, North America, Europe, Middle East and Africa, South America)

  • Which regions are analyzed in the report?

    • APAC, North America, Europe, Middle East and Africa and South America

  • What are the key growth drivers and market challenges?

    • Rapid industrialization in emerging economies, Volatility in raw material prices

  • Who are the major players in the Compressor Oil Market?

    • AMSOIL Inc., BP Plc, Chevron Corp., ENEOS Holdings Inc., Exxon Mobil Corp., FUCHS SE, Gulf Oil International Ltd., Idemitsu Kosan Co. Ltd., Kluber Lubrication Munchen SE, Morris Lubricants, MOTUL SA, Penrite Oil Co. Pty. Ltd., Petro Canada, PETRONAS Lubricants Int, Phillips 66 Co., Repsol SA, ROCOL, Rymax BV, Shell plc, Sinopec Lubricant Co, TotalEnergies SE and Valvoline Inc.

Market Research Insights

  • The compressor oil market is rapidly evolving as industrial operators prioritize equipment reliability and efficiency. By integrating predictive maintenance analytics and condition based monitoring, manufacturing facilities can proactively assess fluid health, resulting in a 25% reduction in unscheduled maintenance costs.
  • The shift toward sustainable industrial fluids supports broader environmental compliance while delivering a 15% improvement in energy efficiency optimization compared to conventional alternatives. These advanced formulations actively promote equipment downtime reduction by maintaining stable viscosity under extreme operational stress. Consequently, end-users achieve superior mechanical reliability and lower total ownership expenditures, driving continuous innovation across the industrial lubrication sector.

We can help! Our analysts can customize this compressor oil market research report to meet your requirements.

Get in touch

1. Executive Summary

1.1 Market overview

Executive Summary - Chart on Market Overview
Executive Summary - Data Table on Market Overview
Executive Summary - Chart on Global Market Characteristics
Executive Summary - Chart on Market by Geography
Executive Summary - Chart on Market Segmentation by Type
Executive Summary - Chart on Market Segmentation by Application
Executive Summary - Chart on Market Segmentation by End-user
Executive Summary - Chart on Incremental Growth
Executive Summary - Data Table on Incremental Growth
Executive Summary - Chart on Company Market Positioning

2. Technavio Analysis

2.1 Analysis of price sensitivity, lifecycle, customer purchase basket, adoption rates, and purchase criteria

2.2 Criticality of inputs and Factors of differentiation

Chart on Overview on criticality of inputs and factors of differentiation

2.3 Factors of disruption

Chart on Overview on factors of disruption

2.4 Impact of drivers and challenges

Chart on Impact of drivers and challenges in 2025 and 2030

3. Market Landscape

3.1 Market ecosystem

Chart on Parent Market
Data Table on - Parent Market

3.2 Market characteristics

Chart on Market characteristics analysis

3.3 Value chain analysis

Chart on Value chain analysis

4. Market Sizing

4.1 Market definition

Data Table on Offerings of companies included in the market definition

4.2 Market segment analysis

Market segments

4.3 Market size 2025

4.4 Market outlook: Forecast for 2025-2030

Chart on Global - Market size and forecast 2025-2030 ($ million)
Data Table on Global - Market size and forecast 2025-2030 ($ million)
Chart on Global Market: Year-over-year growth 2025-2030 (%)
Data Table on Global Market: Year-over-year growth 2025-2030 (%)

5. Historic Market Size

5.1 Global Compressor Oil Market 2020 - 2024

Historic Market Size - Data Table on Global Compressor Oil Market 2020 - 2024 ($ million)

5.2 Type segment analysis 2020 - 2024

Historic Market Size - Type Segment 2020 - 2024 ($ million)

5.3 Application segment analysis 2020 - 2024

Historic Market Size - Application Segment 2020 - 2024 ($ million)

5.4 End-user segment analysis 2020 - 2024

Historic Market Size - End-user Segment 2020 - 2024 ($ million)

5.5 Geography segment analysis 2020 - 2024

Historic Market Size - Geography Segment 2020 - 2024 ($ million)

5.6 Country segment analysis 2020 - 2024

Historic Market Size - Country Segment 2020 - 2024 ($ million)

6. Qualitative Analysis

6.1 Impact of AI on Global Compressor Oil Market

6.2 Impact of Geopolitical Conflicts on Global Compressor Oil Market

7. Five Forces Analysis

7.1 Five forces summary

Five forces analysis - Comparison between 2025 and 2030

7.2 Bargaining power of buyers

Bargaining power of buyers - Impact of key factors 2025 and 2030

7.3 Bargaining power of suppliers

Bargaining power of suppliers - Impact of key factors in 2025 and 2030

7.4 Threat of new entrants

Threat of new entrants - Impact of key factors in 2025 and 2030

7.5 Threat of substitutes

Threat of substitutes - Impact of key factors in 2025 and 2030

7.6 Threat of rivalry

Threat of rivalry - Impact of key factors in 2025 and 2030

7.7 Market condition

Chart on Market condition - Five forces 2025 and 2030

8. Market Segmentation by Type

8.1 Market segments

Chart on Type - Market share 2025-2030 (%)
Data Table on Type - Market share 2025-2030 (%)

8.2 Comparison by Type

Chart on Comparison by Type
Data Table on Comparison by Type

8.3 Mineral-base - Market size and forecast 2025-2030

Chart on Mineral-base - Market size and forecast 2025-2030 ($ million)
Data Table on Mineral-base - Market size and forecast 2025-2030 ($ million)
Chart on Mineral-base - Year-over-year growth 2025-2030 (%)
Data Table on Mineral-base - Year-over-year growth 2025-2030 (%)

8.4 Synthetic-base - Market size and forecast 2025-2030

Chart on Synthetic-base - Market size and forecast 2025-2030 ($ million)
Data Table on Synthetic-base - Market size and forecast 2025-2030 ($ million)
Chart on Synthetic-base - Year-over-year growth 2025-2030 (%)
Data Table on Synthetic-base - Year-over-year growth 2025-2030 (%)

8.5 Bio-based - Market size and forecast 2025-2030

Chart on Bio-based - Market size and forecast 2025-2030 ($ million)
Data Table on Bio-based - Market size and forecast 2025-2030 ($ million)
Chart on Bio-based - Year-over-year growth 2025-2030 (%)
Data Table on Bio-based - Year-over-year growth 2025-2030 (%)

8.6 Market opportunity by Type

Market opportunity by Type ($ million)
Data Table on Market opportunity by Type ($ million)

9. Market Segmentation by Application

9.1 Market segments

Chart on Application - Market share 2025-2030 (%)
Data Table on Application - Market share 2025-2030 (%)

9.2 Comparison by Application

Chart on Comparison by Application
Data Table on Comparison by Application

9.3 Positive displacement compressor - Market size and forecast 2025-2030

Chart on Positive displacement compressor - Market size and forecast 2025-2030 ($ million)
Data Table on Positive displacement compressor - Market size and forecast 2025-2030 ($ million)
Chart on Positive displacement compressor - Year-over-year growth 2025-2030 (%)
Data Table on Positive displacement compressor - Year-over-year growth 2025-2030 (%)

9.4 Dynamic compressor - Market size and forecast 2025-2030

Chart on Dynamic compressor - Market size and forecast 2025-2030 ($ million)
Data Table on Dynamic compressor - Market size and forecast 2025-2030 ($ million)
Chart on Dynamic compressor - Year-over-year growth 2025-2030 (%)
Data Table on Dynamic compressor - Year-over-year growth 2025-2030 (%)

9.5 Market opportunity by Application

Market opportunity by Application ($ million)
Data Table on Market opportunity by Application ($ million)

10. Market Segmentation by End-user

10.1 Market segments

Chart on End-user - Market share 2025-2030 (%)
Data Table on End-user - Market share 2025-2030 (%)

10.2 Comparison by End-user

Chart on Comparison by End-user
Data Table on Comparison by End-user

10.3 Industrial machinery - Market size and forecast 2025-2030

Chart on Industrial machinery - Market size and forecast 2025-2030 ($ million)
Data Table on Industrial machinery - Market size and forecast 2025-2030 ($ million)
Chart on Industrial machinery - Year-over-year growth 2025-2030 (%)
Data Table on Industrial machinery - Year-over-year growth 2025-2030 (%)

10.4 Automotive - Market size and forecast 2025-2030

Chart on Automotive - Market size and forecast 2025-2030 ($ million)
Data Table on Automotive - Market size and forecast 2025-2030 ($ million)
Chart on Automotive - Year-over-year growth 2025-2030 (%)
Data Table on Automotive - Year-over-year growth 2025-2030 (%)

10.5 Oil and gas - Market size and forecast 2025-2030

Chart on Oil and gas - Market size and forecast 2025-2030 ($ million)
Data Table on Oil and gas - Market size and forecast 2025-2030 ($ million)
Chart on Oil and gas - Year-over-year growth 2025-2030 (%)
Data Table on Oil and gas - Year-over-year growth 2025-2030 (%)

10.6 Power - Market size and forecast 2025-2030

Chart on Power - Market size and forecast 2025-2030 ($ million)
Data Table on Power - Market size and forecast 2025-2030 ($ million)
Chart on Power - Year-over-year growth 2025-2030 (%)
Data Table on Power - Year-over-year growth 2025-2030 (%)

10.7 Others - Market size and forecast 2025-2030

Chart on Others - Market size and forecast 2025-2030 ($ million)
Data Table on Others - Market size and forecast 2025-2030 ($ million)
Chart on Others - Year-over-year growth 2025-2030 (%)
Data Table on Others - Year-over-year growth 2025-2030 (%)

10.8 Market opportunity by End-user

Market opportunity by End-user ($ million)
Data Table on Market opportunity by End-user ($ million)

11. Customer Landscape

11.1 Customer landscape overview

Analysis of price sensitivity, lifecycle, customer purchase basket, adoption rates, and purchase criteria

12. Geographic Landscape

12.1 Geographic segmentation

Chart on Market share by geography 2025-2030 (%)
Data Table on Market share by geography 2025-2030 (%)

12.2 Geographic comparison

Chart on Geographic comparison
Data Table on Geographic comparison

12.3 APAC - Market size and forecast 2025-2030

Chart on APAC - Market size and forecast 2025-2030 ($ million)
Data Table on APAC - Market size and forecast 2025-2030 ($ million)
Chart on APAC - Year-over-year growth 2025-2030 (%)
Data Table on APAC - Year-over-year growth 2025-2030 (%)
Chart on Regional Comparison - APAC
Data Table on Regional Comparison - APAC

12.3.1 China - Market size and forecast 2025-2030

Chart on China - Market size and forecast 2025-2030 ($ million)
Data Table on China - Market size and forecast 2025-2030 ($ million)
Chart on China - Year-over-year growth 2025-2030 (%)
Data Table on China - Year-over-year growth 2025-2030 (%)

12.3.2 Japan - Market size and forecast 2025-2030

Chart on Japan - Market size and forecast 2025-2030 ($ million)
Data Table on Japan - Market size and forecast 2025-2030 ($ million)
Chart on Japan - Year-over-year growth 2025-2030 (%)
Data Table on Japan - Year-over-year growth 2025-2030 (%)

12.3.3 India - Market size and forecast 2025-2030

Chart on India - Market size and forecast 2025-2030 ($ million)
Data Table on India - Market size and forecast 2025-2030 ($ million)
Chart on India - Year-over-year growth 2025-2030 (%)
Data Table on India - Year-over-year growth 2025-2030 (%)

12.3.4 South Korea - Market size and forecast 2025-2030

Chart on South Korea - Market size and forecast 2025-2030 ($ million)
Data Table on South Korea - Market size and forecast 2025-2030 ($ million)
Chart on South Korea - Year-over-year growth 2025-2030 (%)
Data Table on South Korea - Year-over-year growth 2025-2030 (%)

12.3.5 Australia - Market size and forecast 2025-2030

Chart on Australia - Market size and forecast 2025-2030 ($ million)
Data Table on Australia - Market size and forecast 2025-2030 ($ million)
Chart on Australia - Year-over-year growth 2025-2030 (%)
Data Table on Australia - Year-over-year growth 2025-2030 (%)

12.3.6 Indonesia - Market size and forecast 2025-2030

Chart on Indonesia - Market size and forecast 2025-2030 ($ million)
Data Table on Indonesia - Market size and forecast 2025-2030 ($ million)
Chart on Indonesia - Year-over-year growth 2025-2030 (%)
Data Table on Indonesia - Year-over-year growth 2025-2030 (%)

12.4 North America - Market size and forecast 2025-2030

Chart on North America - Market size and forecast 2025-2030 ($ million)
Data Table on North America - Market size and forecast 2025-2030 ($ million)
Chart on North America - Year-over-year growth 2025-2030 (%)
Data Table on North America - Year-over-year growth 2025-2030 (%)
Chart on Regional Comparison - North America
Data Table on Regional Comparison - North America

12.4.1 US - Market size and forecast 2025-2030

Chart on US - Market size and forecast 2025-2030 ($ million)
Data Table on US - Market size and forecast 2025-2030 ($ million)
Chart on US - Year-over-year growth 2025-2030 (%)
Data Table on US - Year-over-year growth 2025-2030 (%)

12.4.2 Canada - Market size and forecast 2025-2030

Chart on Canada - Market size and forecast 2025-2030 ($ million)
Data Table on Canada - Market size and forecast 2025-2030 ($ million)
Chart on Canada - Year-over-year growth 2025-2030 (%)
Data Table on Canada - Year-over-year growth 2025-2030 (%)

12.4.3 Mexico - Market size and forecast 2025-2030

Chart on Mexico - Market size and forecast 2025-2030 ($ million)
Data Table on Mexico - Market size and forecast 2025-2030 ($ million)
Chart on Mexico - Year-over-year growth 2025-2030 (%)
Data Table on Mexico - Year-over-year growth 2025-2030 (%)

12.5 Europe - Market size and forecast 2025-2030

Chart on Europe - Market size and forecast 2025-2030 ($ million)
Data Table on Europe - Market size and forecast 2025-2030 ($ million)
Chart on Europe - Year-over-year growth 2025-2030 (%)
Data Table on Europe - Year-over-year growth 2025-2030 (%)
Chart on Regional Comparison - Europe
Data Table on Regional Comparison - Europe

12.5.1 Germany - Market size and forecast 2025-2030

Chart on Germany - Market size and forecast 2025-2030 ($ million)
Data Table on Germany - Market size and forecast 2025-2030 ($ million)
Chart on Germany - Year-over-year growth 2025-2030 (%)
Data Table on Germany - Year-over-year growth 2025-2030 (%)

12.5.2 UK - Market size and forecast 2025-2030

Chart on UK - Market size and forecast 2025-2030 ($ million)
Data Table on UK - Market size and forecast 2025-2030 ($ million)
Chart on UK - Year-over-year growth 2025-2030 (%)
Data Table on UK - Year-over-year growth 2025-2030 (%)

12.5.3 France - Market size and forecast 2025-2030

Chart on France - Market size and forecast 2025-2030 ($ million)
Data Table on France - Market size and forecast 2025-2030 ($ million)
Chart on France - Year-over-year growth 2025-2030 (%)
Data Table on France - Year-over-year growth 2025-2030 (%)

12.5.4 Italy - Market size and forecast 2025-2030

Chart on Italy - Market size and forecast 2025-2030 ($ million)
Data Table on Italy - Market size and forecast 2025-2030 ($ million)
Chart on Italy - Year-over-year growth 2025-2030 (%)
Data Table on Italy - Year-over-year growth 2025-2030 (%)

12.5.5 Spain - Market size and forecast 2025-2030

Chart on Spain - Market size and forecast 2025-2030 ($ million)
Data Table on Spain - Market size and forecast 2025-2030 ($ million)
Chart on Spain - Year-over-year growth 2025-2030 (%)
Data Table on Spain - Year-over-year growth 2025-2030 (%)

12.5.6 The Netherlands - Market size and forecast 2025-2030

Chart on The Netherlands - Market size and forecast 2025-2030 ($ million)
Data Table on The Netherlands - Market size and forecast 2025-2030 ($ million)
Chart on The Netherlands - Year-over-year growth 2025-2030 (%)
Data Table on The Netherlands - Year-over-year growth 2025-2030 (%)

12.6 Middle East and Africa - Market size and forecast 2025-2030

Chart on Middle East and Africa - Market size and forecast 2025-2030 ($ million)
Data Table on Middle East and Africa - Market size and forecast 2025-2030 ($ million)
Chart on Middle East and Africa - Year-over-year growth 2025-2030 (%)
Data Table on Middle East and Africa - Year-over-year growth 2025-2030 (%)
Chart on Regional Comparison - Middle East and Africa
Data Table on Regional Comparison - Middle East and Africa

12.6.1 Saudi Arabia - Market size and forecast 2025-2030

Chart on Saudi Arabia - Market size and forecast 2025-2030 ($ million)
Data Table on Saudi Arabia - Market size and forecast 2025-2030 ($ million)
Chart on Saudi Arabia - Year-over-year growth 2025-2030 (%)
Data Table on Saudi Arabia - Year-over-year growth 2025-2030 (%)

12.6.2 UAE - Market size and forecast 2025-2030

Chart on UAE - Market size and forecast 2025-2030 ($ million)
Data Table on UAE - Market size and forecast 2025-2030 ($ million)
Chart on UAE - Year-over-year growth 2025-2030 (%)
Data Table on UAE - Year-over-year growth 2025-2030 (%)

12.6.3 South Africa - Market size and forecast 2025-2030

Chart on South Africa - Market size and forecast 2025-2030 ($ million)
Data Table on South Africa - Market size and forecast 2025-2030 ($ million)
Chart on South Africa - Year-over-year growth 2025-2030 (%)
Data Table on South Africa - Year-over-year growth 2025-2030 (%)

12.6.4 Israel - Market size and forecast 2025-2030

Chart on Israel - Market size and forecast 2025-2030 ($ million)
Data Table on Israel - Market size and forecast 2025-2030 ($ million)
Chart on Israel - Year-over-year growth 2025-2030 (%)
Data Table on Israel - Year-over-year growth 2025-2030 (%)

12.6.5 Turkey - Market size and forecast 2025-2030

Chart on Turkey - Market size and forecast 2025-2030 ($ million)
Data Table on Turkey - Market size and forecast 2025-2030 ($ million)
Chart on Turkey - Year-over-year growth 2025-2030 (%)
Data Table on Turkey - Year-over-year growth 2025-2030 (%)

12.7 South America - Market size and forecast 2025-2030

Chart on South America - Market size and forecast 2025-2030 ($ million)
Data Table on South America - Market size and forecast 2025-2030 ($ million)
Chart on South America - Year-over-year growth 2025-2030 (%)
Data Table on South America - Year-over-year growth 2025-2030 (%)
Chart on Regional Comparison - South America
Data Table on Regional Comparison - South America

12.7.1 Brazil - Market size and forecast 2025-2030

Chart on Brazil - Market size and forecast 2025-2030 ($ million)
Data Table on Brazil - Market size and forecast 2025-2030 ($ million)
Chart on Brazil - Year-over-year growth 2025-2030 (%)
Data Table on Brazil - Year-over-year growth 2025-2030 (%)

12.7.2 Argentina - Market size and forecast 2025-2030

Chart on Argentina - Market size and forecast 2025-2030 ($ million)
Data Table on Argentina - Market size and forecast 2025-2030 ($ million)
Chart on Argentina - Year-over-year growth 2025-2030 (%)
Data Table on Argentina - Year-over-year growth 2025-2030 (%)

12.7.3 Chile - Market size and forecast 2025-2030

Chart on Chile - Market size and forecast 2025-2030 ($ million)
Data Table on Chile - Market size and forecast 2025-2030 ($ million)
Chart on Chile - Year-over-year growth 2025-2030 (%)
Data Table on Chile - Year-over-year growth 2025-2030 (%)

12.8 Market opportunity by geography

Market opportunity by geography ($ million)
Data Tables on Market opportunity by geography ($ million)

13. Drivers, Challenges, and Opportunity

13.1 Market drivers

Rapid industrialization in emerging economies
Rising focus on preventive maintenance is augmenting market growth
Expansion of automotive and transportation sector

13.2 Market challenges

Volatility in raw material prices
Environmental and regulatory pressures
Rising popularity of oil-free compressors

13.3 Impact of drivers and challenges

Impact of drivers and challenges in 2025 and 2030

13.4 Market opportunities

Transition to synthetic and bio-based oils
Strategic partnerships and collaborations
Expansion of HVAC Systems

14. Competitive Landscape

14.1 Overview

14.2

Overview on criticality of inputs and factors of differentiation

14.3 Landscape disruption

Overview on factors of disruption

14.4 Industry risks

Impact of key risks on business

15. Competitive Analysis

15.1 Companies profiled

Companies covered

15.2 Company ranking index

15.3 Market positioning of companies

Matrix on companies position and classification

15.4 BP Plc

BP Plc - Overview
BP Plc - Business segments
BP Plc - Key offerings
BP Plc - Segment focus
SWOT

15.5 Chevron Corp.

Chevron Corp. - Overview
Chevron Corp. - Business segments
Chevron Corp. - Key news
Chevron Corp. - Key offerings
Chevron Corp. - Segment focus
SWOT

15.6 ENEOS Holdings Inc.

ENEOS Holdings Inc. - Overview
ENEOS Holdings Inc. - Business segments
ENEOS Holdings Inc. - Key offerings
ENEOS Holdings Inc. - Segment focus
SWOT

15.7 Exxon Mobil Corp.

Exxon Mobil Corp. - Overview
Exxon Mobil Corp. - Business segments
Exxon Mobil Corp. - Key news
Exxon Mobil Corp. - Key offerings
Exxon Mobil Corp. - Segment focus
SWOT

15.8 FUCHS SE

FUCHS SE - Overview
FUCHS SE - Business segments
FUCHS SE - Key news
FUCHS SE - Key offerings
FUCHS SE - Segment focus
SWOT

15.9 Gulf Oil International Ltd.

Gulf Oil International Ltd. - Overview
Gulf Oil International Ltd. - Product / Service
Gulf Oil International Ltd. - Key offerings
SWOT

15.10 Idemitsu Kosan Co. Ltd.

Idemitsu Kosan Co. Ltd. - Overview
Idemitsu Kosan Co. Ltd. - Business segments
Idemitsu Kosan Co. Ltd. - Key offerings
Idemitsu Kosan Co. Ltd. - Segment focus
SWOT

15.11 Kluber Lubrication Munchen SE

Kluber Lubrication Munchen SE - Overview
Kluber Lubrication Munchen SE - Product / Service
Kluber Lubrication Munchen SE - Key offerings
SWOT

15.12 MOTUL SA

MOTUL SA - Overview
MOTUL SA - Product / Service
MOTUL SA - Key offerings
SWOT

15.13 Petro Canada

Petro Canada - Overview
Petro Canada - Product / Service
Petro Canada - Key offerings
SWOT

15.14 Phillips 66 Co.

Phillips 66 Co. - Overview
Phillips 66 Co. - Business segments
Phillips 66 Co. - Key offerings
Phillips 66 Co. - Segment focus
SWOT

15.15 Repsol SA

Repsol SA - Overview
Repsol SA - Business segments
Repsol SA - Key offerings
Repsol SA - Segment focus
SWOT

15.16 Shell plc

Shell plc - Overview
Shell plc - Business segments
Shell plc - Key offerings
Shell plc - Segment focus
SWOT

15.17 TotalEnergies SE

TotalEnergies SE - Overview
TotalEnergies SE - Business segments
TotalEnergies SE - Key news
TotalEnergies SE - Key offerings
TotalEnergies SE - Segment focus
SWOT

15.18 Valvoline Inc.

Valvoline Inc. - Overview
Valvoline Inc. - Product / Service
Valvoline Inc. - Key news
Valvoline Inc. - Key offerings
SWOT

16. Appendix

16.1 Scope of the report

Market definition
Objectives
Notes and caveats

16.2 Inclusions and exclusions checklist

Inclusions checklist
Exclusions checklist

16.3 Currency conversion rates for US$

16.4 Research methodology

16.5 Data procurement

Information sources

16.6 Data validation

16.7 Validation techniques employed for market sizing

16.8 Data synthesis

16.9 360 degree market analysis

16.10 List of abbreviations

Research Methodology

Technavio presents a detailed picture of the market by way of study, synthesis, and summation of data from multiple sources. The analysts have presented the various facets of the market with a particular focus on identifying the key industry influencers. The data thus presented is comprehensive, reliable, and the result of extensive research, both primary and secondary.

INFORMATION SOURCES

Primary sources

  • Manufacturers and suppliers
  • Channel partners
  • Industry experts
  • Strategic decision makers

Secondary sources

  • Industry journals and periodicals
  • Government data
  • Financial reports of key industry players
  • Historical data
  • Press releases

DATA ANALYSIS

Data Synthesis

  • Collation of data
  • Estimation of key figures
  • Analysis of derived insights

Data Validation

  • Triangulation with data models
  • Reference against proprietary databases
  • Corroboration with industry experts

REPORT WRITING

Qualitative

  • Market drivers
  • Market challenges
  • Market trends
  • Five forces analysis

Quantitative

  • Market size and forecast
  • Market segmentation
  • Geographical insights
  • Competitive landscape

Interested in this report?

Get your sample now to see our research methodology and insights!

Download Now

Frequently Asked Questions

Compressor Oil market growth will increase by USD 1693.1 million during 2026-2030.

The Compressor Oil market is expected to grow at a CAGR of 5.3% during 2026-2030.

Compressor Oil market is segmented by Type (Mineral-base, Synthetic-base, Bio-based) Application (Positive displacement compressor, Dynamic compressor) End-user (Industrial machinery, Automotive, Oil and gas, Power, Others)

AMSOIL Inc., BP Plc, Chevron Corp., ENEOS Holdings Inc., Exxon Mobil Corp., FUCHS SE, Gulf Oil International Ltd., Idemitsu Kosan Co. Ltd., Kluber Lubrication Munchen SE, Morris Lubricants, MOTUL SA, Penrite Oil Co. Pty. Ltd., Petro Canada, PETRONAS Lubricants Int, Phillips 66 Co., Repsol SA, ROCOL, Rymax BV, Shell plc, Sinopec Lubricant Co, TotalEnergies SE, Valvoline Inc. are a few of the key vendors in the Compressor Oil market.

APAC will register the highest growth rate of 48% among the other regions. Therefore, the Compressor Oil market in APAC is expected to garner significant business opportunities for the vendors during the forecast period.

China, Japan, India, South Korea, Australia, Indonesia, US, Canada, Mexico, Germany, UK, France, Italy, Spain, The Netherlands, Saudi Arabia, UAE, South Africa, Israel, Turkey, Brazil, Argentina, Chile

  • Rapid industrialization in emerging economies is the driving factor this market.

The Compressor Oil market vendors should focus on grabbing business opportunities from the Type segment as it accounted for the largest market share in the base year.
RIA - Research AI Assistant
Ask RIA
