Connected Logistics Market Analysis North America, Europe, APAC, South America, Middle East and Africa - US, Germany, UK, China, India - Size and Forecast 2024-2028

Connected Logistics Market Analysis North America, Europe, APAC, South America, Middle East and Africa - US, Germany, UK, China, India - Size and Forecast 2024-2028

Published: Jun 2024 195 Pages SKU: IRTNTR41049

Market Overview at a Glance

$138.66 B
Market Opportunity
34.28%
CAGR
25.64
YoY growth 2023-2024(%)

Connected Logistics Market Size 2024-2028

The connected logistics market size is forecast to increase by USD 138.66 billion at a CAGR of 34.28% between 2023 and 2028. Market growth hinges on various factors, including the efficient management of temperature-sensitive goods, the rising demand for enhanced connectivity, and the increasing emphasis on bolstering visibility and control within supply chain systems. Effective temperature management is crucial for preserving the integrity of perishable products during storage and transit, driving the demand for advanced cold chain solutions. Moreover, the need to enhance connectivity across supply chain networks facilitates seamless communication and data exchange between stakeholders, optimizing operations and enabling real-time decision-making. Additionally, heightened emphasis on visibility and control empowers businesses to track inventory movements, monitor performance metrics, and mitigate risks effectively. By addressing these critical factors, businesses can enhance operational efficiency, minimize losses, and capitalize on emerging opportunities, thereby fostering the growth and resilience of the market.  It also includes an in-depth analysis of drivers, trends, and challenges. Furthermore, the report includes historic market data from 2018 to 2022.

What will be the Size of the Market During the Forecast Period?

Connected Logistics Market Size

To learn more about this report, View Report Sample

Market Dynamic

In the realm of connected logistics, supply chain partners leverage cutting-edge technologies like Internet of Things (IoT) sensors and cloud platforms to streamline logistical operations and enhance value-added logistics services. Through intelligent transportation solutions and autonomous logistics trucks, companies optimize shipping processes while ensuring security and safety. With cloud-based technology and Bluetooth connectivity, interoperability between systems is facilitated, enabling efficient order processing and financial transactions. This interconnected network of connected logistics hardware and IoT sensors revolutionizes warehousing and shipping, ushering in a new era of seamless online shopping experiences and accessible supply chain management. Our researchers analyzed the data with 2023 as the base year, along with the key drivers, trends, and challenges. A holistic analysis of drivers will help companies refine their marketing strategies to gain a competitive advantage.

Key Market Driver

Effective management of temperature-sensitive products is a major driving factor for the market. The market is set to benefit greatly from the efficient handling of temperature-sensitive products, such as food and vaccines. Inadequate supply chain systems, particularly in developing countries, contribute to significant product wastage. Insufficient temperature management and failure to adhere to regulatory guidelines in storage networks are major factors behind the wastage of temperature-sensitive items. This wastage impacts healthcare services by creating shortages of vital drugs and rendering vaccines ineffective.

Furthermore, organizations are investing in technologies like IoT-powered smart refrigerators, analytics, and cloud computing solutions to tackle these challenges. Connected logistics systems, specifically designed for perishable products, effectively manage temperature-sensitive items under varying climatic conditions. The implementation of technology, such as medical refrigerator systems, ensures the safe storage of vaccines in remote and developing regions. The ability to manage temperature-sensitive products offered by connected logistics is expected to drive the growth of the global market in the forecast period.

Significant Market Trends

Increasing adoption of IoT in SCM systems is the primary trend in the market growth. One of the significant trends in the market is the growing adoption of IoT in supply chain management (SCM) systems. IoT enables real-time tracking of shipments through smart connected devices, which has gained popularity in industries like manufacturing, healthcare, and transportation. Sensors and devices installed in storage facilities and containers capture and transmit real-time data to SCM teams, providing crucial information on product conditions and delivery status. To preserve perishable goods and vaccines within the required temperature ranges, IoT technology helps detect and control technical faults in cold chain storage systems, preventing damage to stored products. IoT also facilitates the tracking of refrigerated containers, known as reefers, on cargo ships.

Moreover, the worldwide proliferation of smart connected devices is expected to reach 47 billion by 2026, posing challenges in managing and maintaining data. IoT solutions aid logistics firms in capturing and analyzing large volumes of data generated by connected devices using statistical transportation mode techniques. Technologies such as RFID, sensors, barcodes, and GPS play a vital role in efficiently monitoring and managing physical assets in transportation and logistics. For example, RFID enables easier tracking of goods in the supply chain and facilitates inventory management. Companies like Tech Mahindra and HCL Technologies have developed IoT solutions to assist cold storage management teams in monitoring the movement of containers and carriers. These IoT advancements enhance business efficiency and value. Hence, such factors are driving the market during the forecast period.

Major Market Challenge

Technical glitches are challenging the market growth.  The glitches can disrupt business operations and hinder the seamless functioning of connected logistics systems. Human intervention in supply chain systems can also impede the effectiveness of digital logger solutions, which should ideally be automated for continuous monitoring.

Moreover, some organizations still rely on manual processes, which can lead to delays in sending real-time temperature logs crucial for tracking and monitoring devices. This manual approach decreases the efficiency of the supply chain process and may result in the loss of clients for companies like Microsoft Corp and Oracle Corp. The prevalence of various technical glitches poses a significant threat to the growth of the market during the forecast period.

Exclusive Customer Landscape

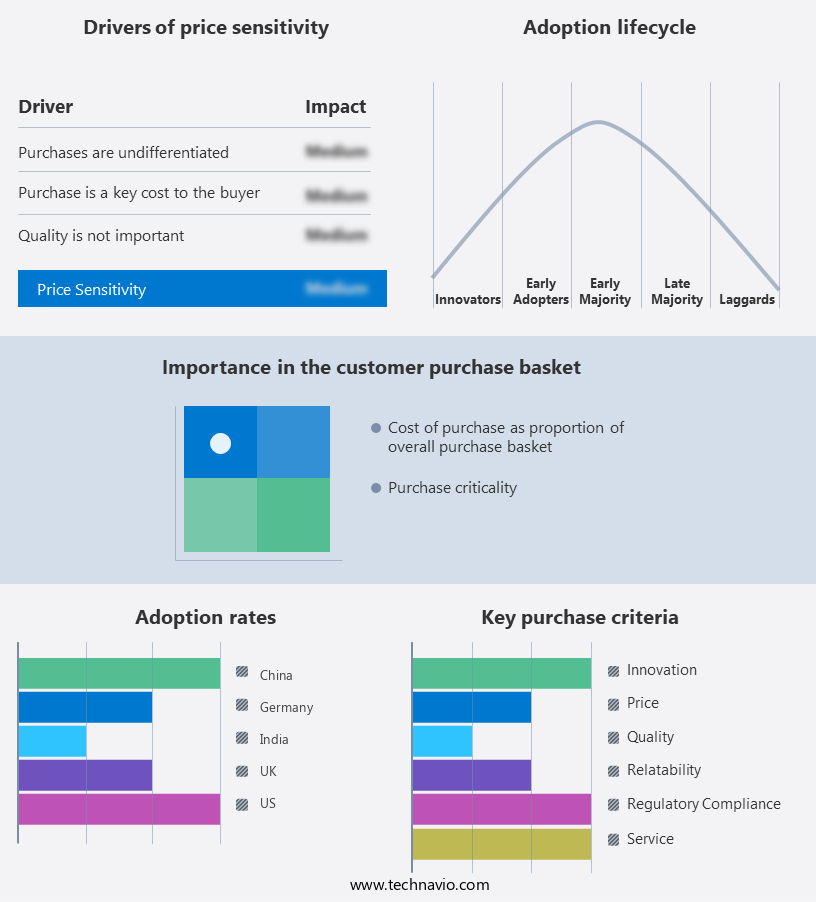
The market research report includes the adoption lifecycle of the market, covering from the innovator’s stage to the laggard’s stage. It focuses on adoption rates in different regions based on penetration. Furthermore, the report also includes key purchase criteria and drivers of price sensitivity to help companies evaluate and develop their growth strategies.

Connected Logistics Market Share by Geography

Market Customer Landscape

Key Companies & Market Insights

Companies are implementing various strategies, such as strategic alliances, partnerships, mergers and acquisitions, geographical expansion, and product/service launches, to enhance their presence in the market.

  • Accenture Plc: The company offers connected logistics such as one connected supply chain.
  • Amazon.com Inc: The company offers connected logistics such as the AWS supply chain.

The research report also includes detailed analyses of the competitive landscape of the market and information about 15 market companies, including:

  • AT and T Inc.
  • Cisco Systems Inc.
  • HCL Technologies Ltd.
  • Huawei Technologies Co. Ltd.
  • Infosys Ltd.
  • Intel Corp.
  • International Business Machines Corp.
  • Microsoft Corp.
  • Nokia Corp.
  • Oracle Corp.
  • ORBCOMM Inc.
  • PTC Inc.
  • Qualcomm Inc.
  • Samsung Electronics Co. Ltd.
  • SAP SE
  • Siemens AG
  • Tata Consultancy Services Ltd.
  • Thales Group

Qualitative and quantitative analysis of companies has been conducted to help clients understand the wider business environment as well as the strengths and weaknesses of key market players. Data is qualitatively analyzed to categorize companies as pure play, category-focused, industry-focused, and diversified; it is quantitatively analyzed to categorize companies as dominant, leading, strong, tentative, and weak.

Market Segmentation

By Product

The roadways segment will account for a major share of the market's growth during the forecast period. Connected logistics plays a vital role in improving the efficiency of transportation operations by enabling more effective routing, optimal asset utilization, and enhanced customer service. The advantages of these logistics are the accurate fuel cost estimates and route options, contributing to the growth of connected logistics in the roadways segment. By reducing service failures and delays, connected logistics significantly improve the road transportation sector within the market.

Connected Logistics Market Size

Get a glance at the market contribution of various segments Request Free PDF Sample

The roadways segment was valued at USD 6.76 billion in 2018. Connected logistics aid in route planning by providing valuable information on weather conditions, traffic congestion, and potential obstacles. Cold storage, an essential element of the global supply chain, benefits from connected logistics through real-time temperature monitoring, which helps transportation managers and regulatory organizations prevent issues like product expiration. The advantages of connected logistics, such as accurate fuel cost estimates and route options, contribute to the growth of connected logistics in the roadways segment. By reducing service failures and delays, connected logistics significantly improve the road transportation sector within the market. Hence, such factors are fuelling the growth of this segment during the forecast period.

By Type 

Based on type, the market has been segmented into software services, IT services, and hardware services. The software services segment will account for the largest share of this segment. The following are the primary contributing factors to the growing preference for cloud-based software services: Cloud-based solutions can be implemented more quickly than on-premise software solutions. Cloud-based IT architecture facilitates the deployment of cutting-edge IT solutions like predictive analytics, IoT-enabled applications, and M2M applications. Service-oriented architecture is favored by supply chain service providers due to its faster IT deployment and higher return on investment (ROI). On-premise software services are still preferred over cloud-based software services by businesses that have substantial IT budgets and resources and require value-added features. During the forecast period, it is anticipated that these factors will drive the segment's expansion. Hence, such factors are fuelling the growth of this segment during the forecast period.

Regional Analysis

North America is estimated to contribute 36% to the growth of the global market during the forecast period.

Connected Logistics Market Share by Geography

For more insights on the market share of various regions Request Free PDF Sample now!

Technavio’s analysts have elaborately explained the regional trends and drivers that shape the market during the forecast period. The region demonstrates a strong emphasis on connected logistics services, primarily driven by the widespread adoption of technology in supply chain and distribution management. The presence of robust information and communication technology infrastructure, along with excellent connectivity to global locations, contributes to the region's significant market share. Leading services providers like DHL, GENCO, and Lineage Services create growth opportunities for vendors operating in the market. These factors contribute to the projected strong growth of the market in North America during the forecast period.

Segment Overview

The market research report provides comprehensive data (region wise segment analysis), with forecasts and estimates in "USD Billion" for the period 2024-2028, as well as historical data from 2018 - 2022 for the following segments.

  • Mode Of Transportation Outlook 
    • Roadways
    • Railways
    • Airways
    • Waterways
  • Type Outlook 
    • Software services
    • IT services
    • Hardware services
  • Region Outlook
    • North America
      • The U.S.
      • Canada
    • Europe
      • U.K.
      • Germany
      • France
      • Rest of Europe
    • APAC
      • China
      • India
    • South America
      • Chile
      • Brazil
      • Argentina
    • Middle East & Africa
      • Saudi Arabia
      • South Africa
      • Rest of the Middle East & Africa

You may also interested in below market reports:

  • Project Logistics Market: Project Logistics Market Analysis APAC, North America, Europe, Middle East and Africa, South America - US, China, Japan, India, Germany - Size and Forecast
  • Connected Rail Solutions Market: Connected Rail Solutions Market Analysis Europe, APAC, North America, Middle East and Africa, South America - US, China, Japan, UK, Germany - Size and Forecast 
  • Finished Vehicles Logistics Market: Finished Vehicles Logistics Market Analysis APAC, North America, Europe, Middle East and Africa, South America - China, US, Japan, India, Germany - Size and Forecast

Market Analyst Overview:

The market is undergoing a transformative shift, leveraging fleet telematics, cellular IoT connectivity, and RFID tags for seamless operations. Real-time location and route management coupled with analytics solutions optimize efficiency while ensuring transportation visibility. From last-mile delivery to long-distance retail goods delivery, tracking tools and asset tracking management streamline processes. Enhanced disaster preparedness and worker safety measures are facilitated by linked devices and communication devices, supported by cloud integration for real-time tracking. Warehouse management software and fleet management software aid in inventory tracking and workload planning, catering to diverse industries like retail, aerospace and defense, and automotive. With end-to-end delivery tracking and accuracy, connected logistics propel supply chains forward, ensuring operational effectiveness and resilience against supply chain disruptions.

Additionally, in the realm of connected logistics, real-time position tracking and tracking devices play pivotal roles in enhancing asset tracking and management. Providers offer comprehensive managed services and consulting to optimize transportation modes efficiency and ensure optimal carrying capacity utilization. Governments' initiatives, such as national logistics policy, streamline operations, especially in sectors like railway where frictional resistance is a concern. Industries spanning retail and e-commerce, energy, and electronics and semiconductors benefit from interconnected communication systems and improved logistic operational effectiveness. In the evolving landscape of connected logistics, loT sensors play a pivotal role in enhancing security and safety concerns. Through robust communication systems and linked logistics systems, companies ensure accessibility and streamline operations. Intelligent transportation systems further optimize efficiency while fostering seamless coordination among various components. This integrated approach transforms traditional logistics into dynamic, interconnected networks, facilitating smoother supply chain management and enabling real-time monitoring of assets and shipments.

Further, smart devices and Internet connectivity empower logistic providers to offer real-time tracking logistics solutions, mitigating supply chain disruption risks. Enhanced labour management and efficient handling of raw materials and trade are facilitated through electronic data and app-based interfaces. E-commerce platforms bolster receiving and inventory storage, catering to diverse fixed assets like aircraft and transport vehicles. Advanced inventory tools and automated scanning techniques optimize inbound and outbound items management, minimizing fuel consumption and fostering government programs like rail freight initiatives, benefitting the automotive industry with real-time infographics for informed decision-making.

Market Scope

Report Coverage

Details

Page number

195

Base year

2023

Historic period

2018-2022

Forecast period

2024-2028

Growth momentum & CAGR

Accelerate at a CAGR of 34.28%

Market growth 2024-2028

USD 138.66 billion

Market structure

Fragmented

YoY growth 2023-2024(%)

25.64

Regional analysis

North America, Europe, APAC, South America, and Middle East and Africa

Performing market contribution

North America at 36%

Key countries

US, Germany, UK, China, and India

Competitive landscape

Leading Companies, Market Positioning of Companies, Competitive Strategies, and Industry Risks

Key companies profiled

Accenture Plc, Amazon.com Inc., AT and T Inc., Cisco Systems Inc., HCL Technologies Ltd., Huawei Technologies Co. Ltd., Infosys Ltd., Intel Corp., International Business Machines Corp., Microsoft Corp., Nokia Corp., Oracle Corp., ORBCOMM Inc., PTC Inc., Qualcomm Inc., Samsung Electronics Co. Ltd., SAP SE, Siemens AG, Tata Consultancy Services Ltd., and Thales Group

Market dynamics

Parent market analysis, market growth analysis, market research and growth, market growth and forecasting, Market forecasting, Market growth inducers and obstacles, Fast-growing and slow-growing segment analysis, COVID 19 impact and recovery analysis and future consumer dynamics, Market condition analysis for forecast period

Customization purview

If our report has not included the data that you are looking for, you can reach out to our analysts and get segments customized.

View PDF Sample

What are the Key Data Covered in this Market Research Report?

  • CAGR of the market during the forecast period
  • Detailed information on factors that will drive the growth of the market between 2023 and 2028
  • Precise estimation of the size of the market  size and its contribution of the market in focus to the parent market
  • Accurate predictions about upcoming trends and changes in consumer behaviour
  • Growth of the market industry across North America, Europe, APAC, South America, and Middle East and Africa
  • Thorough market report analysis of the market’s competitive landscape and detailed information about companies
  • Comprehensive market forecast analysis of factors that will challenge the growth of market companies

We can help! Our analysts can customize this market research report to meet your requirements. 

Get in touch


1 Executive Summary

  • 1.1 Market overview
    • Executive Summary - Chart on Market Overview
    • Executive Summary - Data Table on Market Overview
    • Executive Summary - Chart on Global Market Characteristics
    • Executive Summary - Chart on Market by Geography
    • Executive Summary - Chart on Market Segmentation by Mode of Transportation
    • Executive Summary - Chart on Market Segmentation by Type
    • Executive Summary - Chart on Incremental Growth
    • Executive Summary - Data Table on Incremental Growth
    • Executive Summary - Chart on Company Market Positioning

2 Market Landscape

  • 2.1 Market ecosystem
    • Parent Market
    • Data Table on - Parent Market
  • 2.2 Market characteristics
    • Market characteristics analysis
  • 2.3 Value chain analysis
    • Value Chain Analysis

3 Market Sizing

  • 3.1 Market definition
    • Offerings of companies included in the market definition
  • 3.2 Market segment analysis
    • Market segments
  • 3.3 Market size 2023
    • 3.4 Market outlook: Forecast for 2023-2028
      • Chart on Global - Market size and forecast 2023-2028 ($ million)
      • Data Table on Global - Market size and forecast 2023-2028 ($ million)
      • Chart on Global Market: Year-over-year growth 2023-2028 (%)
      • Data Table on Global Market: Year-over-year growth 2023-2028 (%)

    4 Historic Market Size

    • 4.1 Global Connected Logistics Market 2018 - 2022
      • Historic Market Size - Data Table on Global Connected Logistics Market 2018 - 2022 ($ million)
    • 4.2 Mode of Transportation segment analysis 2018 - 2022
      • Historic Market Size - Mode of Transportation Segment 2018 - 2022 ($ million)
    • 4.3 Type segment analysis 2018 - 2022
      • Historic Market Size - Type Segment 2018 - 2022 ($ million)
    • 4.4 Geography segment analysis 2018 - 2022
      • Historic Market Size - Geography Segment 2018 - 2022 ($ million)
    • 4.5 Country segment analysis 2018 - 2022
      • Historic Market Size - Country Segment 2018 - 2022 ($ million)

    5 Five Forces Analysis

    • 5.1 Five forces summary
      • Five forces analysis - Comparison between 2023 and 2028
    • 5.2 Bargaining power of buyers
      • Bargaining power of buyers - Impact of key factors 2023 and 2028
    • 5.3 Bargaining power of suppliers
      • Bargaining power of suppliers - Impact of key factors in 2023 and 2028
    • 5.4 Threat of new entrants
      • Threat of new entrants - Impact of key factors in 2023 and 2028
    • 5.5 Threat of substitutes
      • Threat of substitutes - Impact of key factors in 2023 and 2028
    • 5.6 Threat of rivalry
      • Threat of rivalry - Impact of key factors in 2023 and 2028
    • 5.7 Market condition
      • Chart on Market condition - Five forces 2023 and 2028

    6 Market Segmentation by Mode of Transportation

    • 6.1 Market segments
      • Chart on Mode of Transportation - Market share 2023-2028 (%)
      • Data Table on Mode of Transportation - Market share 2023-2028 (%)
    • 6.2 Comparison by Mode of Transportation
      • Chart on Comparison by Mode of Transportation
      • Data Table on Comparison by Mode of Transportation
    • 6.3 Roadways - Market size and forecast 2023-2028
      • Chart on Roadways - Market size and forecast 2023-2028 ($ million)
      • Data Table on Roadways - Market size and forecast 2023-2028 ($ million)
      • Chart on Roadways - Year-over-year growth 2023-2028 (%)
      • Data Table on Roadways - Year-over-year growth 2023-2028 (%)
    • 6.4 Railways - Market size and forecast 2023-2028
      • Chart on Railways - Market size and forecast 2023-2028 ($ million)
      • Data Table on Railways - Market size and forecast 2023-2028 ($ million)
      • Chart on Railways - Year-over-year growth 2023-2028 (%)
      • Data Table on Railways - Year-over-year growth 2023-2028 (%)
    • 6.5 Airways - Market size and forecast 2023-2028
      • Chart on Airways - Market size and forecast 2023-2028 ($ million)
      • Data Table on Airways - Market size and forecast 2023-2028 ($ million)
      • Chart on Airways - Year-over-year growth 2023-2028 (%)
      • Data Table on Airways - Year-over-year growth 2023-2028 (%)
    • 6.6 Waterways - Market size and forecast 2023-2028
      • Chart on Waterways - Market size and forecast 2023-2028 ($ million)
      • Data Table on Waterways - Market size and forecast 2023-2028 ($ million)
      • Chart on Waterways - Year-over-year growth 2023-2028 (%)
      • Data Table on Waterways - Year-over-year growth 2023-2028 (%)
    • 6.7 Market opportunity by Mode of Transportation
      • Market opportunity by Mode of Transportation ($ million)
      • Data Table on Market opportunity by Mode of Transportation ($ million)

    7 Market Segmentation by Type

    • 7.1 Market segments
      • Chart on Type - Market share 2023-2028 (%)
      • Data Table on Type - Market share 2023-2028 (%)
    • 7.2 Comparison by Type
      • Chart on Comparison by Type
      • Data Table on Comparison by Type
    • 7.3 Software services - Market size and forecast 2023-2028
      • Chart on Software services - Market size and forecast 2023-2028 ($ million)
      • Data Table on Software services - Market size and forecast 2023-2028 ($ million)
      • Chart on Software services - Year-over-year growth 2023-2028 (%)
      • Data Table on Software services - Year-over-year growth 2023-2028 (%)
    • 7.4 IT services - Market size and forecast 2023-2028
      • Chart on IT services - Market size and forecast 2023-2028 ($ million)
      • Data Table on IT services - Market size and forecast 2023-2028 ($ million)
      • Chart on IT services - Year-over-year growth 2023-2028 (%)
      • Data Table on IT services - Year-over-year growth 2023-2028 (%)
    • 7.5 Hardware services - Market size and forecast 2023-2028
      • Chart on Hardware services - Market size and forecast 2023-2028 ($ million)
      • Data Table on Hardware services - Market size and forecast 2023-2028 ($ million)
      • Chart on Hardware services - Year-over-year growth 2023-2028 (%)
      • Data Table on Hardware services - Year-over-year growth 2023-2028 (%)
    • 7.6 Market opportunity by Type
      • Market opportunity by Type ($ million)
      • Data Table on Market opportunity by Type ($ million)

    8 Customer Landscape

    • 8.1 Customer landscape overview
      • Analysis of price sensitivity, lifecycle, customer purchase basket, adoption rates, and purchase criteria

    9 Geographic Landscape

    • 9.1 Geographic segmentation
      • Chart on Market share by geography 2023-2028 (%)
      • Data Table on Market share by geography 2023-2028 (%)
    • 9.2 Geographic comparison
      • Chart on Geographic comparison
      • Data Table on Geographic comparison
    • 9.3 North America - Market size and forecast 2023-2028
      • Chart on North America - Market size and forecast 2023-2028 ($ million)
      • Data Table on North America - Market size and forecast 2023-2028 ($ million)
      • Chart on North America - Year-over-year growth 2023-2028 (%)
      • Data Table on North America - Year-over-year growth 2023-2028 (%)
    • 9.4 Europe - Market size and forecast 2023-2028
      • Chart on Europe - Market size and forecast 2023-2028 ($ million)
      • Data Table on Europe - Market size and forecast 2023-2028 ($ million)
      • Chart on Europe - Year-over-year growth 2023-2028 (%)
      • Data Table on Europe - Year-over-year growth 2023-2028 (%)
    • 9.5 APAC - Market size and forecast 2023-2028
      • Chart on APAC - Market size and forecast 2023-2028 ($ million)
      • Data Table on APAC - Market size and forecast 2023-2028 ($ million)
      • Chart on APAC - Year-over-year growth 2023-2028 (%)
      • Data Table on APAC - Year-over-year growth 2023-2028 (%)
    • 9.6 South America - Market size and forecast 2023-2028
      • Chart on South America - Market size and forecast 2023-2028 ($ million)
      • Data Table on South America - Market size and forecast 2023-2028 ($ million)
      • Chart on South America - Year-over-year growth 2023-2028 (%)
      • Data Table on South America - Year-over-year growth 2023-2028 (%)
    • 9.7 Middle East and Africa - Market size and forecast 2023-2028
      • Chart on Middle East and Africa - Market size and forecast 2023-2028 ($ million)
      • Data Table on Middle East and Africa - Market size and forecast 2023-2028 ($ million)
      • Chart on Middle East and Africa - Year-over-year growth 2023-2028 (%)
      • Data Table on Middle East and Africa - Year-over-year growth 2023-2028 (%)
    • 9.8 US - Market size and forecast 2023-2028
      • Chart on US - Market size and forecast 2023-2028 ($ million)
      • Data Table on US - Market size and forecast 2023-2028 ($ million)
      • Chart on US - Year-over-year growth 2023-2028 (%)
      • Data Table on US - Year-over-year growth 2023-2028 (%)
    • 9.9 Germany - Market size and forecast 2023-2028
      • Chart on Germany - Market size and forecast 2023-2028 ($ million)
      • Data Table on Germany - Market size and forecast 2023-2028 ($ million)
      • Chart on Germany - Year-over-year growth 2023-2028 (%)
      • Data Table on Germany - Year-over-year growth 2023-2028 (%)
    • 9.10 UK - Market size and forecast 2023-2028
      • Chart on UK - Market size and forecast 2023-2028 ($ million)
      • Data Table on UK - Market size and forecast 2023-2028 ($ million)
      • Chart on UK - Year-over-year growth 2023-2028 (%)
      • Data Table on UK - Year-over-year growth 2023-2028 (%)
    • 9.11 China - Market size and forecast 2023-2028
      • Chart on China - Market size and forecast 2023-2028 ($ million)
      • Data Table on China - Market size and forecast 2023-2028 ($ million)
      • Chart on China - Year-over-year growth 2023-2028 (%)
      • Data Table on China - Year-over-year growth 2023-2028 (%)
    • 9.12 India - Market size and forecast 2023-2028
      • Chart on India - Market size and forecast 2023-2028 ($ million)
      • Data Table on India - Market size and forecast 2023-2028 ($ million)
      • Chart on India - Year-over-year growth 2023-2028 (%)
      • Data Table on India - Year-over-year growth 2023-2028 (%)
    • 9.13 Market opportunity by geography
      • Market opportunity by geography ($ million)
      • Data Tables on Market opportunity by geography ($ million)

    10 Drivers, Challenges, and Opportunity/Restraints

    • 10.1 Market drivers
      • 10.2 Market challenges
        • 10.3 Impact of drivers and challenges
          • Impact of drivers and challenges in 2023 and 2028
        • 10.4 Market opportunities/restraints

          11 Competitive Landscape

          • 11.1 Overview
            • 11.2 Competitive Landscape
              • Overview on criticality of inputs and factors of differentiation
            • 11.3 Landscape disruption
              • Overview on factors of disruption
            • 11.4 Industry risks
              • Impact of key risks on business

            12 Competitive Analysis

            • 12.1 Companies profiled
              • Companies covered
            • 12.2 Market positioning of companies
              • Matrix on companies position and classification
            • 12.3 Accenture Plc
              • Accenture Plc - Overview
              • Accenture Plc - Business segments
              • Accenture Plc - Key news
              • Accenture Plc - Key offerings
              • Accenture Plc - Segment focus
            • 12.4 Amazon.com Inc.
              • Amazon.com Inc. - Overview
              • Amazon.com Inc. - Business segments
              • Amazon.com Inc. - Key news
              • Amazon.com Inc. - Key offerings
              • Amazon.com Inc. - Segment focus
            • 12.5 AT and T Inc.
              • AT and T Inc. - Overview
              • AT and T Inc. - Business segments
              • AT and T Inc. - Key news
              • AT and T Inc. - Key offerings
              • AT and T Inc. - Segment focus
            • 12.6 Cisco Systems Inc.
              • Cisco Systems Inc. - Overview
              • Cisco Systems Inc. - Business segments
              • Cisco Systems Inc. - Key news
              • Cisco Systems Inc. - Key offerings
              • Cisco Systems Inc. - Segment focus
            • 12.7 HCL Technologies Ltd.
              • HCL Technologies Ltd. - Overview
              • HCL Technologies Ltd. - Business segments
              • HCL Technologies Ltd. - Key news
              • HCL Technologies Ltd. - Key offerings
              • HCL Technologies Ltd. - Segment focus
            • 12.8 Huawei Technologies Co. Ltd.
              • Huawei Technologies Co. Ltd. - Overview
              • Huawei Technologies Co. Ltd. - Product / Service
              • Huawei Technologies Co. Ltd. - Key news
              • Huawei Technologies Co. Ltd. - Key offerings
            • 12.9 Infosys Ltd.
              • Infosys Ltd. - Overview
              • Infosys Ltd. - Business segments
              • Infosys Ltd. - Key news
              • Infosys Ltd. - Key offerings
              • Infosys Ltd. - Segment focus
            • 12.10 International Business Machines Corp.
              • International Business Machines Corp. - Overview
              • International Business Machines Corp. - Business segments
              • International Business Machines Corp. - Key news
              • International Business Machines Corp. - Key offerings
              • International Business Machines Corp. - Segment focus
            • 12.11 Microsoft Corp.
              • Microsoft Corp. - Overview
              • Microsoft Corp. - Business segments
              • Microsoft Corp. - Key news
              • Microsoft Corp. - Key offerings
              • Microsoft Corp. - Segment focus
            • 12.12 Nokia Corp.
              • Nokia Corp. - Overview
              • Nokia Corp. - Business segments
              • Nokia Corp. - Key news
              • Nokia Corp. - Key offerings
              • Nokia Corp. - Segment focus
            • 12.13 Oracle Corp.
              • Oracle Corp. - Overview
              • Oracle Corp. - Business segments
              • Oracle Corp. - Key news
              • Oracle Corp. - Key offerings
              • Oracle Corp. - Segment focus
            • 12.14 Samsung Electronics Co. Ltd.
              • Samsung Electronics Co. Ltd. - Overview
              • Samsung Electronics Co. Ltd. - Business segments
              • Samsung Electronics Co. Ltd. - Key news
              • Samsung Electronics Co. Ltd. - Key offerings
              • Samsung Electronics Co. Ltd. - Segment focus
            • 12.15 SAP SE
              • SAP SE - Overview
              • SAP SE - Business segments
              • SAP SE - Key news
              • SAP SE - Key offerings
              • SAP SE - Segment focus
            • 12.16 Siemens AG
              • Siemens AG - Overview
              • Siemens AG - Business segments
              • Siemens AG - Key news
              • Siemens AG - Key offerings
              • Siemens AG - Segment focus
            • 12.17 Thales Group
              • Thales Group - Overview
              • Thales Group - Business segments
              • Thales Group - Key news
              • Thales Group - Key offerings
              • Thales Group - Segment focus

            13 Appendix

            • 13.1 Scope of the report
              • 13.2 Inclusions and exclusions checklist
                • Inclusions checklist
                • Exclusions checklist
              • 13.3 Currency conversion rates for US$
                • Currency conversion rates for US$
              • 13.4 Research methodology
                • Research methodology
              • 13.5 Data procurement
                • Information sources
              • 13.6 Data validation
                • Data validation
              • 13.7 Validation techniques employed for market sizing
                • Validation techniques employed for market sizing
              • 13.8 Data synthesis
                • Data synthesis
              • 13.9 360 degree market analysis
                • 360 degree market analysis
              • 13.10 List of abbreviations
                • List of abbreviations

              Research Methodology

              Technavio presents a detailed picture of the market by way of study, synthesis, and summation of data from multiple sources. The analysts have presented the various facets of the market with a particular focus on identifying the key industry influencers. The data thus presented is comprehensive, reliable, and the result of extensive research, both primary and secondary.

              INFORMATION SOURCES

              Primary sources

              • Manufacturers and suppliers
              • Channel partners
              • Industry experts
              • Strategic decision makers

              Secondary sources

              • Industry journals and periodicals
              • Government data
              • Financial reports of key industry players
              • Historical data
              • Press releases

              DATA ANALYSIS

              Data Synthesis

              • Collation of data
              • Estimation of key figures
              • Analysis of derived insights

              Data Validation

              • Triangulation with data models
              • Reference against proprietary databases
              • Corroboration with industry experts

              REPORT WRITING

              Qualitative

              • Market drivers
              • Market challenges
              • Market trends
              • Five forces analysis

              Quantitative

              • Market size and forecast
              • Market segmentation
              • Geographical insights
              • Competitive landscape

              Interested in this report?

              Get your sample now to see our research methodology and insights!

              Download Now

              Frequently Asked Questions

              Connected Logistics market growth will increase by $ 138657.5 mn during 2024-2028 .

              The Connected Logistics market is expected to grow at a CAGR of 34.28% during 2024-2028 .

              Connected Logistics market is segmented by Mode Of Transportation( Roadways, Railways, Airways, Waterways) Type( Software services, IT services, Hardware services, Others)

              Accenture Plc, Amazon.com Inc., AT and T Inc., Cisco Systems Inc., HCL Technologies Ltd., Huawei Technologies Co. Ltd., Infosys Ltd., Intel Corp., International Business Machines Corp., Microsoft Corp., Nokia Corp., Oracle Corp., ORBCOMM Inc., PTC Inc., Qualcomm Inc., Samsung Electronics Co. Ltd., SAP SE, Siemens AG, Tata Consultancy Services Ltd., Thales Group are a few of the key vendors in the Connected Logistics market.

              North America will register the highest growth rate of 36% among the other regions. Therefore, the Connected Logistics market in North America is expected to garner significant business opportunities for the vendors during the forecast period.

              US, Germany, UK, China, India

              • Effective management of temperature-sensitive productsEffective management of temperature-sensitive products in connected logistics is crucial for ensuring the quality is the driving factor this market.
              • efficacy is the driving factor this market.
              • and safety of perishable items is the driving factor this market.
              • pharmaceuticals is the driving factor this market.
              • vaccines is the driving factor this market.
              • and more. Cold chain logistics is the driving factor this market.
              • specialized in handling temperature-sensitive goods is the driving factor this market.
              • plays a vital role in maintaining the required temperature conditions throughout the supply chain.Cold chain logistics involves the specialized management of temperature-sensitive goods throughout the supply chain is the driving factor this market.
              • ensuring that they maintain their required temperature conditions to preserve their quality is the driving factor this market.
              • efficacy is the driving factor this market.
              • and safety. This involves a series of controlled temperature environments is the driving factor this market.
              • refrigeration equipment is the driving factor this market.
              • monitoring systems is the driving factor this market.
              • and protocols to maintain the desired temperature range from the point of origin to the final destination.Key components of effective managementTemperature monitoring and control: Utilizing temperature monitoring devices and control mechanisms to prevent temperature excursions that could compromise product integrity.Packaging and insulation: Employing specialized packaging materials with insulating properties to protect goods from external factors and maintain desired temperatures.Inventory management: Implementing efficient stock rotation practices and real-time monitoring to prevent product expiration and minimize waste.Order fulfillment and distribution: Ensuring proper handling is the driving factor this market.
              • adherence to temperature control measures is the driving factor this market.
              • and effective route planning to maintain product integrity during transportation.Supplier management: Selecting reliable suppliers capable of maintaining required temperature conditions throughout the supply chain.Challenges and solutionsCommon challenges: External factors is the driving factor this market.
              • mechanical failures is the driving factor this market.
              • jurisdictional differences is the driving factor this market.
              • and seasonal fluctuations pose challenges in temperature-controlled transport.Solutions: Utilizing robust temperature-control solutions such as refrigerated units is the driving factor this market.
              • tank containers is the driving factor this market.
              • and deep-freeze units to overcome challenges and ensure product safety.Importance of effective managementPreserves product quality: Maintains freshness is the driving factor this market.
              • extends shelf life is the driving factor this market.
              • and reduces inventory losses.Guarantees compliance: Ensures adherence to regulations is the driving factor this market.
              • quality assurance protocols is the driving factor this market.
              • and industry standards.Ensures public health and safety: Protects consumers from contaminated or compromised products is the driving factor this market.
              • fostering trust and loyalty.Impact of ineffective managementThe lack of efficient supply chain systems is the driving factor this market.
              • especially in developing countries is the driving factor this market.
              • is primarily responsible for the wastage of products such as food is the driving factor this market.
              • vaccines is the driving factor this market.
              • and other temperature-sensitive items. This wastage creates a scarcity of drugs and hampers the treatment process in healthcare service and delivery centers. Vaccines that are not stored under desired temperatures are rendered ineffective and discarded permanently. Food wastage also significantly affects the growth of the food industry is the driving factor this market.
              • with the Food and Agriculture Organization (FAO) UN report indicating that 1.6 billion tons of primary food products are wasted annually is the driving factor this market.
              • resulting in an approximate loss of $750 billion in monetary terms. Furthermore is the driving factor this market.
              • food wastage causes critical damage to the environment due to inappropriate waste disposal methods.Role of technologyOrganizations are investing in technologies to address these issues. These technologies include smart refrigerator systems powered by IoT is the driving factor this market.
              • analytics is the driving factor this market.
              • and cloud computing solutions. Connected logistics systems for perishable products that are temperature sensitive are specifically designed to manage these products in fluctuating climatic conditions. Technology is playing an important role in the effective management of food and vaccines is the driving factor this market.
              • with medical refrigerator systems designed to store vaccines safely in remote areas and developing nations. As a result is the driving factor this market.
              • the effective management of temperature-sensitive products offered by connected logistics is expected to drive the growth of the global connected logistics market during the forecast period. is the driving factor this market.

              The Connected Logistics market vendors should focus on grabbing business opportunities from the Roadways segment as it accounted for the largest market share in the base year.