Consumer Packaged Goods Market Size 2025-2029
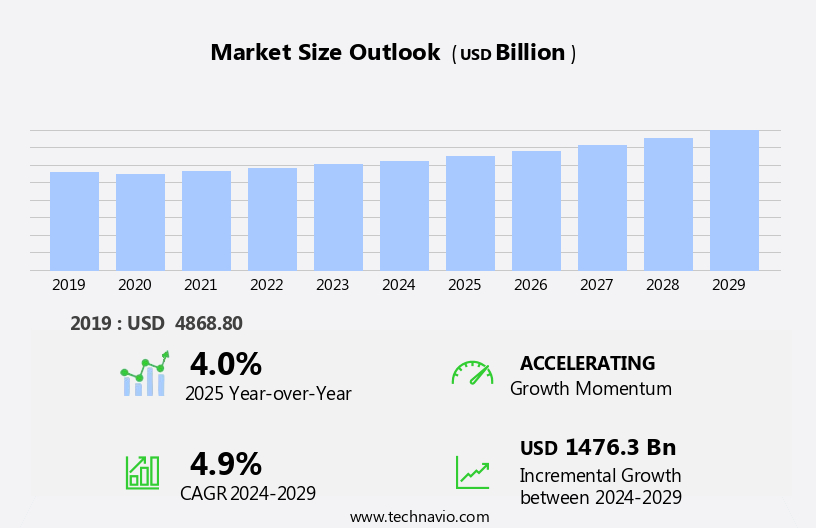
The consumer packaged goods (CPG) market size is forecast to increase by USD 1476.3 billion, at a CAGR of 4.9% between 2024 and 2029.
- The market is experiencing significant shifts driven by the increasing sales of CPG products through e-commerce channels and the emergence of direct-to-consumer (D2C) brands. This digital transformation poses both opportunities and challenges for market participants. On the one hand, e-commerce sales growth presents a lucrative avenue for CPG companies to expand their customer base and reach new demographics. On the other hand, D2C brands, with their agile business models and direct consumer connections, are disrupting traditional CPG market dynamics. However, the market landscape is not without challenges. Global inflation and supply chain disruptions are pressing issues that threaten profitability and operational efficiency.
- Companies must navigate these challenges by implementing pricing strategies that balance consumer affordability with profitability, and by strengthening their supply chain resilience through strategic partnerships and technology investments. In conclusion, the CPG market is undergoing a period of transformation, driven by digital trends and disrupted by new business models. To capitalize on opportunities and navigate challenges effectively, companies must remain agile, innovative, and consumer-centric.
What will be the Size of the Consumer Packaged Goods (CPG) Market during the forecast period?
Explore in-depth regional segment analysis with market size data - historical 2019-2023 and forecasts 2025-2029 - in the full report.
Request Free Sample
In the dynamic and ever-evolving the market, various sectors continually adapt to emerging trends and market conditions. Nutritional supplements, for instance, experience fluctuations in consumer demand based on health consciousness levels. Price elasticity influences the pricing strategies of fast-moving consumer goods (FMCG), affecting both grocery products and non-durable items. Consumer trends shape the beverage industry, with preferences leaning towards healthier options and sustainable packaging. Supply chain management remains a critical focus, ensuring food safety regulations are met and product innovation is executed efficiently. Consumer perception drives packaging design and data analytics, while dairy products undergo product lifecycle management and snacks and confectionery face increasing competition from private label brands.
E-commerce platforms reshape retail distribution, requiring marketing strategies tailored to the digital landscape. Consumer insights inform advertising campaigns, while ethical sourcing and sustainability initiatives gain traction across various sectors, including cosmetics and toiletries, household cleaners, and paper products. The health and wellness trend influences the value proposition of household goods and packaged food, as well as baby care products. Sales forecasting relies on understanding product differentiation and brand loyalty, with customer experience and ingredient transparency becoming increasingly important factors. The CPG market's continuous dynamism underscores the importance of adaptability and responsiveness to shifting consumer preferences and market conditions.
How is this Consumer Packaged Goods (CPG) Industry segmented?
The consumer packaged goods (CPG) industry research report provides comprehensive data (region-wise segment analysis), with forecasts and estimates in "USD billion" for the period 2025-2029, as well as historical data from 2019-2023 for the following segments.
- Product
- Food and beverages
- Personal care and cosmetics
- Household supplies
- Pharmaceuticals
- Others
- Distribution Channel
- Offline
- Online
- End-use
- Household Consumers
- Commercial Users
- Institutional Buyers
- Others
- Packaging Type
- Plastic Packaging
- Paperboard Packaging
- Glass Packaging
- Metal Packaging
- Others
- Geography
- North America
- US
- Canada
- Europe
- France
- Germany
- Italy
- UK
- Middle East and Africa
- Egypt
- KSA
- Oman
- UAE
- APAC
- China
- India
- Japan
- South America
- Argentina
- Brazil
- Rest of World (ROW)
- North America
By Product Insights
The food and beverages segment is estimated to witness significant growth during the forecast period.
In today's fast-paced world, consumers prioritize convenience and affordability, driving the demand for consumer packaged goods (CPG). This market encompasses a wide range of products, including grocery items, beverages, personal care, and household essentials. The beverage industry, with its fast-moving consumer goods, caters to the growing trend of on-the-go consumption. Longer shelf lives of packaged foods and beverages cater to consumers' busy lifestyles and reduce food waste. Sustainability is a significant consumer trend, and CPG companies focus on extending product shelf life to align with this goal. Price elasticity plays a crucial role in CPG market dynamics.
Consumers are price-sensitive, particularly for non-durable goods like snacks and confectionery. Private label brands offer competitive pricing, challenging established brands. E-commerce platforms provide consumers with the convenience of shopping from home, influencing market penetration. Supply chain management is essential for CPG companies to ensure product availability and timely delivery. Product innovation, driven by consumer insights, is a key marketing strategy to maintain brand loyalty. Food safety regulations and ingredient transparency are critical factors influencing consumer perception. Packaging design and data analytics are essential tools for companies to differentiate their products and optimize sales forecasting. Dairy products, frozen foods, paper products, and household cleaners are some CPG categories that offer significant growth opportunities.
Health and wellness trends have led to the increasing popularity of nutritional supplements and personal hygiene products. Ethical sourcing and sustainability initiatives are essential for brand equity. Over-the-counter medications, cosmetics and toiletries, and baby care products are other essential CPG categories. Product lifecycle management is crucial for CPG companies to manage their product offerings effectively. Consumer staples like packaged food, household goods, and baby care products have a stable demand. Sales forecasting and retail distribution are essential for managing inventory and optimizing shelf space allocation. Product labeling and advertising campaigns are essential for effective consumer communication.
In conclusion, the CPG market is dynamic and evolving, driven by consumer trends, price elasticity, and supply chain management. Companies that effectively manage product innovation, sustainability, and consumer insights will thrive in this competitive landscape.
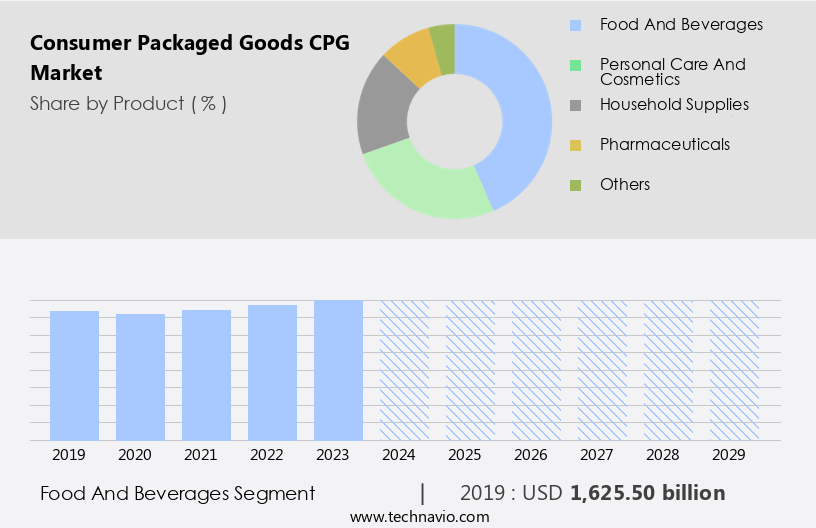
The Food and beverages segment was valued at USD 1625.50 billion in 2019 and showed a gradual increase during the forecast period.
Regional Analysis
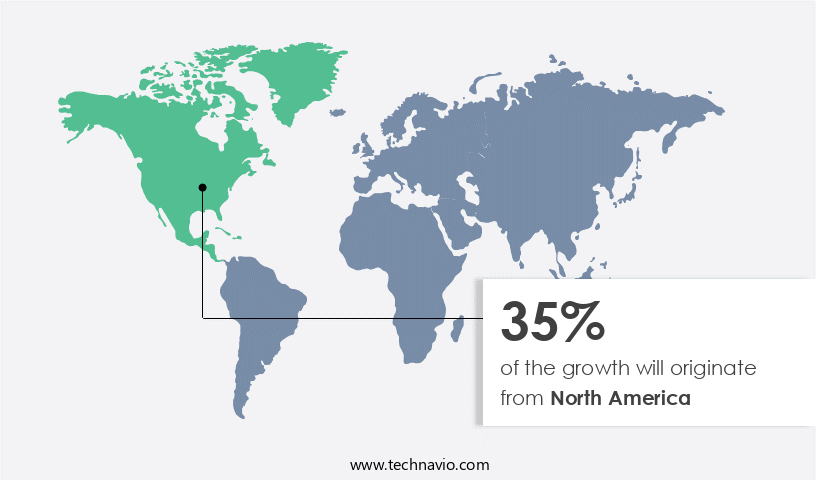
North America is estimated to contribute 35% to the growth of the global market during the forecast period.Technavio's analysts have elaborately explained the regional trends and drivers that shape the market during the forecast period.
The North American market is undergoing significant growth, shaped by various influencing factors. Consumer segmentation, driven by rising disposable incomes and changing lifestyles in the US and Canada, is a key growth driver. This trend is particularly prominent in the demand for convenience-oriented products, which dominate the CPG sector. Furthermore, health consciousness among consumers has fueled the surge in demand for healthy and organic CPG offerings. Fast-moving consumer goods, such as packaged foods and beverages, are experiencing rapid growth due to their convenience and readiness. The aging population in North America seeks these options for meals, snacks, and household needs, contributing to regional market expansion.
Consumer trends indicate a preference for healthier alternatives, leading to increased innovation in the CPG industry. Supply chain management plays a crucial role in ensuring the availability and accessibility of CPG products. The beverage industry, grocery products, and snacks and confectionery sectors are particularly reliant on efficient supply chain operations. Consumer trends, such as the demand for transparency and ethical sourcing, are influencing supply chain strategies. Consumer perception and packaging design are essential factors in CPG market success. Data analytics and product labeling help companies understand consumer preferences and tailor their offerings accordingly. Food safety regulations and ingredient transparency are critical considerations for both manufacturers and consumers.
Marketing strategies, such as promotional activities and advertising campaigns, are vital in penetrating the market and building brand equity. Market penetration is also influenced by private label brands and e-commerce platforms, which offer competitive pricing and convenience. The CPG market encompasses a wide range of products, including dairy products, personal hygiene items, nutritional supplements, over-the-counter medications, cosmetics and toiletries, and household cleaners. Product lifecycle management and sales forecasting are essential for managing inventory and meeting consumer demand. Product differentiation and brand loyalty are crucial factors in the CPG market. Consumer experience, sustainability initiatives, and value proposition are key differentiators for brands.
Household goods, packaged food, baby care products, and consumer staples are some of the most popular categories in the market. In conclusion, the North American CPG market is experiencing growth driven by factors such as changing consumer lifestyles, health consciousness, and convenience. The industry is responding to these trends through product innovation, supply chain management, and marketing strategies. Consumer insights and data analytics are essential tools for companies looking to succeed in this dynamic market.
Market Dynamics
Our researchers analyzed the data with 2024 as the base year, along with the key drivers, trends, and challenges. A holistic analysis of drivers will help companies refine their marketing strategies to gain a competitive advantage.
What are the key market drivers leading to the rise in the adoption of Consumer Packaged Goods (CPG) Industry?
- The significant growth in electronic sales of consumer packaged goods (CPG) represents the primary market driver.
- In the market, e-commerce platforms have significantly transformed the retail landscape by offering consumers the convenience of shopping for CPG products from anywhere, anytime. This eliminates geographical limitations and provides access to a wider range of brands and products compared to traditional brick-and-mortar stores. E-commerce is projected to account for approximately 40%-42% of global retail sales by 2027. E-commerce facilitates direct-to-consumer (D2C) sales models, enabling companies to establish a closer relationship with their customers. This direct connection allows for personalized communication, feedback collection, and the ability to adapt products based on real-time market insights. companies can leverage targeted advertising and promotions to reach specific customer segments, driving brand awareness and loyalty.
- Customer segmentation plays a crucial role in the CPG industry, as companies aim to cater to diverse consumer preferences. Price elasticity, influenced by consumer trends, varies across different customer segments. Fast-moving consumer goods (FMCG), such as grocery products and beverages, are particularly popular in the e-commerce space due to their high demand and frequent purchase frequency. Supply chain management is essential in the CPG industry, ensuring the timely delivery of products to meet consumer demand. Product innovation, including food safety regulations, consumer perception, and packaging design, are critical factors influencing market dynamics. companies must stay updated on these trends to remain competitive and meet evolving consumer expectations.
What are the market trends shaping the Consumer Packaged Goods (CPG) Industry?
- Direct-to-consumer (D2C) brands are gaining significant traction in the market, representing an emerging trend. This shift towards D2C businesses allows companies to cut out intermediaries and sell products directly to consumers.
- The market is undergoing significant transformation with the emergence of Direct-to-Consumer (D2C) brands. These brands are disrupting traditional business models by eliminating intermediaries, enabling direct consumer engagement. This streamlined supply chain empowers brands to have greater control over product offerings and pricing. D2C brands utilize digital platforms to connect with consumers, fostering personalized marketing strategies and insights into consumer preferences. The resulting data analytics provide valuable consumer insights, shaping product development and innovation. Market penetration is enhanced through private label brands and e-commerce platforms, offering competitive price premiums and convenience.
- As marketing strategies evolve, D2C brands emphasize consumer engagement, fostering harmonious relationships and prioritizing consumer insights. Dairy products, snacks and confectionery, personal hygiene, and other CPG categories are witnessing this shift, with D2C brands leveraging data-driven marketing to capture market share.
What challenges does the Consumer Packaged Goods (CPG) Industry face during its growth?
- The convergence of global inflation and supply chain disruptions poses a significant challenge to the industry, impeding its growth trajectory.
- The market, comprising sectors such as nutritional supplements, over-the-counter medications, cosmetics and toiletries, food and beverage, household cleaners, paper products, and more, is experiencing significant challenges due to global events. Supply chain disruptions, triggered by the COVID-19 pandemic and the Russia-Ukraine conflict, have caused delays, shortages, and escalating logistics costs. These disruptions put pressure on CPG companies, threatening their profit margins and hindering long-term growth strategies and innovation. Moreover, inflationary pressures persist, fueled by factors including rising commodity prices, transportation costs, and labor expenses. Ethical sourcing and sustainability initiatives have become increasingly important for brands seeking to maintain consumer trust and loyalty.
- As such, CPG companies are focusing on transparency and accountability in their supply chains, ensuring ethical sourcing and reducing their carbon footprint through various sustainability initiatives. Promotional activities and innovation remain essential for CPG companies to differentiate themselves in a competitive market. Non-durable goods, such as food and beverage, frozen foods, and paper products, continue to dominate the CPG landscape, with consumers seeking convenience, affordability, and quality. The market's dynamics necessitate agility, resilience, and a forward-thinking approach to navigate the challenges and capitalize on opportunities.
Exclusive Customer Landscape
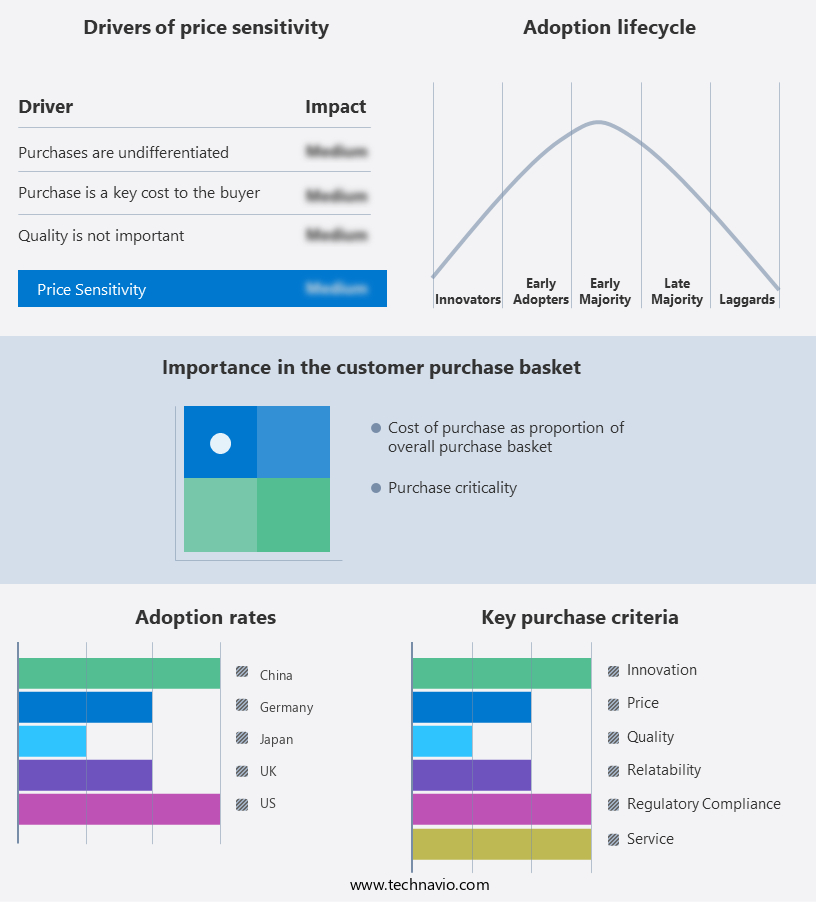
The consumer packaged goods (cpg) market forecasting report includes the adoption lifecycle of the market, covering from the innovator's stage to the laggard's stage. It focuses on adoption rates in different regions based on penetration. Furthermore, the consumer packaged goods (cpg) market report also includes key purchase criteria and drivers of price sensitivity to help companies evaluate and develop their market growth analysis strategies.
Customer Landscape
Key Companies & Market Insights
Companies are implementing various strategies, such as strategic alliances, consumer packaged goods (cpg) market forecast, partnerships, mergers and acquisitions, geographical expansion, and product/service launches, to enhance their presence in the industry.
The industry research and growth report includes detailed analyses of the competitive landscape of the market and information about key companies, including:
- Coca-Cola Company
- Colgate-Palmolive
- Danone
- General Mills
- Henkel AG
- Johnson & Johnson
- Kimberly-Clark
- Kraft Heinz
- L'Oréal
- Mars Incorporated
- Mondelez International
- Nestlé
- PepsiCo
- Procter & Gamble
- Reckitt Benckiser
- S.C. Johnson & Son
- The Clorox Company
- Unilever
- Yamazaki Baking
- Yili Group
Qualitative and quantitative analysis of companies has been conducted to help clients understand the wider business environment as well as the strengths and weaknesses of key industry players. Data is qualitatively analyzed to categorize companies as pure play, category-focused, industry-focused, and diversified; it is quantitatively analyzed to categorize companies as dominant, leading, strong, tentative, and weak.
Recent Development and News in Consumer Packaged Goods (CPG) Market
- In February 2024, Unilever, a leading player in the market, announced the launch of its new plant-based meat alternative brand, The Vegetarian Butcher, in the United States (Unilever Press Release, 2024). This expansion marks a significant strategic move to cater to the growing demand for sustainable and ethical food options in the region.
- In March 2025, Procter & Gamble (P&G) and L'Oréal, two major CPG giants, formed a strategic partnership to co-create and co-develop sustainable and innovative personal care products (P&G Press Release, 2025). This collaboration is expected to result in the reduction of carbon emissions and water usage in their respective supply chains, aligning with the global push towards more sustainable business practices.
- In May 2024, Nestlé, the world's largest food and beverage company, completed the acquisition of Aimmune Therapeutics, a biotech firm specializing in food allergies, for approximately USD2.6 billion (Bloomberg, 2024). This acquisition is a significant step for Nestlé to expand its presence in the medical nutrition sector and address the growing demand for food allergy treatments.
- In January 2025, the European Union (EU) approved the use of QR codes on food packaging to provide consumers with detailed information about the product's origin, production methods, and nutritional information (European Commission, 2025). This regulatory initiative is a significant shift towards transparency and consumer empowerment in the CPG market.
Research Analyst Overview
- The market is characterized by dynamic trends and evolving consumer preferences. Packaging materials continue to influence purchasing decisions, with sustainability and convenience being key factors. Sales promotions and product reviews shape consumer behavior, driving sales growth. Digital marketing and retail analytics provide valuable insights into shopper trends, enabling effective trade marketing and inventory management. Social media marketing and influencer partnerships broaden reach and engagement. Distribution networks and logistics and transportation ensure timely product delivery. Consumer behavior analysis informs promotional campaigns, personalized marketing, and loyalty programs.
- Pricing strategies and subscription models cater to price-sensitive consumers. Product development and innovation pipeline are crucial for staying competitive. Quality control and customer relationship management maintain brand reputation. Omni-channel strategy integrates various sales channels, providing seamless shopping experiences. Shopper insights and ingredient sourcing guide product development. Manufacturing processes and content marketing enhance brand transparency. Customer feedback shapes continuous improvement and product adoption.
Dive into Technavio's robust research methodology, blending expert interviews, extensive data synthesis, and validated models for unparalleled Consumer Packaged Goods (CPG) Market insights. See full methodology.
|
Market Scope |
|
|
Report Coverage |
Details |
|
Page number |
207 |
|
Base year |
2024 |
|
Historic period |
2019-2023 |
|
Forecast period |
2025-2029 |
|
Growth momentum & CAGR |
Accelerate at a CAGR of 4.9% |
|
Market growth 2025-2029 |
USD 1476.3 billion |
|
Market structure |
Fragmented |
|
YoY growth 2024-2025(%) |
4.0 |
|
Key countries |
US, Canada, Germany, UK, Italy, France, China, India, Japan, Brazil, Egypt, UAE, Oman, Argentina, KSA, UAE, Brazil, and Rest of World (ROW) |
|
Competitive landscape |
Leading Companies, Market Positioning of Companies, Competitive Strategies, and Industry Risks |
What are the Key Data Covered in this Consumer Packaged Goods (CPG) Market Research and Growth Report?
- CAGR of the Consumer Packaged Goods (CPG) industry during the forecast period
- Detailed information on factors that will drive the growth and forecasting between 2025 and 2029
- Precise estimation of the size of the market and its contribution of the industry in focus to the parent market
- Accurate predictions about upcoming growth and trends and changes in consumer behaviour
- Growth of the market across North America, Europe, APAC, South America, and Middle East and Africa
- Thorough analysis of the market's competitive landscape and detailed information about companies
- Comprehensive analysis of factors that will challenge the consumer packaged goods (CPG) market growth of industry companies
We can help! Our analysts can customize this consumer packaged goods (CPG) market research report to meet your requirements.
 RIA -
RIA - 
