Containers Market Size 2024-2028
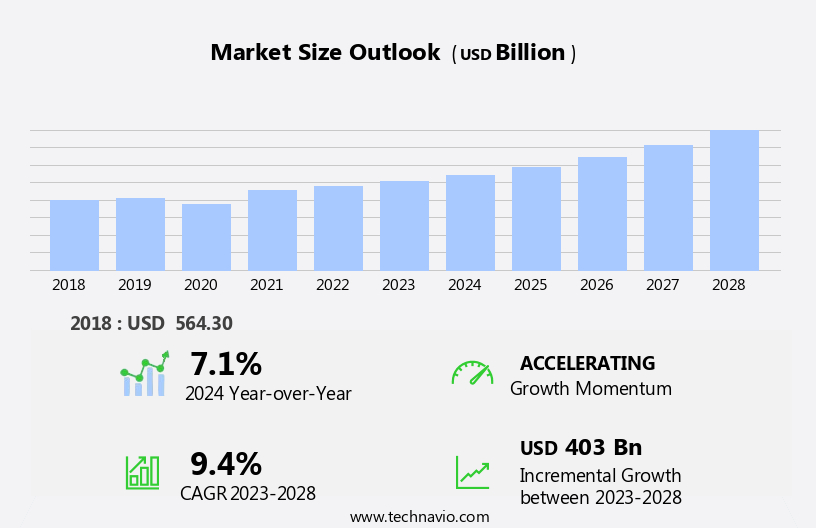
The containers market size is forecast to increase by USD 403 billion at a CAGR of 9.4% between 2023 and 2028.
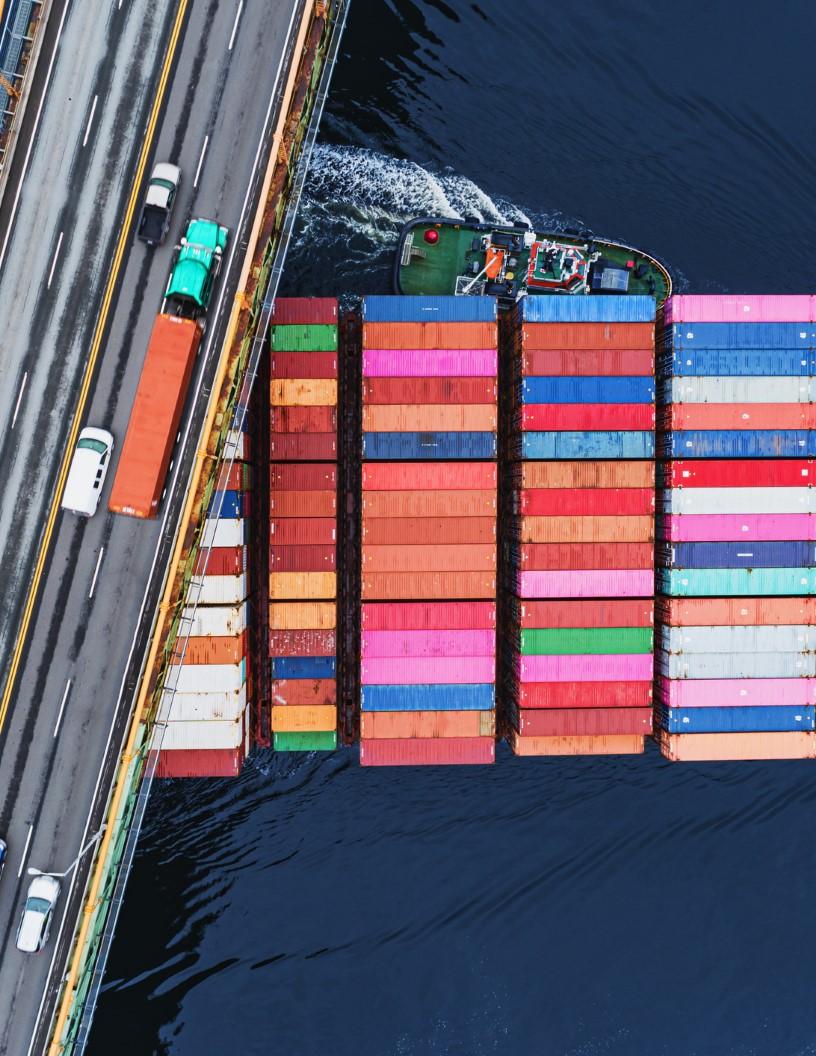
	- The global containers and packaging market is experiencing steady growth, driven by rising demand from the e-commerce sector and increasing adoption of sustainable packaging solutions. Shifts in consumer behavior, such as a preference for eco-friendly materials, and technological advancements in manufacturing processes are key factors fueling this expansion. The market is experiencing significant growth due to the expansion of global e-commerce, leading to increased demand for cargo shipping. Key trends in the market include the adoption of alternative fuels, such as LNG and biofuels, to reduce carbon emissions. 
 
	- Additionally, the use of blockchain technology in container logistics is gaining traction to enhance transparency and security. This report provides a detailed look at the market, offering data on current size, growth forecasts through 2028, and analysis of critical segments like food packaging and rigid plastics. It highlights key trends such as growing innovation in recyclable materials while addressing a significant challenge: supply chain disruptions impacting production costs. 
 
What will be the Size of the Containers Market During the Forecast Period?

 Request Free Sample
With insights tailored for strategic planning, client engagement, and operational efficiency, the report equips businesses with the tools to navigate competition and capitalize on emerging opportunities. In a dynamic global business landscape, this resource delivers actionable intelligence to address trends and challenges, ensuring companies remain competitive in the evolving containers and packaging market.
How is this Containers Industry segmented and which is the largest segment?
The containers industry research report provides comprehensive data (region-wise segment analysis), with forecasts and estimates in "USD billion" for the period 2024-2028, as well as historical data from 2018-2022 for the following segments. 
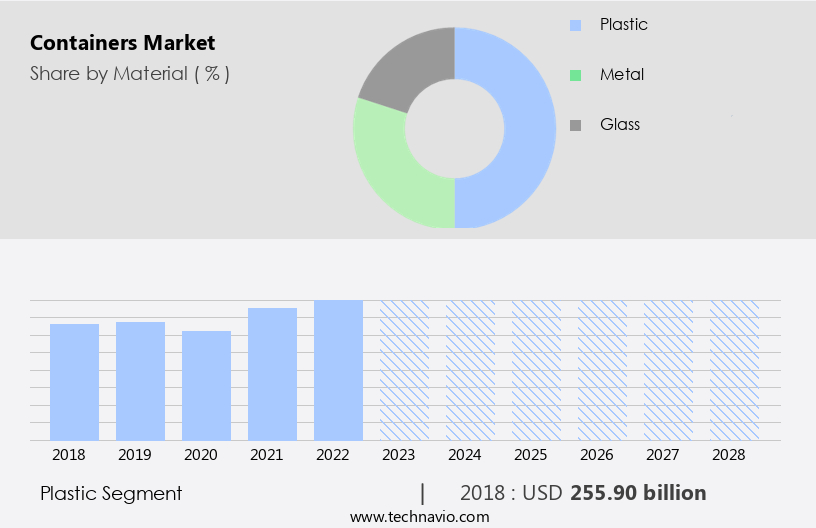
	- Material


	- End-user
	
		- Food and beverages
 
		- Pharmaceuticals
 
		- Consumer goods
 
		- Chemicals
 
		- Others


	- Container Size
	
		- Small Containers
 
		- Large Containers
 
		- High Cube Containers


	- Product Type
	
		- Dry Storage Containers
 
		- Flat Rack Containers
 
		- Refrigerated Containers
 
		- Special Purpose Containers
 
		- Others


	- Geography
	
		- APAC
		
			- China
 
			- India
 
			- Japan
 
			- South Korea


		- North America


		- Europe


		- Middle East and Africa


		- South America


By Material Insights
The plastic segment is estimated to witness significant growth during the forecast period. The shipping container market is experiencing growth due to various factors, including the adoption of energy-efficient procedures and eco-friendly materials. Supply chain management is being optimized through the use of blockchain technology, Internet of Things, and autonomous shipping. The digital revolution is transforming container design, enabling smart sensors for real-time tracking and monitoring of cargo. Container shortages are being addressed through the use of recycled materials and fleet expansion.
Containerized transport is essential for the efficient movement of goods, particularly in industries such as chemical transportation, e-commerce, and construction, where dry containers are widely used. Sustainability initiatives are prioritized, with a focus on fuel efficiency and reducing the shipping environment's carbon footprint. The maritime shipping sector is adapting to freight costs and geopolitical tensions, with innovations such as ice-breaking cargo ships and the cruise ship business. Container handling and transportation continue to evolve, with automation and digital transformation playing key roles in addressing port congestion and cargo handling challenges.

Get a glance at the share of various segments. Request Free Sample
The plastic segment was valued at USD 255.90 billion in 2018 and showed a gradual increase during the forecast period.
Regional Analysis
APAC is estimated to contribute 41% to the growth of the global market during the forecast period. Technavio's analysts have elaborately explained the regional trends and drivers that shape the market during the forecast period.

For more insights on the market size of various regions, Request Free Sample
The market In the Asia-Pacific (APAC) region is experiencing significant growth due to population density, urbanization, and expanding industries, particularly in sectors like food and beverage, e-commerce, and healthcare. In the food and beverage sector, China's food processing industry has seen consistent growth, with a 2.8% increase in production value in 2023. This trend highlights the increasing demand for packaging solutions ensuring food safety, quality, and longevity. India's food processing sector is also expanding. Container usage is essential for efficient supply chain management, especially in e-commerce, where the region's rapid growth is driving demand for intermodal and large containers. Sustainability initiatives, such as energy-efficient procedures, eco-friendly materials, and smart sensors, are increasingly important.
Blockchain technology and IoT enable real-time tracking and cargo handling automation, reducing port congestion and freight costs. Geopolitical tensions and container shortages impact shipping costs and fleet expansion. Container design and containerized transport using recycled materials contribute to the digital transformation of the maritime shipping sector. The market for dry containers, including temporary housing, mobile retail spaces, and disaster relief shelters, is also growing.
Market Dynamics
Geopolitical tensions and freight costs continue to influence market dynamics, leading to fleet expansion and the adoption of larger containers, including intermodal and dry storage containers. Autonomous shipping and ice-breaking cargo ships are also emerging trends, set to disrupt traditional maritime shipping sector norms. The container market is evolving in response to the digital revolution, with affordability and efficiency at the forefront, enabling the growth of e-commerce and various industries.
The market is experiencing significant growth and transformation, driven by various factors shaping the global shipping environment. Energy-efficient procedures and eco-friendly materials are becoming increasingly important as sustainability initiatives gain traction. Supply chain management is being revolutionized through the integration of blockchain technology, IoT, and automation, enhancing transparency and efficiency. Container handling and transportation are undergoing digital transformation, with smart sensors and container standardization streamlining cargo handling and reducing port congestion.
Our researchers analyzed the data with 2023 as the base year, along with the key drivers, trends, and challenges. A holistic analysis of drivers will help companies refine their marketing strategies to gain a competitive advantage.
What are the key market drivers for the Containers industry?
	- Expansion of e-commerce globally is the key driver of the market. The market is experiencing significant growth due to the increasing reliance on e-commerce and the digital transformation of supply chain management. In 2023, e-commerce marketplaces became the go-to destination for product searches, with approximately 30% of online shoppers starting their searches on these platforms. The B2B e-commerce market has seen consistent annual growth over the past decade, projected to reach around USD36 trillion by 2026. Simultaneously, the B2C e-commerce market is expected to reach approximately USD5 trillion by 2027, growing at a compound annual rate of about 14%. Eco-friendly materials and energy-efficient procedures are becoming essential In the container industry as sustainability initiatives gain prominence.
 
	- Container design is evolving to incorporate smart sensors, real-time tracking, and IoT technology for improved cargo handling and supply chain management. Blockchain technology is also being adopted to enhance transparency and security In the shipping container market. Autonomous shipping and digital revolution are revolutionizing marine transportation, with ice-breaking cargo ships and fleet expansion on the rise. Container handling and transportation costs are becoming increasingly important, with affordability being a significant consideration. Container shortages are also a concern, leading to the exploration of alternative uses for dry containers, such as temporary housing, mobile retail spaces, and disaster relief shelters. Geopolitical tensions and port congestion can impact the shipping environment, making efficient and effective logistics solutions crucial.
 
What are the market trends shaping the Containers market?
	- New product launches by vendors is the upcoming market trend. The market is experiencing a digital transformation, with companies prioritizing energy-efficient procedures and eco-friendly materials to meet evolving consumer preferences and sustainability initiatives. Innovations such as IoT and blockchain technology are being integrated into container design for real-time tracking and supply chain management. Autonomous shipping and ice-breaking cargo ships are also gaining traction, aiming to reduce freight costs and improve fuel efficiency In the maritime shipping sector. Container handling and transportation are undergoing automation to mitigate port congestion and streamline cargo handling. Large containers, including intermodal and dry storage containers, are being designed using recycled materials to promote sustainability.
 
	- Smart sensors and container standardization enable real-time monitoring and tracking of cargo, ensuring timely delivery and reducing the risk of container shortages. Chemical transportation, e-commerce, and logistics solutions are significant applications of containerized transport. The market is also exploring opportunities in temporary housing, mobile retail spaces, and disaster relief shelters. The shipping container market encompasses various sectors, including dry bulk, biomass, wood pellets, sea dredging aggregates, and construction. The continuous digital revolution In the market is expected to bring about significant cost savings and operational efficiencies.
 
What challenges does the Containers Industry face during its growth?
	- Raw material price volatility is a key challenge affecting the industry growth. The market faces significant challenges from raw material price fluctuations, which impact production costs and profitability for manufacturers. The prices of essential materials like plastics, metals, and glass are subject to various influences, including global supply and demand dynamics, geopolitical tensions, and natural disasters. For example, the price of polyethylene, a crucial plastic in container production, has seen significant volatility, rising from approximately USD 0.80 per pound in early 2021 to over USD 1.50 per pound in mid-2022 due to increased demand and supply chain disruptions. Metal prices have also experienced dramatic fluctuations due to rising costs for raw materials such as aluminum and steel.
 
	- Energy-efficient procedures and eco-friendly materials are becoming increasingly important In the market, driven by sustainability initiatives and the digital transformation of the maritime shipping sector. Container design is evolving to incorporate IoT, blockchain technology, and smart sensors for real-time tracking and improved supply chain management. Autonomous shipping and ice-breaking cargo ships are also gaining traction to address port congestion and cargo handling challenges. Fleet expansion and the integration of digital solutions are essential for container manufacturers to remain competitive In the market. The market for dry containers, including large containers, intermodal containers, and temporary housing solutions, is expected to grow due to the increasing demand for logistics solutions and the e-commerce boom.
 
Exclusive Customer Landscape
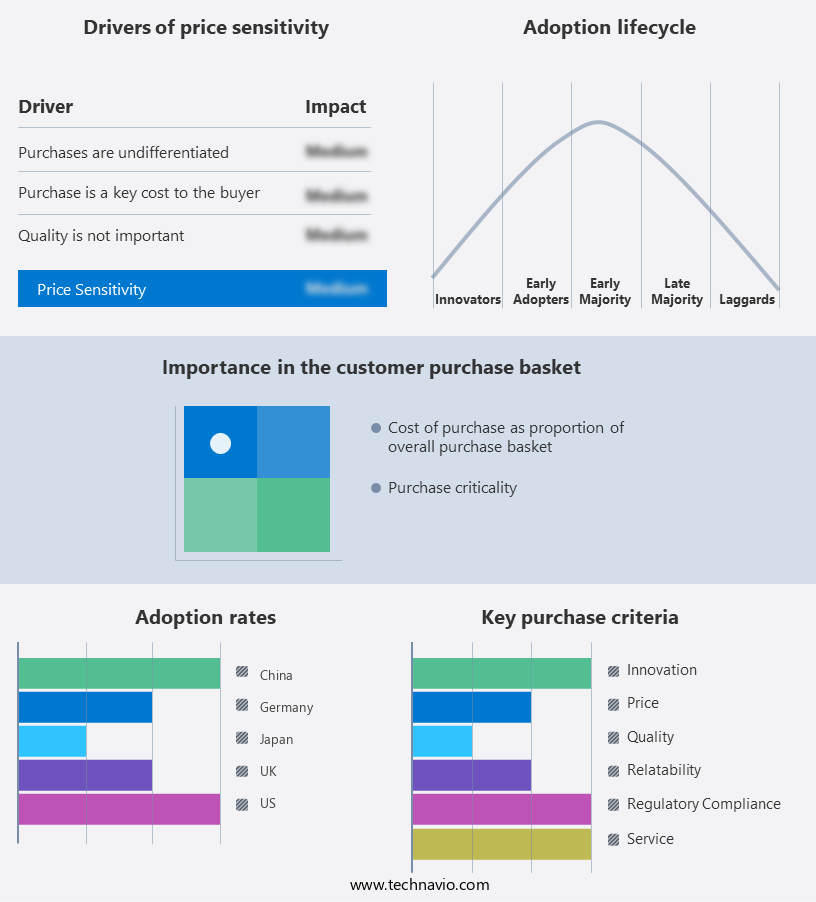
The containers market forecasting report includes the adoption lifecycle of the market, covering from the innovator's stage to the laggard's stage. It focuses on adoption rates in different regions based on penetration. Furthermore, the containers market report also includes key purchase criteria and drivers of price sensitivity to help companies evaluate and develop their market growth analysis strategies.

 Customer Landscape
Key Companies & Market Insights
Companies are implementing various strategies, such as strategic alliances, containers market forecast, partnerships, mergers and acquisitions, geographical expansion, and product/service launches, to enhance their presence In the industry.
ALPLA Werke Alwin Lehner - The container market encompasses the production and distribution of rectangular injection containers, ideal for packaging ice cream and frozen yogurt. These containers, characterized by their uniform dimensions and injection molding process, provide optimal protection and preservation for these temperature-sensitive products.
The industry research and growth report includes detailed analyses of the competitive landscape of the market and information about key companies, including:
	- ALPLA Werke Alwin Lehner
 
	- Amcor Plc
 
	- Anchor Packaging LLC
 
	- Ardagh Group SA
 
	- Ball Corp.
 
	- Berry Global Inc.
 
	- BWAY Corp.
 
	- CANPACK SA
 
	- Compagnie de Saint-Gobain SA
 
	- Crown Holdings Inc.
 
	- Graham Packaging Co. LP
 
	- Greif Inc.
 
	- Novolex
 
	- O I Glass Inc.
 
	- Plastipak Holdings Inc.
 
	- Sidel
 
	- Silgan Containers LLC
 
	- Sonoco Products Co.
 
	- Verallia SA
 
	- Vetropack Group
 
	- Vitro SAB De CV
 
Qualitative and quantitative analysis of companies has been conducted to help clients understand the wider business environment as well as the strengths and weaknesses of key industry players. Data is qualitatively analyzed to categorize companies as pure play, category-focused, industry-focused, and diversified; it is quantitatively analyzed to categorize companies as dominant, leading, strong, tentative, and weak.
Research Analyst Overview
The container market continues to evolve, driven by advancements in technology and the need for more sustainable and efficient logistics solutions. One of the key trends shaping the market is the adoption of energy-efficient procedures and eco-friendly materials. This shift is being fueled by the digital revolution and the increasing importance of supply chain management. Blockchain technology and the Internet of Things (IoT) are playing a significant role in enhancing supply chain transparency and efficiency. The use of smart sensors and real-time tracking is enabling container shipping companies to optimize their operations and reduce port congestion. Container design is also evolving, with a focus on intermodal containers that can be easily transported via multiple modes of transportation.
This is particularly important for chemical transportation and other industries that require specialized containers. The maritime shipping sector is undergoing a transformation, with an increasing focus on automation and digital transformation. Autonomous shipping is a promising area of research, with the potential to reduce labor costs and improve safety. Geopolitical tensions and container shortages continue to pose challenges for the market. However, sustainability initiatives and the use of recycled materials are helping to mitigate these issues. The container market is also being driven by the growth of e-commerce and the need for temporary housing and mobile retail spaces.
Logistics solutions are becoming increasingly important, with a focus on large containers and affordable labor. Fleet expansion is a key trend, with shipping companies investing in ice-breaking cargo ships and exploring new markets. The shipping environment is becoming more competitive, with freight costs a major concern for many players. Dry storage containers are in high demand, particularly in industries such as construction and biomass. The use of dry bulk containers for transporting materials such as wood pellets, sea dredging aggregates, and other commodities is increasing. The container market is expected to continue growing, driven by the need for more efficient and sustainable logistics solutions.
The use of renewable energy sources and the adoption of eco-friendly practices are likely to be key drivers of growth. The container market is undergoing a significant transformation, driven by technological advancements, sustainability initiatives, and changing consumer demands. The use of energy-efficient procedures, eco-friendly materials, and digital technologies is becoming increasingly important, as is the need for more efficient and cost-effective logistics solutions. The market is expected to continue growing, with a focus on intermodal containers, automation, and sustainability.
	
		
			| 
			 Market Scope 
			 | 
		
		
			| 
			 Report Coverage 
			 | 
			
			 Details 
			 | 
		
		
			| 
			 Page number 
			 | 
			
			 216 
			 | 
		
		
			| 
			 Base year 
			 | 
			
			 2023 
			 | 
		
		
			| 
			 Historic period 
			 | 
			2018-2022 | 
		
		
			| 
			 Forecast period 
			 | 
			
			 2024-2028 
			 | 
		
		
			| 
			 Growth momentum & CAGR 
			 | 
			
			 Accelerate at a CAGR of 9.4% 
			 | 
		
		
			| 
			 Market growth 2024-2028 
			 | 
			
			 USD 403 billion 
			 | 
		
		
			| 
			 Market structure 
			 | 
			
			 Fragmented 
			 | 
		
		
			| 
			 YoY growth 2023-2024(%) 
			 | 
			
			 7.1 
			 | 
		
		
			| 
			 Key countries 
			 | 
			
			 US, China, Japan, Germany, UK, India, France, Canada, South Korea, and Spain 
			 | 
		
		
			| 
			 Competitive landscape 
			 | 
			
			 Leading Companies, Market Positioning of Companies, Competitive Strategies, and Industry Risks 
			 | 
		
	
Request Free Sample
What are the Key Data Covered in this Containers Market Research and Growth Report?
	- CAGR of the Containers industry during the forecast period
 
	- Detailed information on factors that will drive the growth and forecasting between 2024 and 2028
 
	- Precise estimation of the size of the market and its contribution of the industry in focus to the parent market
 
	- Accurate predictions about upcoming growth and trends and changes in consumer behaviour
 
	- Growth of the market across APAC, North America, Europe, Middle East and Africa, and South America
 
	- Thorough analysis of the market's competitive landscape and detailed information about companies
 
	- Comprehensive analysis of factors that will challenge the containers market growth of industry companies
 
We can help! Our analysts can customize this containers market research report to meet your requirements. 
Get in touch
                        
          
            1 Executive Summary
- 1.1 Market overview
- Executive Summary - Chart on Market Overview
 - Executive Summary - Data Table on Market Overview
 - Executive Summary - Chart on Global Market Characteristics
 - Executive Summary - Chart on Market by Geography
 - Executive Summary - Chart on Market Segmentation by Material
 - Executive Summary - Chart on Market Segmentation by End-user
 - Executive Summary - Chart on Incremental Growth
 - Executive Summary - Data Table on Incremental Growth
 - Executive Summary - Chart on Company Market Positioning
 
 
2 Technavio Analysis
- 2.1 Analysis of price sensitivity, lifecycle, customer purchase basket, adoption rates, and purchase criteria
- Analysis of price sensitivity, lifecycle, customer purchase basket, adoption rates, and purchase criteria
 
 
- 2.2 Criticality of inputs and Factors of differentiation
- Overview on criticality of inputs and factors of differentiation
 
 
- 2.3 Factors of disruption
- Overview on factors of disruption
 
 
- 2.4 Impact of drivers and challenges
- Impact of drivers and challenges in 2023 and 2028
 
 
3 Market Landscape
- 3.1 Market ecosystem
- Parent Market
 - Data Table on - Parent Market
 
 
- 3.2 Market characteristics
- Market characteristics analysis
 
 
4 Market Sizing
- 4.1 Market definition
- Offerings of companies included in the market definition
 
 
- 4.2 Market segment analysis
 
- 4.4 Market outlook: Forecast for 2023-2028
- Chart on Global - Market size and forecast 2023-2028 ($ billion)
 - Data Table on Global - Market size and forecast 2023-2028 ($ billion)
 - Chart on Global Market: Year-over-year growth 2023-2028 (%)
 - Data Table on Global Market: Year-over-year growth 2023-2028 (%)
 
 
5 Historic Market Size
- 5.1 Global Containers Market 2018 - 2022
- Historic Market Size - Data Table on Global Containers Market 2018 - 2022 ($ billion)
 
 
- 5.2 Material segment analysis 2018 - 2022
- Historic Market Size - Material Segment 2018 - 2022 ($ billion)
 
 
- 5.3 End-user segment analysis 2018 - 2022
- Historic Market Size - End-user Segment 2018 - 2022 ($ billion)
 
 
- 5.4 Geography segment analysis 2018 - 2022
- Historic Market Size - Geography Segment 2018 - 2022 ($ billion)
 
 
- 5.5 Country segment analysis 2018 - 2022
- Historic Market Size - Country Segment 2018 - 2022 ($ billion)
 
 
6 Qualitative Analysis
- 6.1 Impact of AI on the Global Containers Market
 
7 Five Forces Analysis
- 7.1 Five forces summary
- Five forces analysis - Comparison between 2023 and 2028
 
 
- 7.2 Bargaining power of buyers
- Bargaining power of buyers - Impact of key factors 2023 and 2028
 
 
- 7.3 Bargaining power of suppliers
- Bargaining power of suppliers - Impact of key factors in 2023 and 2028
 
 
- 7.4 Threat of new entrants
- Threat of new entrants - Impact of key factors in 2023 and 2028
 
 
- 7.5 Threat of substitutes
- Threat of substitutes - Impact of key factors in 2023 and 2028
 
 
- 7.6 Threat of rivalry
- Threat of rivalry - Impact of key factors in 2023 and 2028
 
 
- 7.7 Market condition
- Chart on Market condition - Five forces 2023 and 2028
 
 
8 Market Segmentation by Material
- 8.1 Market segments
- Chart on Material - Market share 2023-2028 (%)
 - Data Table on Material - Market share 2023-2028 (%)
 
 
- 8.2 Comparison by Material
- Chart on Comparison by Material
 - Data Table on Comparison by Material
 
 
- 8.3 Plastic - Market size and forecast 2023-2028
- Chart on Plastic - Market size and forecast 2023-2028 ($ billion)
 - Data Table on Plastic - Market size and forecast 2023-2028 ($ billion)
 - Chart on Plastic - Year-over-year growth 2023-2028 (%)
 - Data Table on Plastic - Year-over-year growth 2023-2028 (%)
 
 
- 8.4 Metal - Market size and forecast 2023-2028
- Chart on Metal - Market size and forecast 2023-2028 ($ billion)
 - Data Table on Metal - Market size and forecast 2023-2028 ($ billion)
 - Chart on Metal - Year-over-year growth 2023-2028 (%)
 - Data Table on Metal - Year-over-year growth 2023-2028 (%)
 
 
- 8.5 Glass - Market size and forecast 2023-2028
- Chart on Glass - Market size and forecast 2023-2028 ($ billion)
 - Data Table on Glass - Market size and forecast 2023-2028 ($ billion)
 - Chart on Glass - Year-over-year growth 2023-2028 (%)
 - Data Table on Glass - Year-over-year growth 2023-2028 (%)
 
 
- 8.6 Market opportunity by Material
- Market opportunity by Material ($ billion)
 - Data Table on Market opportunity by Material ($ billion)
 
 
9 Market Segmentation by End-user
- 9.1 Market segments
- Chart on End-user - Market share 2023-2028 (%)
 - Data Table on End-user - Market share 2023-2028 (%)
 
 
- 9.2 Comparison by End-user
- Chart on Comparison by End-user
 - Data Table on Comparison by End-user
 
 
- 9.3 Food and beverages - Market size and forecast 2023-2028
- Chart on Food and beverages - Market size and forecast 2023-2028 ($ billion)
 - Data Table on Food and beverages - Market size and forecast 2023-2028 ($ billion)
 - Chart on Food and beverages - Year-over-year growth 2023-2028 (%)
 - Data Table on Food and beverages - Year-over-year growth 2023-2028 (%)
 
 
- 9.4 Pharmaceuticals - Market size and forecast 2023-2028
- Chart on Pharmaceuticals - Market size and forecast 2023-2028 ($ billion)
 - Data Table on Pharmaceuticals - Market size and forecast 2023-2028 ($ billion)
 - Chart on Pharmaceuticals - Year-over-year growth 2023-2028 (%)
 - Data Table on Pharmaceuticals - Year-over-year growth 2023-2028 (%)
 
 
- 9.5 Consumer goods - Market size and forecast 2023-2028
- Chart on Consumer goods - Market size and forecast 2023-2028 ($ billion)
 - Data Table on Consumer goods - Market size and forecast 2023-2028 ($ billion)
 - Chart on Consumer goods - Year-over-year growth 2023-2028 (%)
 - Data Table on Consumer goods - Year-over-year growth 2023-2028 (%)
 
 
- 9.6 Chemicals - Market size and forecast 2023-2028
- Chart on Chemicals - Market size and forecast 2023-2028 ($ billion)
 - Data Table on Chemicals - Market size and forecast 2023-2028 ($ billion)
 - Chart on Chemicals - Year-over-year growth 2023-2028 (%)
 - Data Table on Chemicals - Year-over-year growth 2023-2028 (%)
 
 
- 9.7 Others - Market size and forecast 2023-2028
- Chart on Others - Market size and forecast 2023-2028 ($ billion)
 - Data Table on Others - Market size and forecast 2023-2028 ($ billion)
 - Chart on Others - Year-over-year growth 2023-2028 (%)
 - Data Table on Others - Year-over-year growth 2023-2028 (%)
 
 
- 9.8 Market opportunity by End-user
- Market opportunity by End-user ($ billion)
 - Data Table on Market opportunity by End-user ($ billion)
 
 
10 Market Segmentation by Container Size
- 10.1 Market segments
- Chart on Container Size - Market share (2023-2028) (%)
 - Data Table on Container Size - Market share (2023-2028) (%)
 
 
- 10.2 Comparison by Container Size
- Chart on Comparison by Container Size
 - Data Table on Comparison by Container Size
 
 
- 10.3 Small Containers - Market size and forecast (2023-2028)
- Chart on Small Containers - Market size and forecast (2023-2028) ($ million)
 - Data Table on Small Containers - Market size and forecast (2023-2028) ($ million)
 - Chart on Small Containers - Year-over-year growth (2023-2028) (%)
 - Data Table on Small Containers - Year-over-year growth (2023-2028) (%)
 
 
- 10.4 Large Containers - Market size and forecast (2023-2028)
- Chart on Large Containers - Market size and forecast (2023-2028) ($ million)
 - Data Table on Large Containers - Market size and forecast (2023-2028) ($ million)
 - Chart on Large Containers - Year-over-year growth (2023-2028) (%)
 - Data Table on Large Containers - Year-over-year growth (2023-2028) (%)
 
 
- 10.5 High Cube Containers - Market size and forecast (2023-2028)
- Chart on High Cube Containers - Market size and forecast (2023-2028) ($ million)
 - Data Table on High Cube Containers - Market size and forecast (2023-2028) ($ million)
 - Chart on High Cube Containers - Year-over-year growth (2023-2028) (%)
 - Data Table on High Cube Containers - Year-over-year growth (2023-2028) (%)
 
 
- 10.6 Market opportunity by Container Size
- Market opportunity by $segment_name ($ million)
 - Data Table on Market opportunity by $segment_name ($ million)
 
 
11 Market Segmentation by Product Type
- 11.1 Market segments
- Chart on Product Type - Market share (2023-2028) (%)
 - Data Table on Product Type - Market share (2023-2028) (%)
 
 
- 11.2 Comparison by Product Type
- Chart on Comparison by Product Type
 - Data Table on Comparison by Product Type
 
 
- 11.3 Dry Storage Containers - Market size and forecast (2023-2028)
- Chart on Dry Storage Containers - Market size and forecast (2023-2028) ($ million)
 - Data Table on Dry Storage Containers - Market size and forecast (2023-2028) ($ million)
 - Chart on Dry Storage Containers - Year-over-year growth (2023-2028) (%)
 - Data Table on Dry Storage Containers - Year-over-year growth (2023-2028) (%)
 
 
- 11.4 Flat Rack Containers - Market size and forecast (2023-2028)
- Chart on Flat Rack Containers - Market size and forecast (2023-2028) ($ million)
 - Data Table on Flat Rack Containers - Market size and forecast (2023-2028) ($ million)
 - Chart on Flat Rack Containers - Year-over-year growth (2023-2028) (%)
 - Data Table on Flat Rack Containers - Year-over-year growth (2023-2028) (%)
 
 
- 11.5 Refrigerated Containers - Market size and forecast (2023-2028)
- Chart on Refrigerated Containers - Market size and forecast (2023-2028) ($ million)
 - Data Table on Refrigerated Containers - Market size and forecast (2023-2028) ($ million)
 - Chart on Refrigerated Containers - Year-over-year growth (2023-2028) (%)
 - Data Table on Refrigerated Containers - Year-over-year growth (2023-2028) (%)
 
 
- 11.6 Special Purpose Containers - Market size and forecast (2023-2028)
- Chart on Special Purpose Containers - Market size and forecast (2023-2028) ($ million)
 - Data Table on Special Purpose Containers - Market size and forecast (2023-2028) ($ million)
 - Chart on Special Purpose Containers - Year-over-year growth (2023-2028) (%)
 - Data Table on Special Purpose Containers - Year-over-year growth (2023-2028) (%)
 
 
- 11.7 Others - Market size and forecast (2023-2028)
- Chart on Others - Market size and forecast (2023-2028) ($ million)
 - Data Table on Others - Market size and forecast (2023-2028) ($ million)
 - Chart on Others - Year-over-year growth (2023-2028) (%)
 - Data Table on Others - Year-over-year growth (2023-2028) (%)
 
 
- 11.8 Market opportunity by Product Type
- Market opportunity by $segment_name ($ million)
 - Data Table on Market opportunity by $segment_name ($ million)
 
 
12 Customer Landscape
- 12.1 Customer landscape overview
- Analysis of price sensitivity, lifecycle, customer purchase basket, adoption rates, and purchase criteria
 
 
13 Geographic Landscape
- 13.1 Geographic segmentation
- Chart on Market share by geography 2023-2028 (%)
 - Data Table on Market share by geography 2023-2028 (%)
 
 
- 13.2 Geographic comparison
- Chart on Geographic comparison
 - Data Table on Geographic comparison
 
 
- 13.3 APAC - Market size and forecast 2023-2028
- Chart on APAC - Market size and forecast 2023-2028 ($ billion)
 - Data Table on APAC - Market size and forecast 2023-2028 ($ billion)
 - Chart on APAC - Year-over-year growth 2023-2028 (%)
 - Data Table on APAC - Year-over-year growth 2023-2028 (%)
 
 
- 13.4 North America - Market size and forecast 2023-2028
- Chart on North America - Market size and forecast 2023-2028 ($ billion)
 - Data Table on North America - Market size and forecast 2023-2028 ($ billion)
 - Chart on North America - Year-over-year growth 2023-2028 (%)
 - Data Table on North America - Year-over-year growth 2023-2028 (%)
 
 
- 13.5 Europe - Market size and forecast 2023-2028
- Chart on Europe - Market size and forecast 2023-2028 ($ billion)
 - Data Table on Europe - Market size and forecast 2023-2028 ($ billion)
 - Chart on Europe - Year-over-year growth 2023-2028 (%)
 - Data Table on Europe - Year-over-year growth 2023-2028 (%)
 
 
- 13.6 Middle East and Africa - Market size and forecast 2023-2028
- Chart on Middle East and Africa - Market size and forecast 2023-2028 ($ billion)
 - Data Table on Middle East and Africa - Market size and forecast 2023-2028 ($ billion)
 - Chart on Middle East and Africa - Year-over-year growth 2023-2028 (%)
 - Data Table on Middle East and Africa - Year-over-year growth 2023-2028 (%)
 
 
- 13.7 South America - Market size and forecast 2023-2028
- Chart on South America - Market size and forecast 2023-2028 ($ billion)
 - Data Table on South America - Market size and forecast 2023-2028 ($ billion)
 - Chart on South America - Year-over-year growth 2023-2028 (%)
 - Data Table on South America - Year-over-year growth 2023-2028 (%)
 
 
- 13.8 US - Market size and forecast 2023-2028
- Chart on US - Market size and forecast 2023-2028 ($ billion)
 - Data Table on US - Market size and forecast 2023-2028 ($ billion)
 - Chart on US - Year-over-year growth 2023-2028 (%)
 - Data Table on US - Year-over-year growth 2023-2028 (%)
 
 
- 13.9 China - Market size and forecast 2023-2028
- Chart on China - Market size and forecast 2023-2028 ($ billion)
 - Data Table on China - Market size and forecast 2023-2028 ($ billion)
 - Chart on China - Year-over-year growth 2023-2028 (%)
 - Data Table on China - Year-over-year growth 2023-2028 (%)
 
 
- 13.10 Japan - Market size and forecast 2023-2028
- Chart on Japan - Market size and forecast 2023-2028 ($ billion)
 - Data Table on Japan - Market size and forecast 2023-2028 ($ billion)
 - Chart on Japan - Year-over-year growth 2023-2028 (%)
 - Data Table on Japan - Year-over-year growth 2023-2028 (%)
 
 
- 13.11 Germany - Market size and forecast 2023-2028
- Chart on Germany - Market size and forecast 2023-2028 ($ billion)
 - Data Table on Germany - Market size and forecast 2023-2028 ($ billion)
 - Chart on Germany - Year-over-year growth 2023-2028 (%)
 - Data Table on Germany - Year-over-year growth 2023-2028 (%)
 
 
- 13.12 UK - Market size and forecast 2023-2028
- Chart on UK - Market size and forecast 2023-2028 ($ billion)
 - Data Table on UK - Market size and forecast 2023-2028 ($ billion)
 - Chart on UK - Year-over-year growth 2023-2028 (%)
 - Data Table on UK - Year-over-year growth 2023-2028 (%)
 
 
- 13.13 India - Market size and forecast 2023-2028
- Chart on India - Market size and forecast 2023-2028 ($ billion)
 - Data Table on India - Market size and forecast 2023-2028 ($ billion)
 - Chart on India - Year-over-year growth 2023-2028 (%)
 - Data Table on India - Year-over-year growth 2023-2028 (%)
 
 
- 13.14 France - Market size and forecast 2023-2028
- Chart on France - Market size and forecast 2023-2028 ($ billion)
 - Data Table on France - Market size and forecast 2023-2028 ($ billion)
 - Chart on France - Year-over-year growth 2023-2028 (%)
 - Data Table on France - Year-over-year growth 2023-2028 (%)
 
 
- 13.15 Canada - Market size and forecast 2023-2028
- Chart on Canada - Market size and forecast 2023-2028 ($ billion)
 - Data Table on Canada - Market size and forecast 2023-2028 ($ billion)
 - Chart on Canada - Year-over-year growth 2023-2028 (%)
 - Data Table on Canada - Year-over-year growth 2023-2028 (%)
 
 
- 13.16 South Korea - Market size and forecast 2023-2028
- Chart on South Korea - Market size and forecast 2023-2028 ($ billion)
 - Data Table on South Korea - Market size and forecast 2023-2028 ($ billion)
 - Chart on South Korea - Year-over-year growth 2023-2028 (%)
 - Data Table on South Korea - Year-over-year growth 2023-2028 (%)
 
 
- 13.17 Spain - Market size and forecast 2023-2028
- Chart on Spain - Market size and forecast 2023-2028 ($ billion)
 - Data Table on Spain - Market size and forecast 2023-2028 ($ billion)
 - Chart on Spain - Year-over-year growth 2023-2028 (%)
 - Data Table on Spain - Year-over-year growth 2023-2028 (%)
 
 
- 13.18 Market opportunity by geography
- Market opportunity by geography ($ billion)
 - Data Tables on Market opportunity by geography ($ billion)
 
 
14 Drivers, Challenges, and Opportunity/Restraints
- 14.3 Impact of drivers and challenges
- Impact of drivers and challenges in 2023 and 2028
 
 
- 14.4 Market opportunities/restraints
 
15 Competitive Landscape
- 15.2 Competitive Landscape
- Overview on criticality of inputs and factors of differentiation
 
 
- 15.3 Landscape disruption
- Overview on factors of disruption
 
 
- 15.4 Industry risks
- Impact of key risks on business
 
 
16 Competitive Analysis
- 16.2 Company ranking index
 
- 16.3 Market positioning of companies
- Matrix on companies position and classification
 
 
- 16.4 Amcor Plc
- Amcor Plc - Overview
 - Amcor Plc - Business segments
 - Amcor Plc - Key news
 - Amcor Plc - Key offerings
 - Amcor Plc - Segment focus
 - SWOT
 
 
- 16.5 Anchor Packaging LLC
- Anchor Packaging LLC - Overview
 - Anchor Packaging LLC - Product / Service
 - Anchor Packaging LLC - Key offerings
 - SWOT
 
 
- 16.6 Ardagh Group SA
- Ardagh Group SA - Overview
 - Ardagh Group SA - Business segments
 - Ardagh Group SA - Key news
 - Ardagh Group SA - Key offerings
 - Ardagh Group SA - Segment focus
 - SWOT
 
 
- 16.7 Ball Corp.
- Ball Corp. - Overview
 - Ball Corp. - Business segments
 - Ball Corp. - Key offerings
 - Ball Corp. - Segment focus
 - SWOT
 
 
- 16.8 Berry Global Inc.
- Berry Global Inc. - Overview
 - Berry Global Inc. - Business segments
 - Berry Global Inc. - Key news
 - Berry Global Inc. - Key offerings
 - Berry Global Inc. - Segment focus
 - SWOT
 
 
- 16.9 CANPACK SA
- CANPACK SA - Overview
 - CANPACK SA - Product / Service
 - CANPACK SA - Key offerings
 - SWOT
 
 
- 16.10 Compagnie de Saint-Gobain SA
- Compagnie de Saint-Gobain SA - Overview
 - Compagnie de Saint-Gobain SA - Business segments
 - Compagnie de Saint-Gobain SA - Key news
 - Compagnie de Saint-Gobain SA - Key offerings
 - Compagnie de Saint-Gobain SA - Segment focus
 - SWOT
 
 
- 16.11 Crown Holdings Inc.
- Crown Holdings Inc. - Overview
 - Crown Holdings Inc. - Business segments
 - Crown Holdings Inc. - Key offerings
 - Crown Holdings Inc. - Segment focus
 - SWOT
 
 
- 16.12 Graham Packaging Co. LP
- Graham Packaging Co. LP - Overview
 - Graham Packaging Co. LP - Product / Service
 - Graham Packaging Co. LP - Key offerings
 - SWOT
 
 
- 16.13 Greif Inc.
- Greif Inc. - Overview
 - Greif Inc. - Business segments
 - Greif Inc. - Key news
 - Greif Inc. - Key offerings
 - Greif Inc. - Segment focus
 - SWOT
 
 
- 16.14 Novolex
- Novolex - Overview
 - Novolex - Product / Service
 - Novolex - Key offerings
 - SWOT
 
 
- 16.15 O I Glass Inc.
- O I Glass Inc. - Overview
 - O I Glass Inc. - Business segments
 - O I Glass Inc. - Key offerings
 - O I Glass Inc. - Segment focus
 - SWOT
 
 
- 16.16 Silgan Containers LLC
- Silgan Containers LLC - Overview
 - Silgan Containers LLC - Product / Service
 - Silgan Containers LLC - Key offerings
 - SWOT
 
 
- 16.17 Sonoco Products Co.
- Sonoco Products Co. - Overview
 - Sonoco Products Co. - Business segments
 - Sonoco Products Co. - Key news
 - Sonoco Products Co. - Key offerings
 - Sonoco Products Co. - Segment focus
 - SWOT
 
 
- 16.18 Verallia SA
- Verallia SA - Overview
 - Verallia SA - Product / Service
 - Verallia SA - Key offerings
 - SWOT
 
 
17 Appendix
- 17.2 Inclusions and exclusions checklist
- Inclusions checklist
 - Exclusions checklist
 
 
- 17.3 Currency conversion rates for US$
- Currency conversion rates for US$
 
 
- 17.4 Research methodology
 
- 17.7 Validation techniques employed for market sizing
- Validation techniques employed for market sizing
 
 
- 17.9 360 degree market analysis
- 360 degree market analysis
 
 
- 17.10 List of abbreviations