
Corporate E-Learning Market Size 2025-2029
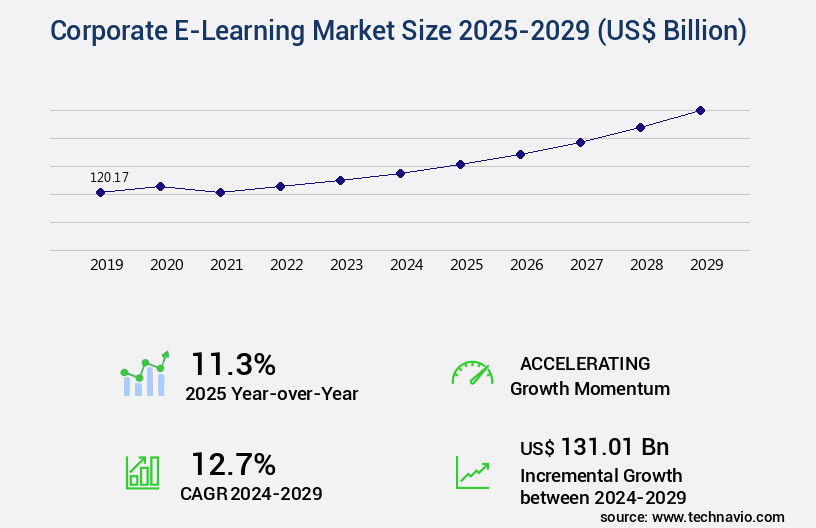
The corporate e-learning market size is forecast to increase by USD 131.01 billion, at a CAGR of 12.7% between 2024 and 2029.
Major Market Trends & Insights
- APAC dominated the market and accounted for a 29% growth during the forecast period.
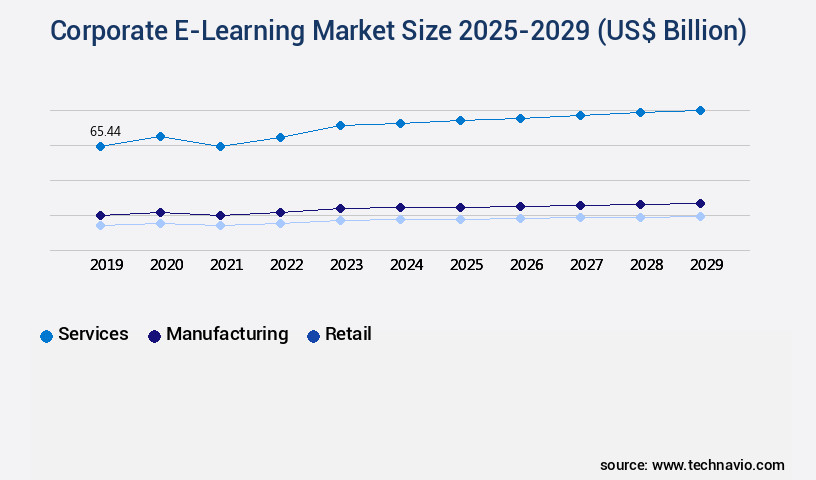
- By the End-user - Services segment was valued at USD 65.44 billion in 2023
- By the Deployment - On-premises segment accounted for the largest market revenue share in 2023
Market Size & Forecast
- Market Opportunities: USD 141.99 billion
- Market Future Opportunities: USD 131007.50 billion
- CAGR : 12.7%
- APAC: Largest market in 2023
Market Summary
- The market is experiencing significant growth, with businesses increasingly recognizing the cost-effective potential of digital training solutions. According to recent studies, the market is projected to reach a value of USD70 billion by 2027, representing a substantial increase from its current size. This shift is driven by the adoption of microlearning, a training approach that delivers content in short, easily digestible modules. In comparison to traditional classroom training, e-learning offers employers a more flexible and cost-efficient alternative, reducing the need for travel and accommodation expenses.
- Furthermore, the ongoing development of advanced technologies, such as artificial intelligence and virtual reality, is expanding the capabilities of e-learning platforms, enabling more interactive and engaging learning experiences. Overall, the market is poised for continued expansion, offering businesses a valuable tool for enhancing employee skills and driving organizational growth.
What will be the Size of the Corporate E-Learning Market during the forecast period?
Explore market size, adoption trends, and growth potential for corporate e-learning market Request Free Sample
- The market encompasses a diverse range of solutions, including elearning content libraries, employee onboarding programs, and interactive whiteboards. According to industry estimates, this market is projected to reach USD70 billion by 2025, representing a significant growth from the USD42 billion recorded in 2020. Virtual classrooms and e-learning content migration are key components, enabling businesses to transition from traditional instructor-led training to on-demand and flexible learning opportunities. Training program evaluation and learning platform integration are essential features for ensuring the effectiveness of e-learning initiatives. Performance management systems, talent management systems, and sales training programs are popular applications, with product training programs and compliance training programs also gaining traction.
- E-learning accessibility features, learning effectiveness metrics, and training needs assessment are crucial elements that contribute to the overall success of these initiatives. With the increasing demand for multimedia learning design, technical training programs, and learning strategy consulting, the market continues to evolve, offering businesses innovative solutions to meet their unique training requirements.
How is this Corporate E-Learning Industry segmented?
The corporate e-learning industry research report provides comprehensive data (region-wise segment analysis), with forecasts and estimates in "USD billion" for the period 2025-2029, as well as historical data from 2019-2023 for the following segments.
- End-user
- Services
- Manufacturing
- Retail
- Others
- Deployment
- On-premises
- Cloud-based
- Learning Type
- Distance Learning
- Instructor-led Training
- Blended Learning
- Distance Learning
- Instructor-led Training
- Blended Learning
- Technology
- Web-Based
- LMS
- Learning Content Management Systems
- Podcasts
- Virtual Classrooms
- Mobile E-Learning
- Training Type
- Instructor-led & Text-based
- Outsourced
- Instructor-led & Text-based
- Outsourced
- Geography
- North America
- US
- Canada
- Europe
- France
- Germany
- Italy
- Spain
- UK
- Middle East and Africa
- UAE
- APAC
- China
- India
- Japan
- South Korea
- South America
- Brazil
- Rest of World (ROW)
- North America
By End-user Insights
The services segment is estimated to witness significant growth during the forecast period.
In the dynamic and evolving business landscape, the market continues to gain traction as organizations seek innovative solutions to address their training needs. According to recent studies, e-learning adoption in the corporate sector has witnessed a significant increase, with approximately 57% of companies investing in e-learning programs in 2021. This trend is expected to persist, with industry forecasts indicating that over 60% of corporations will adopt e-learning by 2025. Content management systems, augmented reality training, social learning communities, adaptive learning technologies, video conferencing platforms, performance support tools, e-learning authoring tools, gamified learning platforms, scenario-based learning, employee training platforms, online course delivery, learning analytics dashboards, learning management systems, interactive simulations, mobile learning apps, e-learning accessibility standards, collaborative learning tools, learning experience platforms, data-driven learning insights, scorm compliant courses, virtual reality training, competency-based training, custom e-learning development, blended learning models, personalized learning paths, microlearning modules, and talent development programs are all integral components of the e-learning market.
These solutions cater to various industries, including hospitality, where employees require regular training to maintain high service quality and meet customer expectations. With the hospitality industry facing challenges such as high turnover rates and skill shortages, e-learning offers a cost-effective and flexible alternative to traditional training methods. The market's continuous evolution is driven by the integration of advanced technologies like artificial intelligence, machine learning, and virtual reality, enabling more immersive and personalized learning experiences. Moreover, the e-learning market's future growth prospects are promising, with approximately 28% of organizations planning to increase their e-learning budgets in 2022. This growth is fueled by the market's ability to cater to diverse learning styles, offer flexible scheduling, and provide real-time performance tracking and analytics. As a result, the e-learning market is poised to revolutionize the way businesses approach employee training and development.
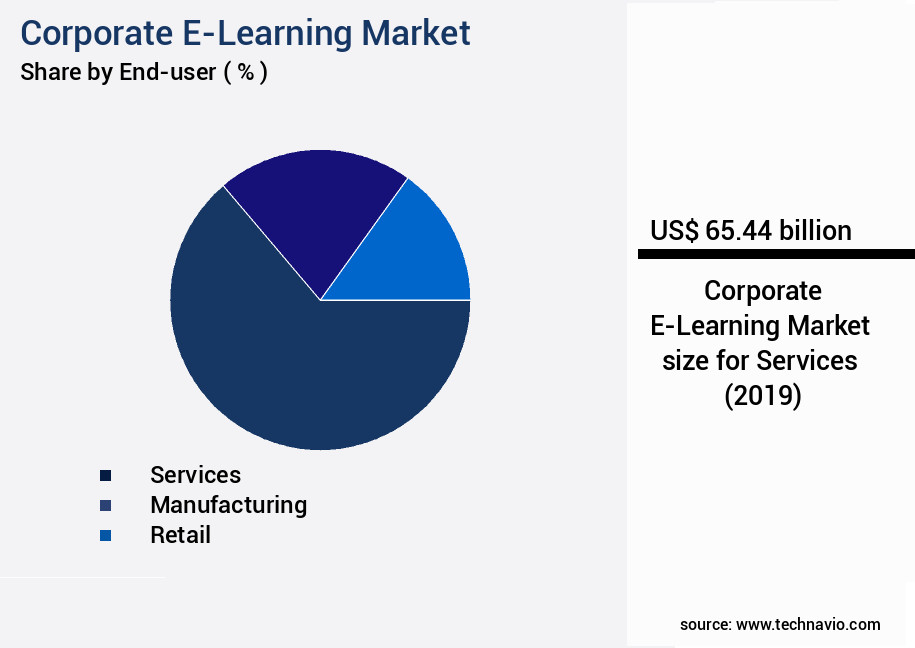
The Services segment was valued at USD 65.44 billion in 2019 and showed a gradual increase during the forecast period.
Regional Analysis
APAC is estimated to contribute 29% to the growth of the global market during the forecast period.Technavio's analysts have elaborately explained the regional trends and drivers that shape the market during the forecast period.

See How Corporate E-Learning Market Demand is Rising in APAC Request Free Sample
The market in North America is witnessing significant growth, with the United States being a major revenue contributor. This expansion can be attributed to the presence of numerous IT companies, including Adobe, Oracle, Microsoft, and IBM, which have a global footprint. The need for employees to stay updated with the latest technological advancements necessitates substantial investments in corporate e-learning solutions. Moreover, the cost-effectiveness of e-learning solutions is another driving factor. In terms of growth, the market is expected to experience a notable increase, with mobile learning being a significant contributor. Approximately 55% of employees in North America use mobile devices for learning purposes, and this trend is projected to continue.
Furthermore, the adoption of gamification techniques, personalized learning, and microlearning modules are gaining popularity, contributing to the market's expansion. In comparison to traditional classroom training, corporate e-learning offers numerous advantages, such as flexibility, cost savings, and access to a wider range of training materials. These benefits have led to a shift towards e-learning solutions, particularly in industries like healthcare, finance, and retail, where continuous learning is essential. In conclusion, the market in North America is experiencing substantial growth, driven by the increasing use of mobile devices, cost savings, and the need for continuous learning. Companies are recognizing the benefits of e-learning solutions and are investing heavily to equip their employees with the necessary skills to adapt to the rapidly evolving technological landscape.
Market Dynamics
Our researchers analyzed the data with 2024 as the base year, along with the key drivers, trends, and challenges. A holistic analysis of drivers will help companies refine their marketing strategies to gain a competitive advantage.
Maximizing Business Performance through Innovative Corporate E-Learning Solutions In today's fast-paced business environment, corporate e-learning has become a game-changer for organizations seeking to enhance employee performance, drive efficiency, and ensure compliance. Integrating an e-learning platform with HRIS (Human Resource Information Systems) streamlines administrative tasks by 15%, allowing HR teams to focus on strategic initiatives (Source: Brandon Hall Group). Effective microlearning modules, designed with short, focused content, improve knowledge retention by 50% compared to traditional training methods (Source: LinkedIn Learning). Gamification in e-learning courses boosts engagement and motivation, leading to a 19% increase in learning effectiveness (Source: Gartner). Measuring the ROI of corporate e-learning programs is crucial. Learning analytics help organizations track progress, identify skill gaps, and optimize training investments. Building a strong corporate learning culture is essential for long-term success. Best practices include implementing blended learning strategies, utilizing virtual classrooms for interactive training, and creating engaging elearning experiences for diverse learners. Innovative e-learning solutions like mobile-first experiences, virtual reality for employee training, and AI-driven personalization are revolutionizing corporate training. Developing competency-based training programs and designing scenario-based learning experiences further enhance employee skills and knowledge. Optimizing e-learning content for mobile devices and implementing a robust learning content management system ensure accessibility and ease of use for all learners. Choosing the right e-learning authoring tool and designing effective online course delivery strategies are critical for successful implementation. In conclusion, corporate e-learning offers numerous benefits, from performance improvements and efficiency gains to compliance and innovation. By leveraging the latest trends and best practices, organizations can create engaging, effective, and accessible learning experiences that drive business success.
What are the key market drivers leading to the rise in the adoption of Corporate E-Learning Industry?
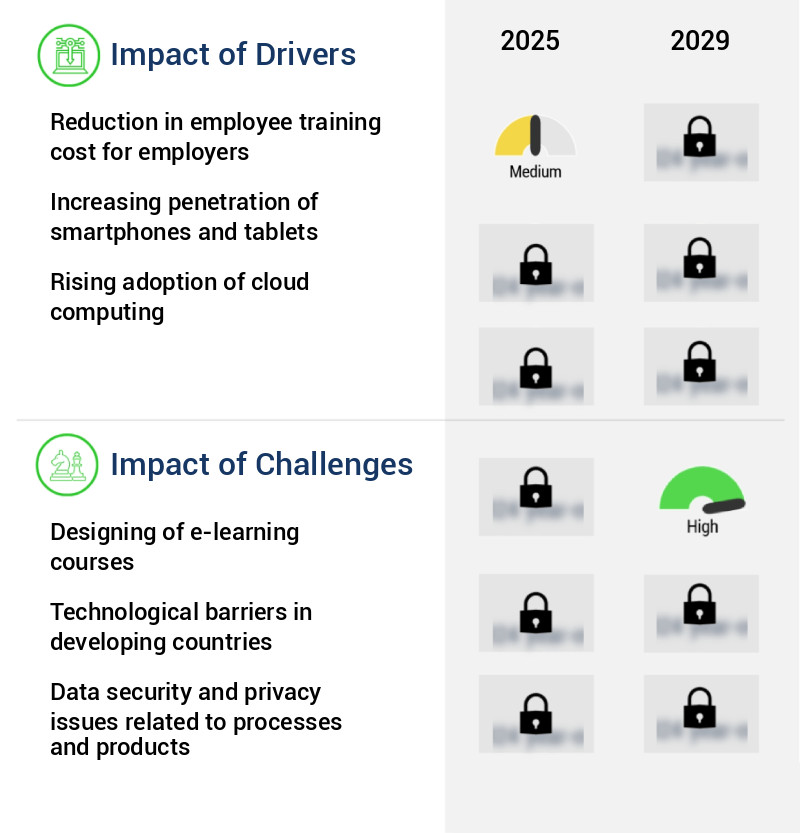
- The significant decrease in employee training costs serves as the primary market motivator for employers.
- Corporate e-learning has emerged as a cost-effective solution for organizations seeking to train their employees efficiently. By eliminating the need for travel and hospitality expenses for instructors, e-learning enables companies to save on training costs. Moreover, e-learning modules can be easily deployed globally, allowing organizations to use the same training materials across various offices, thereby minimizing expenses. The initial investment required to purchase e-learning modules is often offset by the significantly reduced variable cost per employee. Employees can access and revisit e-learning content multiple times at no additional cost, ensuring they fully understand the material. Furthermore, e-learning can help reduce employee turnover, as new hires require less training when existing employees have already gone through the e-learning modules.
- For instance, the Bank of Ireland reported substantial savings in Learning and Development (L&D) costs after implementing Learningzone, a corporate e-learning system. This trend is not unique to the banking sector, as various industries have embraced e-learning to optimize their training programs and reduce costs. E-learning's flexibility and accessibility have made it an indispensable tool for organizations looking to streamline their training processes and enhance their workforce's skills. Its ability to cater to diverse learning styles and schedules, as well as its potential for real-time assessments and analytics, make it an increasingly popular choice for corporate training.
What are the market trends shaping the Corporate E-Learning Industry?
- The adoption of microlearning is an emerging market trend. Corporate e-learning, a vital component of modern workforce development, has witnessed significant shifts in recent years. Micro-learning, an innovative approach to e-learning, has gained prominence due to its effectiveness in addressing the challenges of short attention spans and diverse learning styles. Micro-learning deals with the use of bite-sized learning modules and short-term learning activities. The popularity of micro-learning is on the rise, with an increasing focus on personalization and adaptive learning. Employees find precise, concise, and relevant content more engaging and effective. In a fast-paced business environment, micro-learning offers a flexible and efficient solution for continuous learning and skill development.
- Corporate e-learning companies, such as Allen Interactions and CommLab India, are capitalizing on this trend by providing microlearning solutions. These solutions enable organizations to deliver targeted training content to their workforce in a format that is easily accessible and adaptable to individual learning preferences. The adoption of micro-learning is a testament to the evolving nature of the market. As businesses continue to prioritize workforce development and adapt to the changing learning landscape, the demand for flexible, effective, and personalized training solutions will only grow. In comparison to traditional e-learning methods, micro-learning offers numerous advantages. It allows learners to consume content at their own pace, in short bursts, and on-demand.
- This flexibility not only enhances learner engagement but also improves knowledge retention and application. In conclusion, the market is undergoing a transformation, with micro-learning emerging as a key trend. This shift towards bite-sized, personalized, and adaptive learning solutions is set to redefine the way organizations approach workforce development and training.
What challenges does the Corporate E-Learning Industry face during its growth?
- The creation of effective e-learning courses poses a significant challenge and is a crucial factor influencing the growth of the industry.
- The market encompasses a vast array of digital learning solutions designed to cater to the training needs of businesses. This dynamic market is characterized by continuous evolution, with emerging technologies and shifting trends shaping its landscape. E-learning solutions enable organizations to deliver training programs to employees in a flexible, cost-effective, and accessible manner. One significant aspect of the market is its application across various sectors. Companies in industries such as healthcare, finance, and technology heavily invest in e-learning to enhance employee skills and knowledge. For instance, healthcare organizations leverage e-learning to provide ongoing training for medical professionals, ensuring they stay updated with the latest medical practices and regulations.
- Moreover, the e-learning market is marked by intense competition, with companies continually innovating to meet the evolving demands of businesses. To stand out, companies focus on creating engaging and interactive learning experiences. This approach not only makes the courses more memorable but also helps to maintain learner interest and motivation. Comparing the growth of the e-learning market in two distinct industries, the technology sector experienced a notable increase in e-learning adoption, with companies investing heavily in digital training solutions. In contrast, the healthcare sector saw a more moderate growth rate, with a greater emphasis on compliance training and regulatory adherence. Despite these differences, both industries recognize the value of e-learning in enhancing workforce capabilities and driving business success.
Exclusive Customer Landscape
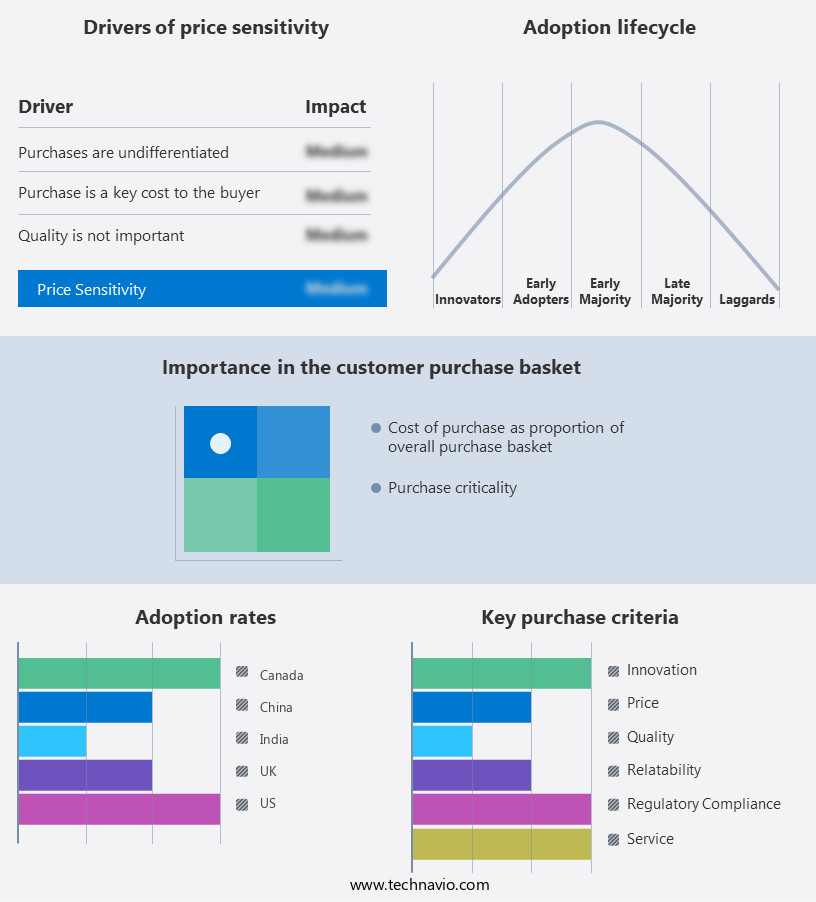
The corporate e-learning market forecasting report includes the adoption lifecycle of the market, covering from the innovator's stage to the laggard's stage. It focuses on adoption rates in different regions based on penetration. Furthermore, the corporate e-learning market report also includes key purchase criteria and drivers of price sensitivity to help companies evaluate and develop their market growth analysis strategies.
Customer Landscape of Corporate E-Learning Industry
Key Companies & Market Insights
Companies are implementing various strategies, such as strategic alliances, corporate e-learning market forecast, partnerships, mergers and acquisitions, geographical expansion, and product/service launches, to enhance their presence in the industry.
Adobe - The company specializes in corporate e-learning solutions, delivering training through Articulate 360's extensive offerings, including courses, webinars, and videos. This platform empowers businesses to enhance employee skills and knowledge effectively and efficiently.
The industry research and growth report includes detailed analyses of the competitive landscape of the market and information about key companies, including:
- Adobe
- Articulate Global Inc.
- Cegid SA
- Cegos Group
- Churchill Square Consulting Ltd.
- City and Guilds Group
- CommLab India LLP
- Cornerstone OnDemand Inc.
- Cross Knowledge
- D2L Inc.
- Designing Digitally Inc.
- EI Design Pvt. Ltd.
- G Cube Webwide Software Pvt. Ltd.
- Infopro Learning Inc.
- Learning Pool
- Learning Technologies Group Plc
- LinkedIn Corporation
- Mind Tools Ltd.
- Skillsoft
Qualitative and quantitative analysis of companies has been conducted to help clients understand the wider business environment as well as the strengths and weaknesses of key industry players. Data is qualitatively analyzed to categorize companies as pure play, category-focused, industry-focused, and diversified; it is quantitatively analyzed to categorize companies as dominant, leading, strong, tentative, and weak.
Recent Development and News in Corporate E-Learning Market
- In January 2024, Microsoft announced the integration of its Teams platform with D2L's Brightspace, allowing corporations to create and manage corporate e-learning programs directly within Microsoft Teams (Microsoft Press Release). This collaboration aimed to streamline corporate training processes and enhance productivity.
- In March 2024, Coursera, an online learning platform, secured a USD120 million Series E funding round, led by BlackRock, bringing its total funding to over USD410 million (TechCrunch). This investment was intended to fuel product innovation and expand its corporate offerings.
- In May 2024, LinkedIn Learning and Adobe signed a strategic partnership to integrate LinkedIn Learning content into Adobe Creative Cloud, enabling subscribers to access professional development courses directly within their creative tools (LinkedIn Press Release). This collaboration aimed to help professionals upskill and stay competitive in the job market.
- In January 2025, IBM announced the acquisition of Talentsoft, a European HR tech company specializing in talent management and e-learning solutions, for an undisclosed amount (IBM Press Release). This acquisition was intended to strengthen IBM's HR offerings and expand its presence in the European market.
Research Analyst Overview
- The market continues to evolve, with a growing emphasis on innovative learning platforms that engage and effectively train employees. Gamified learning platforms, for instance, integrate game elements into the learning process to increase learner motivation and engagement. Scenario-based learning, another trend, simulates real-world situations to help employees develop problem-solving skills. Employee training platforms, a critical component of this market, deliver online courses to a global workforce. Learning management systems (LMS) facilitate the administration, tracking, and reporting of these courses. Interactive simulations provide immersive learning experiences, enabling employees to practice skills in a safe and controlled environment.
- Online course delivery has become the norm, with learning analytics dashboards offering valuable insights into learner progress and performance. These data-driven learning insights help organizations optimize their training programs and improve overall employee development. The market for e-learning solutions is expected to grow by 10% annually, driven by the increasing demand for flexible, cost-effective, and accessible training options. Gamified learning platforms, scenario-based learning, and interactive simulations are key areas of investment, as organizations seek to enhance employee engagement and skill development. Learning experience platforms, collaborative learning tools, and mobile learning apps are also gaining popularity, providing learners with personalized, on-demand access to training resources.
- Competency-based training and blended learning models further enrich the corporate e-learning landscape, offering customized learning paths and combining various instructional methods. In the realm of accessibility standards, e-learning solutions must cater to diverse learners, including those with disabilities. Virtual reality training and custom elearning development are emerging trends, offering immersive, interactive, and engaging learning experiences. As organizations navigate this dynamic market, they must stay informed of the latest trends and technologies to effectively train and develop their workforce.
Dive into Technavio's robust research methodology, blending expert interviews, extensive data synthesis, and validated models for unparalleled Corporate E-Learning Market insights. See full methodology.
|
Market Scope |
|
|
Report Coverage |
Details |
|
Page number |
198 |
|
Base year |
2024 |
|
Historic period |
2019-2023 |
|
Forecast period |
2025-2029 |
|
Growth momentum & CAGR |
Accelerate at a CAGR of 12.7% |
|
Market growth 2025-2029 |
USD 131.01 billion |
|
Market structure |
Fragmented |
|
YoY growth 2024-2025(%) |
11.3 |
|
Key countries |
US, China, Germany, Canada, India, South Korea, France, Japan, Italy, Brazil, UAE, UK, and Spain |
|
Competitive landscape |
Leading Companies, Market Positioning of Companies, Competitive Strategies, and Industry Risks |
What are the Key Data Covered in this Corporate E-Learning Market Research and Growth Report?
- CAGR of the Corporate E-Learning industry during the forecast period
- Detailed information on factors that will drive the growth and forecasting between 2025 and 2029
- Precise estimation of the size of the market and its contribution of the industry in focus to the parent market
- Accurate predictions about upcoming growth and trends and changes in consumer behaviour
- Growth of the market across North America, Europe, APAC, South America, and Middle East and Africa
- Thorough analysis of the market's competitive landscape and detailed information about companies
- Comprehensive analysis of factors that will challenge the corporate e-learning market growth of industry companies
We can help! Our analysts can customize this corporate e-learning market research report to meet your requirements.
 RIA -
RIA - 
