Corrugated Packaging Software Market Analysis, Size, and Forecast 2026-2030: APAC (China, Japan, and India), North America (US, Canada, and Mexico), Europe (Germany, UK, and France), Middle East and Africa (Saudi Arabia, UAE, and South Africa), South America (Brazil, Argentina, and Chile), and Rest of World (ROW)

Corrugated Packaging Software Market Analysis, Size, and Forecast 2026-2030:
APAC (China, Japan, and India), North America (US, Canada, and Mexico), Europe (Germany, UK, and France), Middle East and Africa (Saudi Arabia, UAE, and South Africa), South America (Brazil, Argentina, and Chile), and Rest of World (ROW)

Published: Oct 2026 315 Pages SKU: IRTNTR44120

Market Overview at a Glance

$19.80 B
Market Opportunity
18.1%
CAGR 2025 - 2030
34.1%
APAC Growth
$8.63 B
On-premises segment 2024

Corrugated Packaging Software Market Size 2026-2030

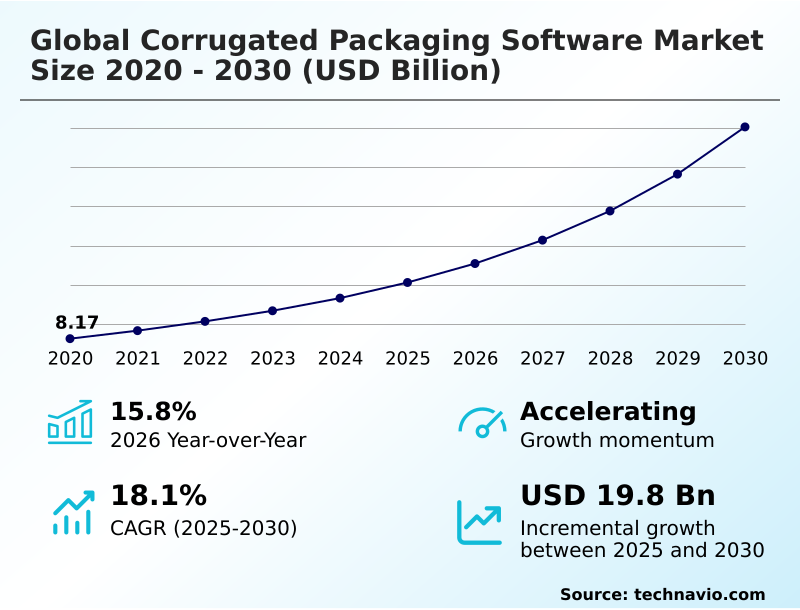
The corrugated packaging software market size is valued to increase by USD 19.80 billion, at a CAGR of 18.1% from 2025 to 2030. Proliferation of e-commerce and shifting retail dynamics will drive the corrugated packaging software market.

Major Market Trends & Insights

  • APAC dominated the market and accounted for a 34.1% growth during the forecast period.
  • By Deployment - On-premises segment was valued at USD 8.63 billion in 2024
  • By Type - Packaged segment accounted for the largest market revenue share in 2024

Market Size & Forecast

  • Market Opportunities: USD 26.95 billion
  • Market Future Opportunities: USD 19.80 billion
  • CAGR from 2025 to 2030 : 18.1%

Market Summary

  • The Corrugated Packaging Software Market demonstrates robust technological integration as converters transition from manual planning to fully digitalized operations. Facilities managing complex retail fulfillment require advanced platforms to balance material strength with dimensional efficiency. For instance, plants utilizing integrated systems for material volume reduction observe a 25% decrease in void fill consumption compared to conventional design approaches.
  • The imperative for environmental sustainability acts as a major catalyst, compelling manufacturers to deploy tools that optimize board layouts and track recycled content metrics. Conversely, bridging modern applications with older, proprietary converting machinery presents a formidable integration barrier, often extending implementation timelines and disrupting established workflows.
  • As supply chains mandate stricter traceability, the reliance on automated architecture becomes a fundamental necessity rather than a discretionary upgrade. By leveraging these solutions, enterprises effectively mitigate administrative overhead and enforce consistent quality standards across distributed manufacturing networks.

What will be the Size of the Corrugated Packaging Software Market during the forecast period?
Get Key Insights on Market Forecast (PDF) Get Free Sample

How is the Corrugated Packaging Software Market Segmented?

The corrugated packaging software industry research report provides comprehensive data (region-wise segment analysis), with forecasts and estimates in "USD million" for the period 2026-2030, as well as historical data from 2020-2024 for the following segments.

  • Deployment
    • On-premises
    • Cloud
  • Type
    • Packaged
    • Standalone
  • End-user
    • Food and beverage
    • Electronics
    • Healthcare
    • Personal care
    • Others
  • Sector
    • SMEs
    • Large enterprises
  • Geography
    • APAC
      • China
      • Japan
      • India
      • South Korea
      • Australia
      • Indonesia
    • North America
      • US
      • Canada
      • Mexico
    • Europe
      • Germany
      • UK
      • France
      • Italy
      • Spain
      • The Netherlands
    • Middle East and Africa
      • Saudi Arabia
      • UAE
      • South Africa
      • Turkey
      • Egypt
    • South America
      • Brazil
      • Argentina
      • Chile

By Deployment Insights

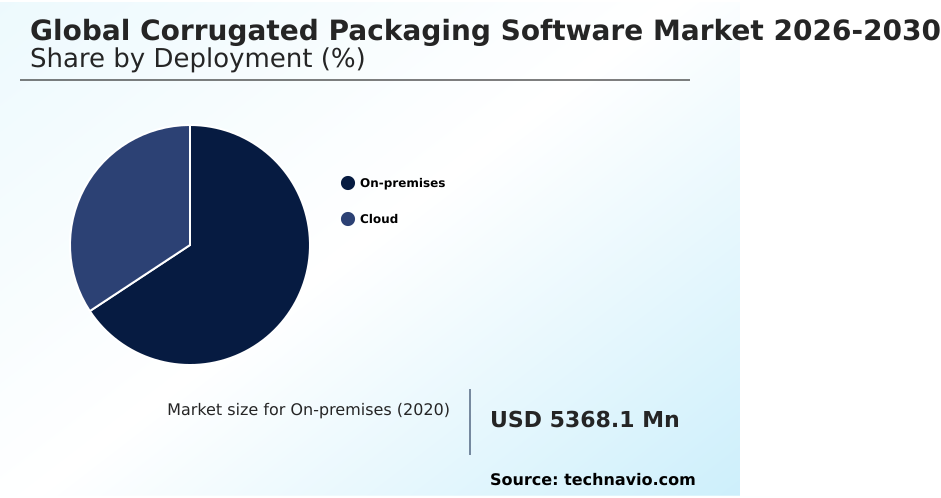
The on-premises segment is estimated to witness significant growth during the forecast period.

Enterprise manufacturing relies on localized deployments to maintain direct oversight of sensitive proprietary designs and secure industrial workflow digitalization.

Facilities leveraging these closed environments report a 15% improvement in error detection due to the elimination of latency in shop floor data capture.

The integration of manufacturing execution systems directly with legacy machinery api connectivity allows organizations to achieve tightly coupled operational control.

By bypassing internet dependencies and avoiding heterogeneous infrastructure bridges, plants utilizing these architectures experience a 20% higher uptime compared to external alternatives. This stability ensures robust dynamic production planning and precise automated quality control, driving continuous process improvement.

Ultimately, localized smart factory integration enables converters to perfect inventory control synchronization without exposing core databases to external vulnerabilities.
Get Free Sample

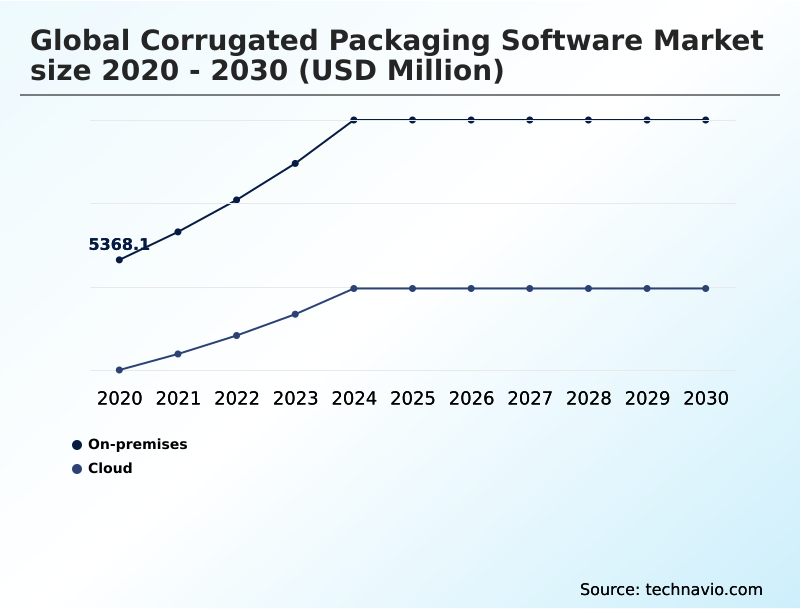
The On-premises segment was valued at USD 8.63 billion in 2024 and showed a gradual increase during the forecast period.
Get Free Sample

Regional Analysis

APAC is estimated to contribute 34.1% to the growth of the global market during the forecast period.Technavio’s analysts have elaborately explained the regional trends and drivers that shape the market during the forecast period.
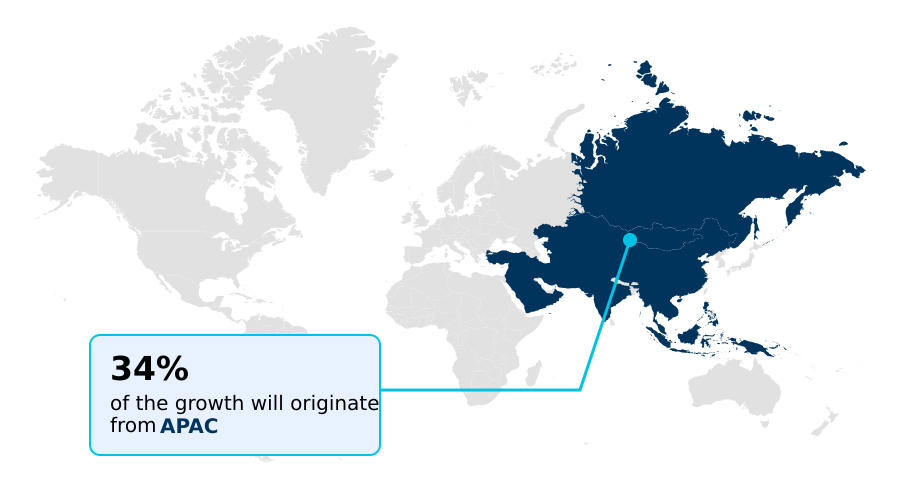
See How Corrugated Packaging Software Market Demand is Rising in APAC Get Free Sample

Industrial environments across distinct geographies exhibit diverging adoption patterns for digitalization based on unique supply chain maturity and regional regulations.

Operations in APAC prioritize export-oriented logistics, where rapid industrialization fuels a 34% higher adoption rate of robotic process automation tools compared to South American centers.

This acceleration requires intelligent raw material procurement and automated logistics sorting to manage high-volume electronics shipments needing electrostatic discharge protection.

Meanwhile, European facilities operate under strict environmental mandates, driving a 28% faster implementation of platforms featuring circular economy compliance and life cycle assessment tracking than North American counterparts.

To handle these demands, businesses deploy machine learning analytics to streamline cross-departmental data visibility and enforce stringent eco-friendly packaging parameters, guaranteeing precise carbon footprint reporting across distributed plants.

Market Dynamics

Our researchers analyzed the data with 2025 as the base year, along with the key drivers, trends, and challenges. A holistic analysis of drivers will help companies refine their marketing strategies to gain a competitive advantage.

  • Digital transformation across the industrial packaging sector is fundamentally reshaping how enterprises approach operational efficiency and structural design. Manufacturers are increasingly prioritizing specialized digital modules to mitigate waste and enhance throughput. By optimizing automated nesting efficiency, converting plants can drastically reduce raw material consumption, allowing them to achieve a 15% better yield ratio than facilities relying on manual layout planning.
  • This comparative advantage directly impacts supply chain profitability and sustainability metrics. Furthermore, ensuring uninterrupted machinery operation is critical for maintaining high-volume production schedules. Facilities implementing predictive equipment maintenance scheduling experience significantly lower instances of unplanned downtime, safeguarding capacity and extending the lifespan of capital-intensive converting assets. The transition toward high-speed customization also requires robust prepress architectures.
  • By streamlining digital prepress workflows, organizations eliminate legacy bottlenecks, accelerating the transition from initial design concept to final production. Simultaneously, managing variable data printing allows brands to execute highly targeted, serialized marketing campaigns directly on shipping containers without sacrificing line speed.
  • Integrating these multifaceted technological capabilities ensures that modern packaging operations remain agile, responsive to shifting e-commerce demands, and capable of executing complex logistical requirements with precision.
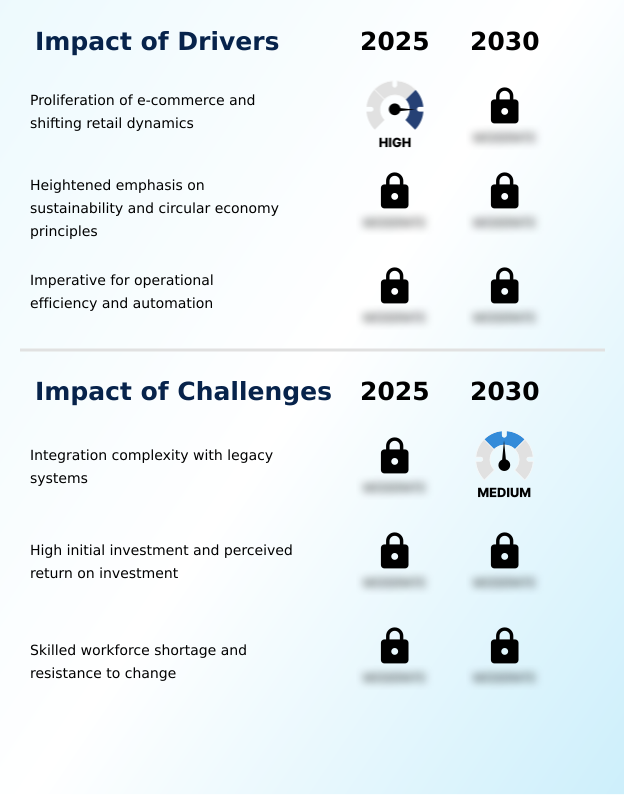
What are the key market drivers leading to the rise in the adoption of Corrugated Packaging Software Industry?

  • The rapid proliferation of electronic commerce and evolving retail supply chain dynamics serve as primary catalysts propelling the adoption of advanced structural design solutions.

  • The explosive growth of direct-to-consumer delivery networks compels manufacturers to engineer highly specialized protective solutions, accelerating the demand for sophisticated design platforms.
  • Because single-parcel transit environments subject goods to severe logistical stresses, engineers increasingly utilize three-dimensional structural modeling and finite element analysis to guarantee heavy-duty compression strength.
  • Implementing generative design algorithms enables enterprises to realize a 22% reduction in product return rates and a 15% decrease in overall shipping volume through precise rightsizing material optimization.
  • Furthermore, industries managing sensitive therapeutics necessitate aseptic access design, cold chain ventilation modeling, and temperature-controlled tracking to ensure product viability.
  • By integrating tamper-evident structural design and robust supply chain serialization, packaging suppliers empower clients to mitigate regulatory risks and improve distribution reliability.

What are the market trends shaping the Corrugated Packaging Software Industry?

  • The integration of artificial intelligence and machine learning represents a defining trend within the industry. This technological evolution transitions passive design tools into proactive systems capable of generative optimization and predictive analytics.

  • The rapid migration from legacy on-premises infrastructure to a multi-tenant saas platform model fundamentally redefines operational agility in the industrial packaging sector. This architectural shift occurs because centralized cloud-native architecture eliminates localized server maintenance friction, enabling facilities to synchronize omnichannel retail fulfillment seamlessly.
  • Consequently, organizations adopting these networks report a 35% faster deployment of system upgrades and a 20% improvement in just-in-time production efficiency. The integration of advanced color management and variable data printing empowers converters to execute intricate subscription box personalization without compromising line speed. By streamlining automated prepress workflows, businesses drastically reduce setup delays by 25%.
  • This automation accelerates the engineering of complex retail-ready format engineering, maximizing throughput for specialized short-run orders.

What challenges does the Corrugated Packaging Software Industry face during its growth?

  • The integration complexity associated with heterogeneous legacy systems remains a significant operational barrier that hampers the seamless deployment of modern digital platforms.

  • Attempting to unify advanced digital applications with entrenched manual workflows presents a formidable operational limitation for established packaging converters. This friction arises because older workforces often lack the technical fluency required to operate sophisticated digital twin simulation interfaces or configure automated machine setup protocols.
  • Consequently, facilities attempting rapid modernization experience a 40% longer software implementation cycle and a 15% drop in short-term throughput compared to digitally mature plants. The complexity of transitioning from physical testing to virtual prototyping simulation hampers the rapid development of advanced structural integrity.
  • Furthermore, deploying predictive equipment maintenance and executing predictive demand forecasting requires pristine historical data, which many legacy plants lack. This data deficit temporarily obstructs efforts to perfect automated nesting optimization, heavily straining change management budgets.

Exclusive Technavio Analysis on Customer Landscape

The corrugated packaging software market forecasting report includes the adoption lifecycle of the market, covering from the innovator’s stage to the laggard’s stage. It focuses on adoption rates in different regions based on penetration. Furthermore, the corrugated packaging software market report also includes key purchase criteria and drivers of price sensitivity to help companies evaluate and develop their market growth analysis strategies.
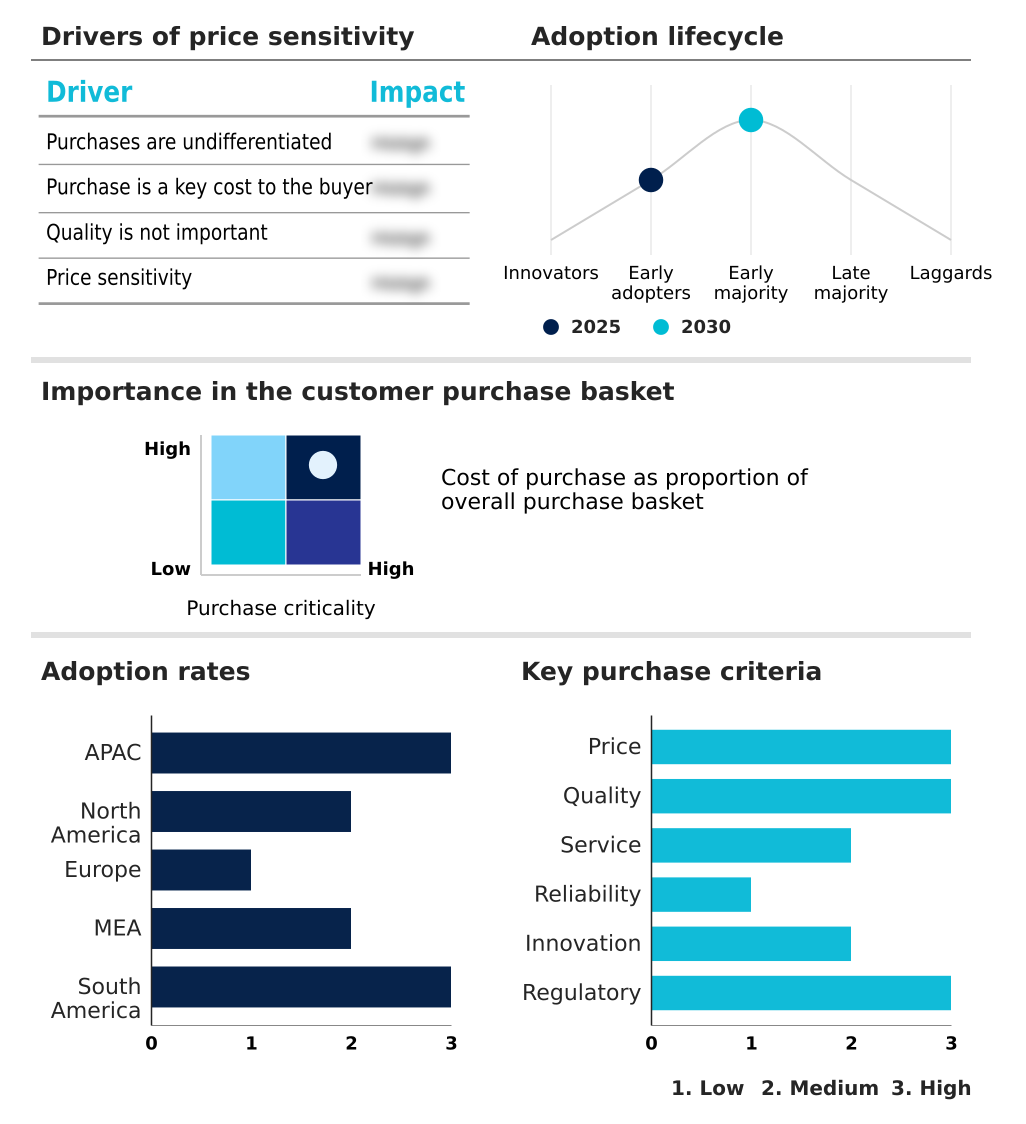
Customer Landscape of Corrugated Packaging Software Industry

Competitive Landscape

Companies are implementing various strategies, such as strategic alliances, corrugated packaging software market forecast, partnerships, mergers and acquisitions, geographical expansion, and product/service launches, to enhance their presence in the industry.

Advantive LLC - The product portfolio delivers robust structural design and comprehensive manufacturing management capabilities, optimizing production scheduling and supply chain operations for advanced industrial packaging workflows.

The industry research and growth report includes detailed analyses of the competitive landscape of the market and information about key companies, including:

  • Advantive LLC
  • AICOMP Consulting GmbH
  • Amtech Software LLC
  • Arden Software Ltd.
  • Dexciss Technology Pvt. Ltd.
  • Electronics For Imaging Inc.
  • Epicor Software Corp.
  • EPS Software
  • ESS Packaging Logistics
  • Microsoft Corp.
  • Nippon Steel Corp.
  • Odoo SA
  • Oracle Corp.
  • PPTS Solutions
  • RITC Pvt. Ltd.
  • SAP SE
  • Shree Balaji Infotech
  • Sistrade Software Consulting SA
  • SYSPRO Pty. Ltd.
  • theurer.com GmbH

Qualitative and quantitative analysis of companies has been conducted to help clients understand the wider business environment as well as the strengths and weaknesses of key industry players. Data is qualitatively analyzed to categorize companies as pure play, category-focused, industry-focused, and diversified; it is quantitatively analyzed to categorize companies as dominant, leading, strong, tentative, and weak.

Recent Development and News in Corrugated packaging software market

  • In the Application Software industry, the deployment of artificial intelligence algorithms for workflow automation has reduced prepress bottlenecks by 30%, directly impacting Corrugated Packaging Software demand by requiring platforms capable of seamless design generation.
  • The widespread adoption of cloud computing architecture across enterprise IT environments has lowered infrastructure barriers by 25% for small enterprises, accelerating the shift toward hosted subscription solutions in the packaging sector.
  • Stringent European data privacy regulations and circular economy mandates have forced supply chains to enhance material traceability, fueling a 20% increase in demand for software systems equipped with robust audit tracking features.
  • The integration of digital simulation tools in industrial manufacturing has improved asset utilization by 15%, driving the need for sophisticated software that supports proactive equipment monitoring and continuous throughput improvement.

Dive into Technavio’s robust research methodology, blending expert interviews, extensive data synthesis, and validated models for unparalleled Corrugated Packaging Software Market insights. See full methodology.

Market Scope
Page number 315
Base year 2025
Historic period 2020-2024
Forecast period 2026-2030
Growth momentum & CAGR Accelerate at a CAGR of 18.1%
Market growth 2026-2030 USD 19803.5 million
Market structure Fragmented
YoY growth 2025-2026(%) 15.8%
Key countries China, Japan, India, South Korea, Australia, Indonesia, US, Canada, Mexico, Germany, UK, France, Italy, Spain, The Netherlands, Saudi Arabia, UAE, South Africa, Turkey, Egypt, Brazil, Argentina and Chile
Competitive landscape Leading Companies, Market Positioning of Companies, Competitive Strategies, and Industry Risks

Request Free Sample

Research Analyst Overview

  • The integration of next-generation digital platforms represents a critical evolution in structural engineering and production management for the industrial packaging sector. Boardroom strategies increasingly prioritize the deployment of three-dimensional modeling tools to accelerate product development cycles and align with stringent corporate sustainability targets.
  • By leveraging virtual testing environments, enterprises mitigate the need for costly physical trials, allowing them to achieve a 40% reduction in sample iteration time compared to traditional testing methodologies. This capability directly supports executive mandates for cost containment and accelerated speed-to-market.
  • Furthermore, the implementation of advanced stress analysis allows engineers to validate structural integrity under simulated transit conditions, significantly reducing product damage rates. As manufacturing complexities escalate, integrating real-time simulation and automated workflows provides executive teams with unparalleled operational visibility.
  • Organizations utilizing these sophisticated systems successfully orchestrate continuous production flows, ensuring that high-volume converting facilities maintain resilience against supply chain volatility while fulfilling demanding client specifications with precision.

What are the Key Data Covered in this Corrugated Packaging Software Market Research and Growth Report?

  • What is the expected growth of the Corrugated Packaging Software Market between 2026 and 2030?

    • USD 19.80 billion, at a CAGR of 18.1%

  • What segmentation does the market report cover?

    • The report is segmented by Deployment (On-premises, and Cloud), Type (Packaged, and Standalone), End-user (Food and beverage, Electronics, Healthcare, Personal care, and Others), Sector (SMEs, and Large enterprises) and Geography (APAC, North America, Europe, Middle East and Africa, South America)

  • Which regions are analyzed in the report?

    • APAC, North America, Europe, Middle East and Africa and South America

  • What are the key growth drivers and market challenges?

    • Proliferation of e-commerce and shifting retail dynamics, Integration complexity with legacy systems

  • Who are the major players in the Corrugated Packaging Software Market?

    • Advantive LLC, AICOMP Consulting GmbH, Amtech Software LLC, Arden Software Ltd., Dexciss Technology Pvt. Ltd., Electronics For Imaging Inc., Epicor Software Corp., EPS Software, ESS Packaging Logistics, Microsoft Corp., Nippon Steel Corp., Odoo SA, Oracle Corp., PPTS Solutions, RITC Pvt. Ltd., SAP SE, Shree Balaji Infotech, Sistrade Software Consulting SA, SYSPRO Pty. Ltd. and theurer.com GmbH

Market Research Insights

  • The transition toward digitalized manufacturing necessitates sophisticated frameworks capable of driving complex operational workflows. Enterprises utilizing advanced platforms report a 22% improvement in inventory turnover efficiency by enforcing targeted software models. Implementing these systems enables operations to deploy predictive demand forecasting, which actively reduces supply chain bottlenecks and enhances overall capacity utilization by 18%.
  • Furthermore, facilities adopting these tools accelerate mono-material design exploration, significantly reducing waste. These systems also empower businesses to automate customized dunnage creation and ensure accurate carbon footprint reporting. These measurable operational enhancements empower converting facilities to navigate complex logistical demands while maintaining stringent quality and environmental standards across their production networks.

We can help! Our analysts can customize this corrugated packaging software market research report to meet your requirements.

Get in touch

1. Executive Summary

1.1 Market overview

Executive Summary - Chart on Market Overview
Executive Summary - Data Table on Market Overview
Executive Summary - Chart on Global Market Characteristics
Executive Summary - Chart on Market by Geography
Executive Summary - Chart on Market Segmentation by Deployment
Executive Summary - Chart on Market Segmentation by Type
Executive Summary - Chart on Market Segmentation by End-user
Executive Summary - Chart on Market Segmentation by Sector
Executive Summary - Chart on Incremental Growth
Executive Summary - Data Table on Incremental Growth
Executive Summary - Chart on Company Market Positioning

2. Technavio Analysis

2.1 Analysis of price sensitivity, lifecycle, customer purchase basket, adoption rates, and purchase criteria

2.2 Criticality of inputs and Factors of differentiation

Chart on Overview on criticality of inputs and factors of differentiation

2.3 Factors of disruption

Chart on Overview on factors of disruption

2.4 Impact of drivers and challenges

Chart on Impact of drivers and challenges in 2025 and 2030

3. Market Landscape

3.1 Market ecosystem

Chart on Parent Market
Data Table on - Parent Market

3.2 Market characteristics

Chart on Market characteristics analysis

3.3 Value chain analysis

Chart on Value chain analysis

4. Market Sizing

4.1 Market definition

Data Table on Offerings of companies included in the market definition

4.2 Market segment analysis

Market segments

4.3 Market size 2025

4.4 Market outlook: Forecast for 2025-2030

Chart on Global - Market size and forecast 2025-2030 ($ million)
Data Table on Global - Market size and forecast 2025-2030 ($ million)
Chart on Global Market: Year-over-year growth 2025-2030 (%)
Data Table on Global Market: Year-over-year growth 2025-2030 (%)

5. Historic Market Size

5.1 Global Corrugated Packaging Software Market 2020 - 2024

Historic Market Size - Data Table on Global Corrugated Packaging Software Market 2020 - 2024 ($ million)

5.2 Deployment segment analysis 2020 - 2024

Historic Market Size - Deployment Segment 2020 - 2024 ($ million)

5.3 Type segment analysis 2020 - 2024

Historic Market Size - Type Segment 2020 - 2024 ($ million)

5.4 End-user segment analysis 2020 - 2024

Historic Market Size - End-user Segment 2020 - 2024 ($ million)

5.5 Sector segment analysis 2020 - 2024

Historic Market Size - Sector Segment 2020 - 2024 ($ million)

5.6 Geography segment analysis 2020 - 2024

Historic Market Size - Geography Segment 2020 - 2024 ($ million)

5.7 Country segment analysis 2020 - 2024

Historic Market Size - Country Segment 2020 - 2024 ($ million)

6. Qualitative Analysis

6.1 Impact of AI on Global Corrugated Packaging Software Market

6.2 Impact of Geopolitical Conflicts on Global Corrugated Packaging Software Market

7. Five Forces Analysis

7.1 Five forces summary

Five forces analysis - Comparison between 2025 and 2030

7.2 Bargaining power of buyers

Bargaining power of buyers - Impact of key factors 2025 and 2030

7.3 Bargaining power of suppliers

Bargaining power of suppliers - Impact of key factors in 2025 and 2030

7.4 Threat of new entrants

Threat of new entrants - Impact of key factors in 2025 and 2030

7.5 Threat of substitutes

Threat of substitutes - Impact of key factors in 2025 and 2030

7.6 Threat of rivalry

Threat of rivalry - Impact of key factors in 2025 and 2030

7.7 Market condition

Chart on Market condition - Five forces 2025 and 2030

8. Market Segmentation by Deployment

8.1 Market segments

Chart on Deployment - Market share 2025-2030 (%)
Data Table on Deployment - Market share 2025-2030 (%)

8.2 Comparison by Deployment

Chart on Comparison by Deployment
Data Table on Comparison by Deployment

8.3 On-premises - Market size and forecast 2025-2030

Chart on On-premises - Market size and forecast 2025-2030 ($ million)
Data Table on On-premises - Market size and forecast 2025-2030 ($ million)
Chart on On-premises - Year-over-year growth 2025-2030 (%)
Data Table on On-premises - Year-over-year growth 2025-2030 (%)

8.4 Cloud - Market size and forecast 2025-2030

Chart on Cloud - Market size and forecast 2025-2030 ($ million)
Data Table on Cloud - Market size and forecast 2025-2030 ($ million)
Chart on Cloud - Year-over-year growth 2025-2030 (%)
Data Table on Cloud - Year-over-year growth 2025-2030 (%)

8.5 Market opportunity by Deployment

Market opportunity by Deployment ($ million)
Data Table on Market opportunity by Deployment ($ million)

9. Market Segmentation by Type

9.1 Market segments

Chart on Type - Market share 2025-2030 (%)
Data Table on Type - Market share 2025-2030 (%)

9.2 Comparison by Type

Chart on Comparison by Type
Data Table on Comparison by Type

9.3 Packaged - Market size and forecast 2025-2030

Chart on Packaged - Market size and forecast 2025-2030 ($ million)
Data Table on Packaged - Market size and forecast 2025-2030 ($ million)
Chart on Packaged - Year-over-year growth 2025-2030 (%)
Data Table on Packaged - Year-over-year growth 2025-2030 (%)

9.4 Standalone - Market size and forecast 2025-2030

Chart on Standalone - Market size and forecast 2025-2030 ($ million)
Data Table on Standalone - Market size and forecast 2025-2030 ($ million)
Chart on Standalone - Year-over-year growth 2025-2030 (%)
Data Table on Standalone - Year-over-year growth 2025-2030 (%)

9.5 Market opportunity by Type

Market opportunity by Type ($ million)
Data Table on Market opportunity by Type ($ million)

10. Market Segmentation by End-user

10.1 Market segments

Chart on End-user - Market share 2025-2030 (%)
Data Table on End-user - Market share 2025-2030 (%)

10.2 Comparison by End-user

Chart on Comparison by End-user
Data Table on Comparison by End-user

10.3 Food and beverage - Market size and forecast 2025-2030

Chart on Food and beverage - Market size and forecast 2025-2030 ($ million)
Data Table on Food and beverage - Market size and forecast 2025-2030 ($ million)
Chart on Food and beverage - Year-over-year growth 2025-2030 (%)
Data Table on Food and beverage - Year-over-year growth 2025-2030 (%)

10.4 Electronics - Market size and forecast 2025-2030

Chart on Electronics - Market size and forecast 2025-2030 ($ million)
Data Table on Electronics - Market size and forecast 2025-2030 ($ million)
Chart on Electronics - Year-over-year growth 2025-2030 (%)
Data Table on Electronics - Year-over-year growth 2025-2030 (%)

10.5 Healthcare - Market size and forecast 2025-2030

Chart on Healthcare - Market size and forecast 2025-2030 ($ million)
Data Table on Healthcare - Market size and forecast 2025-2030 ($ million)
Chart on Healthcare - Year-over-year growth 2025-2030 (%)
Data Table on Healthcare - Year-over-year growth 2025-2030 (%)

10.6 Personal care - Market size and forecast 2025-2030

Chart on Personal care - Market size and forecast 2025-2030 ($ million)
Data Table on Personal care - Market size and forecast 2025-2030 ($ million)
Chart on Personal care - Year-over-year growth 2025-2030 (%)
Data Table on Personal care - Year-over-year growth 2025-2030 (%)

10.7 Others - Market size and forecast 2025-2030

Chart on Others - Market size and forecast 2025-2030 ($ million)
Data Table on Others - Market size and forecast 2025-2030 ($ million)
Chart on Others - Year-over-year growth 2025-2030 (%)
Data Table on Others - Year-over-year growth 2025-2030 (%)

10.8 Market opportunity by End-user

Market opportunity by End-user ($ million)
Data Table on Market opportunity by End-user ($ million)

11. Market Segmentation by Sector

11.1 Market segments

Chart on Sector - Market share 2025-2030 (%)
Data Table on Sector - Market share 2025-2030 (%)

11.2 Comparison by Sector

Chart on Comparison by Sector
Data Table on Comparison by Sector

11.3 SMEs - Market size and forecast 2025-2030

Chart on SMEs - Market size and forecast 2025-2030 ($ million)
Data Table on SMEs - Market size and forecast 2025-2030 ($ million)
Chart on SMEs - Year-over-year growth 2025-2030 (%)
Data Table on SMEs - Year-over-year growth 2025-2030 (%)

11.4 Large enterprises - Market size and forecast 2025-2030

Chart on Large enterprises - Market size and forecast 2025-2030 ($ million)
Data Table on Large enterprises - Market size and forecast 2025-2030 ($ million)
Chart on Large enterprises - Year-over-year growth 2025-2030 (%)
Data Table on Large enterprises - Year-over-year growth 2025-2030 (%)

11.5 Market opportunity by Sector

Market opportunity by Sector ($ million)
Data Table on Market opportunity by Sector ($ million)

12. Customer Landscape

12.1 Customer landscape overview

Analysis of price sensitivity, lifecycle, customer purchase basket, adoption rates, and purchase criteria

13. Geographic Landscape

13.1 Geographic segmentation

Chart on Market share by geography 2025-2030 (%)
Data Table on Market share by geography 2025-2030 (%)

13.2 Geographic comparison

Chart on Geographic comparison
Data Table on Geographic comparison

13.3 APAC - Market size and forecast 2025-2030

Chart on APAC - Market size and forecast 2025-2030 ($ million)
Data Table on APAC - Market size and forecast 2025-2030 ($ million)
Chart on APAC - Year-over-year growth 2025-2030 (%)
Data Table on APAC - Year-over-year growth 2025-2030 (%)
Chart on Regional Comparison - APAC
Data Table on Regional Comparison - APAC

13.3.1 China - Market size and forecast 2025-2030

Chart on China - Market size and forecast 2025-2030 ($ million)
Data Table on China - Market size and forecast 2025-2030 ($ million)
Chart on China - Year-over-year growth 2025-2030 (%)
Data Table on China - Year-over-year growth 2025-2030 (%)

13.3.2 Japan - Market size and forecast 2025-2030

Chart on Japan - Market size and forecast 2025-2030 ($ million)
Data Table on Japan - Market size and forecast 2025-2030 ($ million)
Chart on Japan - Year-over-year growth 2025-2030 (%)
Data Table on Japan - Year-over-year growth 2025-2030 (%)

13.3.3 India - Market size and forecast 2025-2030

Chart on India - Market size and forecast 2025-2030 ($ million)
Data Table on India - Market size and forecast 2025-2030 ($ million)
Chart on India - Year-over-year growth 2025-2030 (%)
Data Table on India - Year-over-year growth 2025-2030 (%)

13.3.4 South Korea - Market size and forecast 2025-2030

Chart on South Korea - Market size and forecast 2025-2030 ($ million)
Data Table on South Korea - Market size and forecast 2025-2030 ($ million)
Chart on South Korea - Year-over-year growth 2025-2030 (%)
Data Table on South Korea - Year-over-year growth 2025-2030 (%)

13.3.5 Australia - Market size and forecast 2025-2030

Chart on Australia - Market size and forecast 2025-2030 ($ million)
Data Table on Australia - Market size and forecast 2025-2030 ($ million)
Chart on Australia - Year-over-year growth 2025-2030 (%)
Data Table on Australia - Year-over-year growth 2025-2030 (%)

13.3.6 Indonesia - Market size and forecast 2025-2030

Chart on Indonesia - Market size and forecast 2025-2030 ($ million)
Data Table on Indonesia - Market size and forecast 2025-2030 ($ million)
Chart on Indonesia - Year-over-year growth 2025-2030 (%)
Data Table on Indonesia - Year-over-year growth 2025-2030 (%)

13.4 North America - Market size and forecast 2025-2030

Chart on North America - Market size and forecast 2025-2030 ($ million)
Data Table on North America - Market size and forecast 2025-2030 ($ million)
Chart on North America - Year-over-year growth 2025-2030 (%)
Data Table on North America - Year-over-year growth 2025-2030 (%)
Chart on Regional Comparison - North America
Data Table on Regional Comparison - North America

13.4.1 US - Market size and forecast 2025-2030

Chart on US - Market size and forecast 2025-2030 ($ million)
Data Table on US - Market size and forecast 2025-2030 ($ million)
Chart on US - Year-over-year growth 2025-2030 (%)
Data Table on US - Year-over-year growth 2025-2030 (%)

13.4.2 Canada - Market size and forecast 2025-2030

Chart on Canada - Market size and forecast 2025-2030 ($ million)
Data Table on Canada - Market size and forecast 2025-2030 ($ million)
Chart on Canada - Year-over-year growth 2025-2030 (%)
Data Table on Canada - Year-over-year growth 2025-2030 (%)

13.4.3 Mexico - Market size and forecast 2025-2030

Chart on Mexico - Market size and forecast 2025-2030 ($ million)
Data Table on Mexico - Market size and forecast 2025-2030 ($ million)
Chart on Mexico - Year-over-year growth 2025-2030 (%)
Data Table on Mexico - Year-over-year growth 2025-2030 (%)

13.5 Europe - Market size and forecast 2025-2030

Chart on Europe - Market size and forecast 2025-2030 ($ million)
Data Table on Europe - Market size and forecast 2025-2030 ($ million)
Chart on Europe - Year-over-year growth 2025-2030 (%)
Data Table on Europe - Year-over-year growth 2025-2030 (%)
Chart on Regional Comparison - Europe
Data Table on Regional Comparison - Europe

13.5.1 Germany - Market size and forecast 2025-2030

Chart on Germany - Market size and forecast 2025-2030 ($ million)
Data Table on Germany - Market size and forecast 2025-2030 ($ million)
Chart on Germany - Year-over-year growth 2025-2030 (%)
Data Table on Germany - Year-over-year growth 2025-2030 (%)

13.5.2 UK - Market size and forecast 2025-2030

Chart on UK - Market size and forecast 2025-2030 ($ million)
Data Table on UK - Market size and forecast 2025-2030 ($ million)
Chart on UK - Year-over-year growth 2025-2030 (%)
Data Table on UK - Year-over-year growth 2025-2030 (%)

13.5.3 France - Market size and forecast 2025-2030

Chart on France - Market size and forecast 2025-2030 ($ million)
Data Table on France - Market size and forecast 2025-2030 ($ million)
Chart on France - Year-over-year growth 2025-2030 (%)
Data Table on France - Year-over-year growth 2025-2030 (%)

13.5.4 Italy - Market size and forecast 2025-2030

Chart on Italy - Market size and forecast 2025-2030 ($ million)
Data Table on Italy - Market size and forecast 2025-2030 ($ million)
Chart on Italy - Year-over-year growth 2025-2030 (%)
Data Table on Italy - Year-over-year growth 2025-2030 (%)

13.5.5 Spain - Market size and forecast 2025-2030

Chart on Spain - Market size and forecast 2025-2030 ($ million)
Data Table on Spain - Market size and forecast 2025-2030 ($ million)
Chart on Spain - Year-over-year growth 2025-2030 (%)
Data Table on Spain - Year-over-year growth 2025-2030 (%)

13.5.6 The Netherlands - Market size and forecast 2025-2030

Chart on The Netherlands - Market size and forecast 2025-2030 ($ million)
Data Table on The Netherlands - Market size and forecast 2025-2030 ($ million)
Chart on The Netherlands - Year-over-year growth 2025-2030 (%)
Data Table on The Netherlands - Year-over-year growth 2025-2030 (%)

13.6 Middle East and Africa - Market size and forecast 2025-2030

Chart on Middle East and Africa - Market size and forecast 2025-2030 ($ million)
Data Table on Middle East and Africa - Market size and forecast 2025-2030 ($ million)
Chart on Middle East and Africa - Year-over-year growth 2025-2030 (%)
Data Table on Middle East and Africa - Year-over-year growth 2025-2030 (%)
Chart on Regional Comparison - Middle East and Africa
Data Table on Regional Comparison - Middle East and Africa

13.6.1 Saudi Arabia - Market size and forecast 2025-2030

Chart on Saudi Arabia - Market size and forecast 2025-2030 ($ million)
Data Table on Saudi Arabia - Market size and forecast 2025-2030 ($ million)
Chart on Saudi Arabia - Year-over-year growth 2025-2030 (%)
Data Table on Saudi Arabia - Year-over-year growth 2025-2030 (%)

13.6.2 UAE - Market size and forecast 2025-2030

Chart on UAE - Market size and forecast 2025-2030 ($ million)
Data Table on UAE - Market size and forecast 2025-2030 ($ million)
Chart on UAE - Year-over-year growth 2025-2030 (%)
Data Table on UAE - Year-over-year growth 2025-2030 (%)

13.6.3 South Africa - Market size and forecast 2025-2030

Chart on South Africa - Market size and forecast 2025-2030 ($ million)
Data Table on South Africa - Market size and forecast 2025-2030 ($ million)
Chart on South Africa - Year-over-year growth 2025-2030 (%)
Data Table on South Africa - Year-over-year growth 2025-2030 (%)

13.6.4 Turkey - Market size and forecast 2025-2030

Chart on Turkey - Market size and forecast 2025-2030 ($ million)
Data Table on Turkey - Market size and forecast 2025-2030 ($ million)
Chart on Turkey - Year-over-year growth 2025-2030 (%)
Data Table on Turkey - Year-over-year growth 2025-2030 (%)

13.6.5 Egypt - Market size and forecast 2025-2030

Chart on Egypt - Market size and forecast 2025-2030 ($ million)
Data Table on Egypt - Market size and forecast 2025-2030 ($ million)
Chart on Egypt - Year-over-year growth 2025-2030 (%)
Data Table on Egypt - Year-over-year growth 2025-2030 (%)

13.7 South America - Market size and forecast 2025-2030

Chart on South America - Market size and forecast 2025-2030 ($ million)
Data Table on South America - Market size and forecast 2025-2030 ($ million)
Chart on South America - Year-over-year growth 2025-2030 (%)
Data Table on South America - Year-over-year growth 2025-2030 (%)
Chart on Regional Comparison - South America
Data Table on Regional Comparison - South America

13.7.1 Brazil - Market size and forecast 2025-2030

Chart on Brazil - Market size and forecast 2025-2030 ($ million)
Data Table on Brazil - Market size and forecast 2025-2030 ($ million)
Chart on Brazil - Year-over-year growth 2025-2030 (%)
Data Table on Brazil - Year-over-year growth 2025-2030 (%)

13.7.2 Argentina - Market size and forecast 2025-2030

Chart on Argentina - Market size and forecast 2025-2030 ($ million)
Data Table on Argentina - Market size and forecast 2025-2030 ($ million)
Chart on Argentina - Year-over-year growth 2025-2030 (%)
Data Table on Argentina - Year-over-year growth 2025-2030 (%)

13.7.3 Chile - Market size and forecast 2025-2030

Chart on Chile - Market size and forecast 2025-2030 ($ million)
Data Table on Chile - Market size and forecast 2025-2030 ($ million)
Chart on Chile - Year-over-year growth 2025-2030 (%)
Data Table on Chile - Year-over-year growth 2025-2030 (%)

13.8 Market opportunity by geography

Market opportunity by geography ($ million)
Data Tables on Market opportunity by geography ($ million)

14. Drivers, Challenges, and Opportunity

14.1 Market drivers

Proliferation of e-commerce and shifting retail dynamics
Heightened emphasis on sustainability and circular economy principles
Imperative for operational efficiency and automation

14.2 Market challenges

Integration complexity with legacy systems
High initial investment and perceived return on investment
Skilled workforce shortage and resistance to change

14.3 Impact of drivers and challenges

Impact of drivers and challenges in 2025 and 2030

14.4 Market opportunities

Integration of AI and machine learning
Accelerated shift to cloud-native and SaaS platforms
Software enablement of digital printing and mass customization

15. Competitive Landscape

15.1 Overview

15.2

Overview on criticality of inputs and factors of differentiation

15.3 Landscape disruption

Overview on factors of disruption

15.4 Industry risks

Impact of key risks on business

16. Competitive Analysis

16.1 Companies profiled

Companies covered

16.2 Company ranking index

16.3 Market positioning of companies

Matrix on companies position and classification

16.4 Advantive LLC

Advantive LLC - Overview
Advantive LLC - Product / Service
Advantive LLC - Key offerings
SWOT

16.5 Dexciss Technology Pvt. Ltd.

Dexciss Technology Pvt. Ltd. - Overview
Dexciss Technology Pvt. Ltd. - Product / Service
Dexciss Technology Pvt. Ltd. - Key offerings
SWOT

16.6 Electronics For Imaging Inc.

Electronics For Imaging Inc. - Overview
Electronics For Imaging Inc. - Product / Service
Electronics For Imaging Inc. - Key offerings
SWOT

16.7 Epicor Software Corp.

Epicor Software Corp. - Overview
Epicor Software Corp. - Product / Service
Epicor Software Corp. - Key offerings
SWOT

16.8 EPS Software

EPS Software - Overview
EPS Software - Product / Service
EPS Software - Key offerings
SWOT

16.9 ESS Packaging Logistics

ESS Packaging Logistics - Overview
ESS Packaging Logistics - Product / Service
ESS Packaging Logistics - Key offerings
SWOT

16.10 Microsoft Corp.

Microsoft Corp. - Overview
Microsoft Corp. - Business segments
Microsoft Corp. - Key news
Microsoft Corp. - Key offerings
Microsoft Corp. - Segment focus
SWOT

16.11 Nippon Steel Corp.

Nippon Steel Corp. - Overview
Nippon Steel Corp. - Business segments
Nippon Steel Corp. - Key offerings
Nippon Steel Corp. - Segment focus
SWOT

16.12 Odoo SA

Odoo SA - Overview
Odoo SA - Product / Service
Odoo SA - Key offerings
SWOT

16.13 Oracle Corp.

Oracle Corp. - Overview
Oracle Corp. - Business segments
Oracle Corp. - Key news
Oracle Corp. - Key offerings
Oracle Corp. - Segment focus
SWOT

16.14 PPTS Solutions

PPTS Solutions - Overview
PPTS Solutions - Product / Service
PPTS Solutions - Key offerings
SWOT

16.15 RITC Pvt. Ltd.

RITC Pvt. Ltd. - Overview
RITC Pvt. Ltd. - Product / Service
RITC Pvt. Ltd. - Key offerings
SWOT

16.16 SAP SE

SAP SE - Overview
SAP SE - Business segments
SAP SE - Key news
SAP SE - Key offerings
SAP SE - Segment focus
SWOT

16.17 Shree Balaji Infotech

Shree Balaji Infotech - Overview
Shree Balaji Infotech - Product / Service
Shree Balaji Infotech - Key offerings
SWOT

16.18 SYSPRO Pty. Ltd.

SYSPRO Pty. Ltd. - Overview
SYSPRO Pty. Ltd. - Product / Service
SYSPRO Pty. Ltd. - Key offerings
SWOT

17. Appendix

17.1 Scope of the report

Market definition
Objectives
Notes and caveats

17.2 Inclusions and exclusions checklist

Inclusions checklist
Exclusions checklist

17.3 Currency conversion rates for US$

17.4 Research methodology

17.5 Data procurement

Information sources

17.6 Data validation

17.7 Validation techniques employed for market sizing

17.8 Data synthesis

17.9 360 degree market analysis

17.10 List of abbreviations

Research Methodology

Technavio presents a detailed picture of the market by way of study, synthesis, and summation of data from multiple sources. The analysts have presented the various facets of the market with a particular focus on identifying the key industry influencers. The data thus presented is comprehensive, reliable, and the result of extensive research, both primary and secondary.

INFORMATION SOURCES

Primary sources

  • Manufacturers and suppliers
  • Channel partners
  • Industry experts
  • Strategic decision makers

Secondary sources

  • Industry journals and periodicals
  • Government data
  • Financial reports of key industry players
  • Historical data
  • Press releases

DATA ANALYSIS

Data Synthesis

  • Collation of data
  • Estimation of key figures
  • Analysis of derived insights

Data Validation

  • Triangulation with data models
  • Reference against proprietary databases
  • Corroboration with industry experts

REPORT WRITING

Qualitative

  • Market drivers
  • Market challenges
  • Market trends
  • Five forces analysis

Quantitative

  • Market size and forecast
  • Market segmentation
  • Geographical insights
  • Competitive landscape

Interested in this report?

Get your sample now to see our research methodology and insights!

Download Now

Frequently Asked Questions

Corrugated Packaging Software market growth will increase by USD 19803.5 million during 2026-2030.

The Corrugated Packaging Software market is expected to grow at a CAGR of 18.1% during 2026-2030.

Corrugated Packaging Software market is segmented by Deployment (On-premises, Cloud) Type (Packaged, Standalone) End-user (Food and beverage, Electronics, Healthcare, Personal care, Others) Sector (SMEs, Large enterprises)

Advantive LLC, AICOMP Consulting GmbH, Amtech Software LLC, Arden Software Ltd., Dexciss Technology Pvt. Ltd., Electronics For Imaging Inc., Epicor Software Corp., EPS Software, ESS Packaging Logistics, Microsoft Corp., Nippon Steel Corp., Odoo SA, Oracle Corp., PPTS Solutions, RITC Pvt. Ltd., SAP SE, Shree Balaji Infotech, Sistrade Software Consulting SA, SYSPRO Pty. Ltd., theurer.com GmbH are a few of the key vendors in the Corrugated Packaging Software market.

APAC will register the highest growth rate of 34.1% among the other regions. Therefore, the Corrugated Packaging Software market in APAC is expected to garner significant business opportunities for the vendors during the forecast period.

China, Japan, India, South Korea, Australia, Indonesia, US, Canada, Mexico, Germany, UK, France, Italy, Spain, The Netherlands, Saudi Arabia, UAE, South Africa, Turkey, Egypt, Brazil, Argentina, Chile

  • Proliferation of e-commerce and shifting retail dynamics is the driving factor this market.

The Corrugated Packaging Software market vendors should focus on grabbing business opportunities from the Deployment segment as it accounted for the largest market share in the base year.
RIA - Research AI Assistant
Ask RIA
