Cosmetic Ingredients Market Analysis APAC, North America, Europe, South America, Middle East and Africa - France, Singapore, South Korea, Japan, US - Size and Forecast 2024-2028

Cosmetic Ingredients Market Analysis APAC, North America, Europe, South America, Middle East and Africa - France, Singapore, South Korea, Japan, US - Size and Forecast 2024-2028

Published: Apr 2025 245 Pages SKU: IRTNTR43454

Market Overview at a Glance

$6.57 B
Market Opportunity
8.2%
CAGR
7.4
YoY growth 2024-2025(%)

Cosmetic Ingredients Market Size 2025-2029

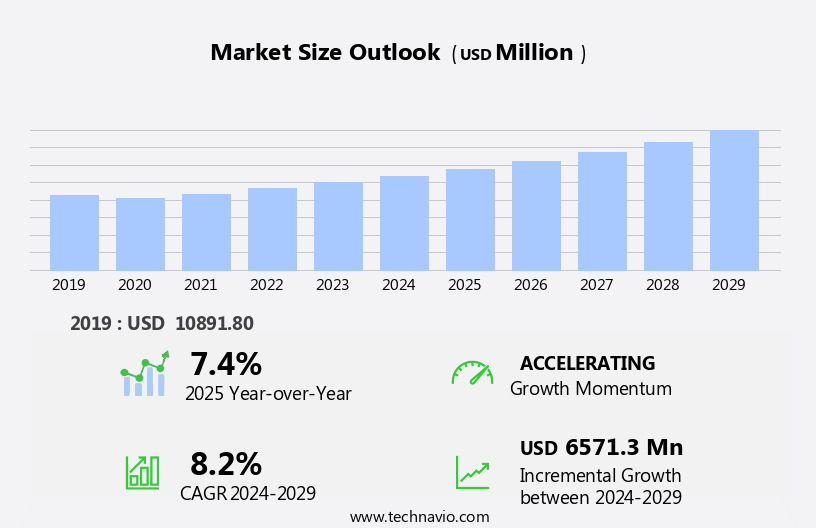
The cosmetic ingredients market size is forecast to increase by USD 6.57 billion at a CAGR of 8.2% between 2024 and 2029.

  • The market is experiencing significant growth, driven by the increasing demand for natural and organic ingredients in cosmetic formulations. Consumers are increasingly seeking products with clean labels, free from synthetic additives, and this trend is expected to continue. However, the market is not without challenges. Stringent regulations governing the use of certain ingredients, particularly in regions like Europe and the United States, pose significant hurdles for manufacturers. Companies must navigate these regulations while also meeting consumer demand for high-quality, natural cosmetic offerings.
  • To capitalize on this market opportunity, businesses must stay informed of regulatory changes and invest in research and development to bring innovative, natural, and compliant products to market. Additionally, strategic partnerships and collaborations can help companies overcome regulatory challenges and expand their reach in The market.

What will be the Size of the Cosmetic Ingredients Market during the forecast period?

Cosmetic Ingredients Market Size

 Request Free Sample

  • The market encompasses a broad range of substances used in the formulation of various personal care products, including body lotions, eyeliners, lipsticks, moisturizers, and more. Key ingredients include water, preservatives, emulsifiers, thickeners, lubricants, pigments, perfumes, and various additives such as antioxidants, anti-inflammatory agents, thickening agents, and moisturizing lipids. Natural sources, including plants, are increasingly popular in the market, with a growing demand for green cosmetics and a shift away from dangerous chemicals. Urbanization and changing consumer preferences drive the market, with an emphasis on natural cosmetic ingredients, skincare products, body care products, oral care products, and various forms of emollient oils and humectant agents.
  • Innovations in the market include the use of antioxidant compounds, UV filters, skin peptides, hydrating polymers, exfoliating acids, pigment stabilizers, and fragrance fixatives. Silicone alternatives and anti-aging actives are also gaining traction. Overall, the market is dynamic and diverse, with a focus on enhancing texture, appearance, and functionality while addressing consumer concerns for safety and sustainability.

How is this Cosmetic Ingredients Industry segmented?

The cosmetic ingredients industry research report provides comprehensive data (region-wise segment analysis), with forecasts and estimates in "USD million" for the period 2025-2029, as well as historical data from 2019-2023 for the following segments.

  • Type
    • Surfactants
    • Emollients film-formers and moisturizers
    • Single-use additives
    • Carriers powders and colorants
    • Others
  • Application
    • Hair care and skin care
    • Perfumes and fragrance
    • Color cosmetics
    • Others
  • Source
    • Synthetic Ingredients
    • Natural ingredients
    • Plant extracts
    • Minerals
  • Geography
    • APAC
      • China
      • India
      • Japan
      • South Korea
    • North America
      • US
      • Canada
    • Europe
      • France
      • Germany
      • Italy
    • South America
      • Brazil
    • Middle East and Africa

    By Type Insights

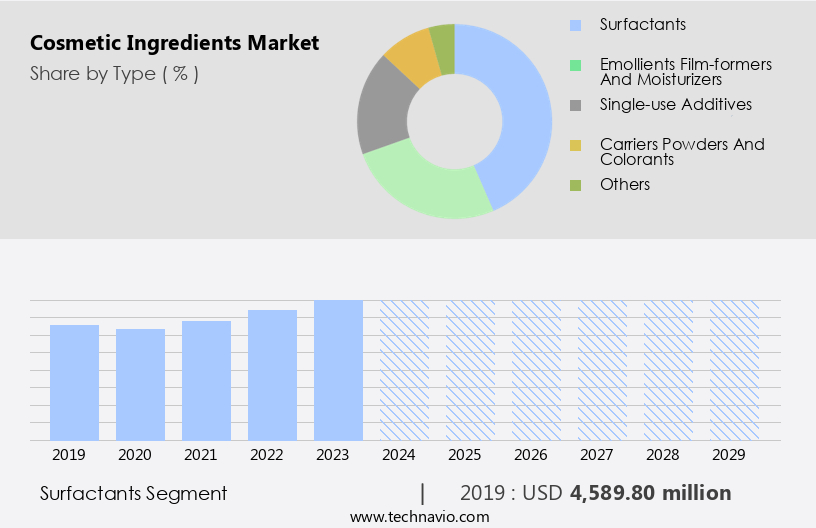
    The surfactants segment is estimated to witness significant growth during the forecast period.

    Surfactants are essential ingredients in cosmetics, reducing surface tension in liquid solutions for applications such as cleansing, solubilization, and conditioning. They consist of hydrophilic and lipophilic components that aid in breaking down oil and fat impurities on the skin. Commonly used surfactants in cosmetics include acyl isethionates, alkyl polyglycosides, sodium laureth sulfate, and ammonium laureth sulfate. However, there is a growing preference for naturally sourced surfactants derived from plants and vegetables, such as decyl glucoside, decyl polyglucoside, and stearyl alcohol, due to increasing health concerns regarding synthetic surfactants. These natural alternatives are found in various cosmetic products, including body lotions, moisturizers, eyeliners, lipsticks, and face washes.

    The demand for green cosmetics and skincare products, free from dangerous chemicals, has led to the development of natural surfactants from renewable sources. Key natural sources include plants and their extracts, which provide antioxidant, anti-inflammatory, thickening, moisturizing, texture, and appearance benefits. These natural ingredients extend the shelf life of cosmetic products while ensuring consumer health and safety.

    Cosmetic Ingredients Market Size

    Get a glance at the market report of share of various segments Request Free Sample

    The Surfactants segment was valued at USD 4.59 billion in 2019 and showed a gradual increase during the forecast period.

    Regional Analysis

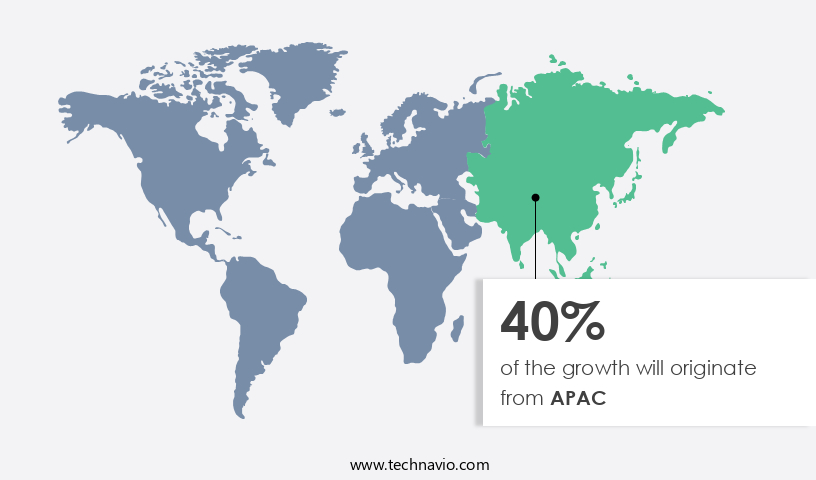
    APAC is estimated to contribute 40% to the growth of the global market during the forecast period.Technavio’s analysts have elaborately explained the regional trends and drivers that shape the market during the forecast period.

    Cosmetic Ingredients Market Share by Geography

    For more insights on the market size of various regions, Request Free Sample

    The cosmetics industry in Asia Pacific has experienced a notable trend towards natural and organic cosmetics. Consumers in the region are growing increasingly conscious of the potential health risks associated with synthetic ingredients, such as preservatives and emulsifiers, commonly used in cosmetics. In response, there is a rising demand for cosmetic products formulated with organic and sustainable ingredients. This shift is driving companies to invest significantly in the development of natural additives and ingredients. The abundance of naturally sourced ingredients, including herbs and plants, in countries like China, India, and Southeast Asia, presents a substantial opportunity for market players to establish production units in the region.

    Key natural ingredients include vitamins, fatty acids, antioxidants, and plant extracts. The market for cosmetics in the Asia Pacific region is expected to grow, driven by the demand for skincare products, body care products, oral care products, and color cosmetics, such as body lotions, eyeliners, lipsticks, moisturizers, and perfumes. Natural sources, including water and natural preservatives, thickeners, lubricants, pigments, and texture enhancers, are gaining popularity due to their potential health benefits and reduced hazardous effects. Green cosmetics, free from dangerous chemicals, are becoming increasingly preferred, particularly in urban areas. Skin problems, such as acne, hair issues, hair loss, split ends, and premature greying, are common concerns driving the demand for cosmetic solutions.

    Natural cosmetic ingredients, including alpha hydroxy acids, beta hydroxy acids, retinol, hydroquinone, copper peptide, and kojic acid, offer effective solutions to these issues. The market for cosmetics in the Asia Pacific region is expected to grow, driven by increasing consumer awareness, rising disposable income, and the availability of innovative and effective natural cosmetic solutions.

    Market Dynamics

    Our researchers analyzed the data with 2024 as the base year, along with the key drivers, trends, and challenges. A holistic analysis of drivers will help companies refine their marketing strategies to gain a competitive advantage.

    What are the key market drivers leading to the rise in the adoption of Cosmetic Ingredients Industry?

    • Growing demand for natural and organic cosmetic ingredients is the key driver of the market. 

    • The cosmetics industry has witnessed a notable shift towards natural and organic ingredients in recent years. Consumers are increasingly conscious of the potential long-term health effects of cosmetics containing synthetic ingredients. As a result, established players in The market, including BASF SE and Croda International Plc, are expanding their portfolios to cater to this demand. Natural ingredients, such as coconut, bakuchiol, pumpkin, blue algae, avocado, argan, olive oil, antioxidants, hyaluronic acid, clay, jojoba, aloe vera, sunflower, and carrot seed extracts, are gaining popularity due to their benefits for skin and hair health.
    • Companies are offering a range of skin care and hair care products featuring these ingredients to meet consumer preferences.

    What are the market trends shaping the Cosmetic Ingredients Industry?

    • Growing prominence of clean labeling in cosmetic formulations is the upcoming market trend. 

    • The cosmetics industry is witnessing a shift towards clean labeling, with a growing preference for minimal synthetic ingredients in cosmetic formulations. This trend prioritizes transparency, safety, and authenticity in the cosmetics sector. companies in The market, including Koninklijke DSM NV and BASF SE, are responding by expanding their offerings of clean-label ingredients. Cosmetic companies are also emphasizing the use of natural ingredients to promote formulation transparency and align with consumer demands.
    • The adoption of organic and sustainable production methods for cosmetic ingredients is on the rise, reflecting this market dynamic.

    What challenges does the Cosmetic Ingredients Industry face during its growth?

    • Stringent regulations is a key challenge affecting the industry growth. 

    • The market is subject to stringent regulations in major economies, including the US, Australia, and EU member states like France and Germany. In the US, the Food and Drug Administration (FDA) governs the cosmetic industry under the Food, Drug and Cosmetic Act (FDCA). This legislation mandates companies and individuals involved in marketing and sales of cosmetics to ensure product and ingredient safety.
    • The FDA oversees cosmetic production, handling, and labeling, with organic cosmetics' labeling standards primarily based on the percentage of organic ingredients.

    Exclusive Customer Landscape

    The cosmetic ingredients market forecasting report includes the adoption lifecycle of the market, covering from the innovator’s stage to the laggard’s stage. It focuses on adoption rates in different regions based on penetration. Furthermore, the cosmetic ingredients market report also includes key purchase criteria and drivers of price sensitivity to help companies evaluate and develop their market growth analysis strategies.

    Cosmetic Ingredients Market Share by Geography

     Customer Landscape

    Key Companies & Market Insights

    Companies are implementing various strategies, such as strategic alliances, cosmetic ingredients market forecast, partnerships, mergers and acquisitions, geographical expansion, and product/service launches, to enhance their presence in the industry.

    Alfa Chemicals Ltd. - The company specializes in providing a diverse range of sports products, ensuring optimal performance and enjoyment for consumers. Our offerings cater to various athletic pursuits, reflecting a commitment to innovation and quality. By adhering to industry best practices and utilizing cutting-edge research, we aim to deliver products that meet the evolving needs of our customers. Our dedication to excellence and customer satisfaction sets us apart in the market.

    The industry research and growth report includes detailed analyses of the competitive landscape of the market and information about key companies, including:

    • Alfa Chemicals Ltd.
    • Ashland Inc.
    • Aston Chemicals Ltd.
    • BASF SE
    • Clariant International Ltd.
    • Croda International Plc
    • DSM-Firmenich AG
    • Eastman Chemical Co.
    • Evonik Industries AG
    • Givaudan SA
    • J M Huber Corp.
    • Lonza Group Ltd.
    • Nouryon Chemicals Holding B.V.
    • Pharmacos India
    • Solvay SA
    • Symrise Group
    • The Dow Chemical Co.
    • The Estee Lauder Co. Inc.
    • Wacker Chemie AG

    Qualitative and quantitative analysis of companies has been conducted to help clients understand the wider business environment as well as the strengths and weaknesses of key industry players. Data is qualitatively analyzed to categorize companies as pure play, category-focused, industry-focused, and diversified; it is quantitatively analyzed to categorize companies as dominant, leading, strong, tentative, and weak.

    Research Analyst Overview

    The market encompasses a vast array of substances used in the production of various personal care products. These ingredients play a crucial role in determining the texture, appearance, and performance of body lotions, moisturizers, and other skincare and body care offerings. Among the key components are water, preservatives, emulsifiers, thickeners, lubricants, pigments, perfumes, and natural sources. Water serves as a fundamental ingredient in cosmetics, contributing to the consistency and spreadability of products. Preservatives are essential for maintaining product integrity and preventing microbial growth. Emulsifiers facilitate the blending of oil and water components, while thickeners enhance the texture and provide a desirable consistency.

    Lubricants contribute to the smooth application and spreadability of cosmetics. Pigments impart color to cosmetics, such as eyeliners and lipsticks. Perfumes add fragrance, while natural sources, including plants, are increasingly popular in the production of green cosmetics. These ingredients offer various benefits, such as antioxidant and anti-inflammatory properties, which contribute to the health and well-being of consumers. The market dynamics of cosmetic ingredients are influenced by several factors. Urbanization and increasing consumer awareness of health concerns have led to a growing demand for natural and organic ingredients. This trend is evident in the popularity of plant extracts, vitamins, fatty acids, and antioxidants.

    The use of certain ingredients, however, has raised concerns regarding their potential hazardous effects. For instance, sodium lauryl sulfate and propylene glycol have been linked to skin irritation and allergic reactions in some individuals. Methyl, a preservative, has been identified as a potential carcinogen. These concerns have led to the development of alternative ingredients, such as natural thickeners, like starch, and emollients derived from renewable sources. The market is diverse and dynamic, with a wide range of products catering to various skin and health concerns. These include face washes, sunscreens, face masks, serums or oils, and oral care products, such as toothpaste and gels.

    Skin problems, such as acne, and hair issues, like hair loss, split ends, and dandruff, are common concerns addressed by cosmetic ingredients. The market for cosmetic ingredients is continually evolving, with ongoing research and development aimed at addressing new health concerns and consumer preferences. Innovations in the field include the use of alpha hydroxy acids, beta hydroxy acids, retinol, hydroquinone, copper peptide, and kojic acid. These ingredients offer various benefits, such as exfoliating, anti-aging, and skin brightening properties. In , the market is a dynamic and diverse sector, driven by consumer preferences and health concerns.

    The use of natural and organic ingredients, as well as ongoing research and development, are key trends shaping the market. The production and application of cosmetic ingredients play a crucial role in the development of various personal care products, including body lotions, moisturizers, and other skincare and body care offerings.

    Market Scope

    Report Coverage

    Details

    Page number

    245

    Base year

    2024

    Historic period

    2019-2023

    Forecast period

    2025-2029

    Growth momentum & CAGR

    Accelerate at a CAGR of 8.2%

    Market growth 2025-2029

    USD 6571.3 million

    Market structure

    Fragmented

    YoY growth 2024-2025(%)

    7.4

    Key countries

    US, China, Japan, Germany, South Korea, France, India, Canada, Brazil, and Italy

    Competitive landscape

    Leading Companies, Market Positioning of Companies, Competitive Strategies, and Industry Risks

    Request Free Sample

    What are the Key Data Covered in this Cosmetic Ingredients Market Research and Growth Report?

    • CAGR of the Cosmetic Ingredients industry during the forecast period
    • Detailed information on factors that will drive the growth and forecasting between 2025 and 2029
    • Precise estimation of the size of the market and its contribution of the industry in focus to the parent market
    • Accurate predictions about upcoming growth and trends and changes in consumer behaviour
    • Growth of the market across APAC, North America, Europe, South America, and Middle East and Africa
    • Thorough analysis of the market’s competitive landscape and detailed information about companies
    • Comprehensive analysis of factors that will challenge the cosmetic ingredients market growth of industry companies

    We can help! Our analysts can customize this cosmetic ingredients market research report to meet your requirements.

    Get in touch


    1 Executive Summary

    • 1.1 Market overview
      • Executive Summary - Chart on Market Overview
      • Executive Summary - Data Table on Market Overview
      • Executive Summary - Chart on Global Market Characteristics
      • Executive Summary - Chart on Market by Geography
      • Executive Summary - Chart on Market Segmentation by Type
      • Executive Summary - Chart on Market Segmentation by Application
      • Executive Summary - Chart on Market Segmentation by Source
      • Executive Summary - Chart on Incremental Growth
      • Executive Summary - Data Table on Incremental Growth
      • Executive Summary - Chart on Company Market Positioning

    2 Technavio Analysis

    • 2.1 Analysis of price sensitivity, lifecycle, customer purchase basket, adoption rates, and purchase criteria
      • Analysis of price sensitivity, lifecycle, customer purchase basket, adoption rates, and purchase criteria
    • 2.2 Criticality of inputs and Factors of differentiation
      • Overview on criticality of inputs and factors of differentiation
    • 2.3 Factors of disruption
      • Overview on factors of disruption
    • 2.4 Impact of drivers and challenges
      • Impact of drivers and challenges in 2024 and 2029

    3 Market Landscape

    • 3.1 Market ecosystem
      • Parent Market
      • Data Table on - Parent Market
    • 3.2 Market characteristics
      • Market characteristics analysis
    • 3.3 Value chain analysis
      • Value chain analysis

    4 Market Sizing

    • 4.1 Market definition
      • Offerings of companies included in the market definition
    • 4.2 Market segment analysis
      • Market segments
    • 4.3 Market size 2024
      • 4.4 Market outlook: Forecast for 2024-2029
        • Chart on Global - Market size and forecast 2024-2029 ($ million)
        • Data Table on Global - Market size and forecast 2024-2029 ($ million)
        • Chart on Global Market: Year-over-year growth 2024-2029 (%)
        • Data Table on Global Market: Year-over-year growth 2024-2029 (%)

      5 Historic Market Size

      • 5.1 Global Cosmetic Ingredients Market 2019 - 2023
        • Historic Market Size - Data Table on Global Cosmetic Ingredients Market 2019 - 2023 ($ million)
      • 5.2 Type segment analysis 2019 - 2023
        • Historic Market Size - Type Segment 2019 - 2023 ($ million)
      • 5.3 Application segment analysis 2019 - 2023
        • Historic Market Size - Application Segment 2019 - 2023 ($ million)
      • 5.4 Source segment analysis 2019 - 2023
        • Historic Market Size - Source Segment 2019 - 2023 ($ million)
      • 5.5 Geography segment analysis 2019 - 2023
        • Historic Market Size - Geography Segment 2019 - 2023 ($ million)
      • 5.6 Country segment analysis 2019 - 2023
        • Historic Market Size - Country Segment 2019 - 2023 ($ million)

      6 Qualitative Analysis

      • 6.1 The AI impact on the global cosmetic ingredients market

        7 Five Forces Analysis

        • 7.1 Five forces summary
          • Five forces analysis - Comparison between 2024 and 2029
        • 7.2 Bargaining power of buyers
          • Bargaining power of buyers - Impact of key factors 2024 and 2029
        • 7.3 Bargaining power of suppliers
          • Bargaining power of suppliers - Impact of key factors in 2024 and 2029
        • 7.4 Threat of new entrants
          • Threat of new entrants - Impact of key factors in 2024 and 2029
        • 7.5 Threat of substitutes
          • Threat of substitutes - Impact of key factors in 2024 and 2029
        • 7.6 Threat of rivalry
          • Threat of rivalry - Impact of key factors in 2024 and 2029
        • 7.7 Market condition
          • Chart on Market condition - Five forces 2024 and 2029

        8 Market Segmentation by Type

        • 8.1 Market segments
          • Chart on Type - Market share 2024-2029 (%)
          • Data Table on Type - Market share 2024-2029 (%)
        • 8.2 Comparison by Type
          • Chart on Comparison by Type
          • Data Table on Comparison by Type
        • 8.3 Surfactants - Market size and forecast 2024-2029
          • Chart on Surfactants - Market size and forecast 2024-2029 ($ million)
          • Data Table on Surfactants - Market size and forecast 2024-2029 ($ million)
          • Chart on Surfactants - Year-over-year growth 2024-2029 (%)
          • Data Table on Surfactants - Year-over-year growth 2024-2029 (%)
        • 8.4 Emollients film-formers and moisturizers - Market size and forecast 2024-2029
          • Chart on Emollients film-formers and moisturizers - Market size and forecast 2024-2029 ($ million)
          • Data Table on Emollients film-formers and moisturizers - Market size and forecast 2024-2029 ($ million)
          • Chart on Emollients film-formers and moisturizers - Year-over-year growth 2024-2029 (%)
          • Data Table on Emollients film-formers and moisturizers - Year-over-year growth 2024-2029 (%)
        • 8.5 Single-use additives - Market size and forecast 2024-2029
          • Chart on Single-use additives - Market size and forecast 2024-2029 ($ million)
          • Data Table on Single-use additives - Market size and forecast 2024-2029 ($ million)
          • Chart on Single-use additives - Year-over-year growth 2024-2029 (%)
          • Data Table on Single-use additives - Year-over-year growth 2024-2029 (%)
        • 8.6 Carriers powders and colorants - Market size and forecast 2024-2029
          • Chart on Carriers powders and colorants - Market size and forecast 2024-2029 ($ million)
          • Data Table on Carriers powders and colorants - Market size and forecast 2024-2029 ($ million)
          • Chart on Carriers powders and colorants - Year-over-year growth 2024-2029 (%)
          • Data Table on Carriers powders and colorants - Year-over-year growth 2024-2029 (%)
        • 8.7 Others - Market size and forecast 2024-2029
          • Chart on Others - Market size and forecast 2024-2029 ($ million)
          • Data Table on Others - Market size and forecast 2024-2029 ($ million)
          • Chart on Others - Year-over-year growth 2024-2029 (%)
          • Data Table on Others - Year-over-year growth 2024-2029 (%)
        • 8.8 Market opportunity by Type
          • Market opportunity by Type ($ million)
          • Data Table on Market opportunity by Type ($ million)

        9 Market Segmentation by Application

        • 9.1 Market segments
          • Chart on Application - Market share 2024-2029 (%)
          • Data Table on Application - Market share 2024-2029 (%)
        • 9.2 Comparison by Application
          • Chart on Comparison by Application
          • Data Table on Comparison by Application
        • 9.3 Hair care and skin care - Market size and forecast 2024-2029
          • Chart on Hair care and skin care - Market size and forecast 2024-2029 ($ million)
          • Data Table on Hair care and skin care - Market size and forecast 2024-2029 ($ million)
          • Chart on Hair care and skin care - Year-over-year growth 2024-2029 (%)
          • Data Table on Hair care and skin care - Year-over-year growth 2024-2029 (%)
        • 9.4 Perfumes and fragrance - Market size and forecast 2024-2029
          • Chart on Perfumes and fragrance - Market size and forecast 2024-2029 ($ million)
          • Data Table on Perfumes and fragrance - Market size and forecast 2024-2029 ($ million)
          • Chart on Perfumes and fragrance - Year-over-year growth 2024-2029 (%)
          • Data Table on Perfumes and fragrance - Year-over-year growth 2024-2029 (%)
        • 9.5 Color cosmetics - Market size and forecast 2024-2029
          • Chart on Color cosmetics - Market size and forecast 2024-2029 ($ million)
          • Data Table on Color cosmetics - Market size and forecast 2024-2029 ($ million)
          • Chart on Color cosmetics - Year-over-year growth 2024-2029 (%)
          • Data Table on Color cosmetics - Year-over-year growth 2024-2029 (%)
        • 9.6 Others - Market size and forecast 2024-2029
          • Chart on Others - Market size and forecast 2024-2029 ($ million)
          • Data Table on Others - Market size and forecast 2024-2029 ($ million)
          • Chart on Others - Year-over-year growth 2024-2029 (%)
          • Data Table on Others - Year-over-year growth 2024-2029 (%)
        • 9.7 Market opportunity by Application
          • Market opportunity by Application ($ million)
          • Data Table on Market opportunity by Application ($ million)

        10 Market Segmentation by Source

        • 10.1 Market segments
          • Chart on Source - Market share 2024-2029 (%)
          • Data Table on Source - Market share 2024-2029 (%)
        • 10.2 Comparison by Source
          • Chart on Comparison by Source
          • Data Table on Comparison by Source
        • 10.3 Synthetic Ingredients - Market size and forecast 2024-2029
          • Chart on Synthetic Ingredients - Market size and forecast 2024-2029 ($ million)
          • Data Table on Synthetic Ingredients - Market size and forecast 2024-2029 ($ million)
          • Chart on Synthetic Ingredients - Year-over-year growth 2024-2029 (%)
          • Data Table on Synthetic Ingredients - Year-over-year growth 2024-2029 (%)
        • 10.4 Natural ingredients - Market size and forecast 2024-2029
          • Chart on Natural ingredients - Market size and forecast 2024-2029 ($ million)
          • Data Table on Natural ingredients - Market size and forecast 2024-2029 ($ million)
          • Chart on Natural ingredients - Year-over-year growth 2024-2029 (%)
          • Data Table on Natural ingredients - Year-over-year growth 2024-2029 (%)
        • 10.5 Plant extracts - Market size and forecast 2024-2029
          • Chart on Plant extracts - Market size and forecast 2024-2029 ($ million)
          • Data Table on Plant extracts - Market size and forecast 2024-2029 ($ million)
          • Chart on Plant extracts - Year-over-year growth 2024-2029 (%)
          • Data Table on Plant extracts - Year-over-year growth 2024-2029 (%)
        • 10.6 Minerals - Market size and forecast 2024-2029
          • Chart on Minerals - Market size and forecast 2024-2029 ($ million)
          • Data Table on Minerals - Market size and forecast 2024-2029 ($ million)
          • Chart on Minerals - Year-over-year growth 2024-2029 (%)
          • Data Table on Minerals - Year-over-year growth 2024-2029 (%)
        • 10.7 Market opportunity by Source
          • Market opportunity by Source ($ million)
          • Data Table on Market opportunity by Source ($ million)

        11 Customer Landscape

        • 11.1 Customer landscape overview
          • Analysis of price sensitivity, lifecycle, customer purchase basket, adoption rates, and purchase criteria

        12 Geographic Landscape

        • 12.1 Geographic segmentation
          • Chart on Market share by geography 2024-2029 (%)
          • Data Table on Market share by geography 2024-2029 (%)
        • 12.2 Geographic comparison
          • Chart on Geographic comparison
          • Data Table on Geographic comparison
        • 12.3 APAC - Market size and forecast 2024-2029
          • Chart on APAC - Market size and forecast 2024-2029 ($ million)
          • Data Table on APAC - Market size and forecast 2024-2029 ($ million)
          • Chart on APAC - Year-over-year growth 2024-2029 (%)
          • Data Table on APAC - Year-over-year growth 2024-2029 (%)
        • 12.4 North America - Market size and forecast 2024-2029
          • Chart on North America - Market size and forecast 2024-2029 ($ million)
          • Data Table on North America - Market size and forecast 2024-2029 ($ million)
          • Chart on North America - Year-over-year growth 2024-2029 (%)
          • Data Table on North America - Year-over-year growth 2024-2029 (%)
        • 12.5 Europe - Market size and forecast 2024-2029
          • Chart on Europe - Market size and forecast 2024-2029 ($ million)
          • Data Table on Europe - Market size and forecast 2024-2029 ($ million)
          • Chart on Europe - Year-over-year growth 2024-2029 (%)
          • Data Table on Europe - Year-over-year growth 2024-2029 (%)
        • 12.6 South America - Market size and forecast 2024-2029
          • Chart on South America - Market size and forecast 2024-2029 ($ million)
          • Data Table on South America - Market size and forecast 2024-2029 ($ million)
          • Chart on South America - Year-over-year growth 2024-2029 (%)
          • Data Table on South America - Year-over-year growth 2024-2029 (%)
        • 12.7 Middle East and Africa - Market size and forecast 2024-2029
          • Chart on Middle East and Africa - Market size and forecast 2024-2029 ($ million)
          • Data Table on Middle East and Africa - Market size and forecast 2024-2029 ($ million)
          • Chart on Middle East and Africa - Year-over-year growth 2024-2029 (%)
          • Data Table on Middle East and Africa - Year-over-year growth 2024-2029 (%)
        • 12.8 US - Market size and forecast 2024-2029
          • Chart on US - Market size and forecast 2024-2029 ($ million)
          • Data Table on US - Market size and forecast 2024-2029 ($ million)
          • Chart on US - Year-over-year growth 2024-2029 (%)
          • Data Table on US - Year-over-year growth 2024-2029 (%)
        • 12.9 China - Market size and forecast 2024-2029
          • Chart on China - Market size and forecast 2024-2029 ($ million)
          • Data Table on China - Market size and forecast 2024-2029 ($ million)
          • Chart on China - Year-over-year growth 2024-2029 (%)
          • Data Table on China - Year-over-year growth 2024-2029 (%)
        • 12.10 Japan - Market size and forecast 2024-2029
          • Chart on Japan - Market size and forecast 2024-2029 ($ million)
          • Data Table on Japan - Market size and forecast 2024-2029 ($ million)
          • Chart on Japan - Year-over-year growth 2024-2029 (%)
          • Data Table on Japan - Year-over-year growth 2024-2029 (%)
        • 12.11 Germany - Market size and forecast 2024-2029
          • Chart on Germany - Market size and forecast 2024-2029 ($ million)
          • Data Table on Germany - Market size and forecast 2024-2029 ($ million)
          • Chart on Germany - Year-over-year growth 2024-2029 (%)
          • Data Table on Germany - Year-over-year growth 2024-2029 (%)
        • 12.12 South Korea - Market size and forecast 2024-2029
          • Chart on South Korea - Market size and forecast 2024-2029 ($ million)
          • Data Table on South Korea - Market size and forecast 2024-2029 ($ million)
          • Chart on South Korea - Year-over-year growth 2024-2029 (%)
          • Data Table on South Korea - Year-over-year growth 2024-2029 (%)
        • 12.13 India - Market size and forecast 2024-2029
          • Chart on India - Market size and forecast 2024-2029 ($ million)
          • Data Table on India - Market size and forecast 2024-2029 ($ million)
          • Chart on India - Year-over-year growth 2024-2029 (%)
          • Data Table on India - Year-over-year growth 2024-2029 (%)
        • 12.14 France - Market size and forecast 2024-2029
          • Chart on France - Market size and forecast 2024-2029 ($ million)
          • Data Table on France - Market size and forecast 2024-2029 ($ million)
          • Chart on France - Year-over-year growth 2024-2029 (%)
          • Data Table on France - Year-over-year growth 2024-2029 (%)
        • 12.15 Canada - Market size and forecast 2024-2029
          • Chart on Canada - Market size and forecast 2024-2029 ($ million)
          • Data Table on Canada - Market size and forecast 2024-2029 ($ million)
          • Chart on Canada - Year-over-year growth 2024-2029 (%)
          • Data Table on Canada - Year-over-year growth 2024-2029 (%)
        • 12.16 Brazil - Market size and forecast 2024-2029
          • Chart on Brazil - Market size and forecast 2024-2029 ($ million)
          • Data Table on Brazil - Market size and forecast 2024-2029 ($ million)
          • Chart on Brazil - Year-over-year growth 2024-2029 (%)
          • Data Table on Brazil - Year-over-year growth 2024-2029 (%)
        • 12.17 Italy - Market size and forecast 2024-2029
          • Chart on Italy - Market size and forecast 2024-2029 ($ million)
          • Data Table on Italy - Market size and forecast 2024-2029 ($ million)
          • Chart on Italy - Year-over-year growth 2024-2029 (%)
          • Data Table on Italy - Year-over-year growth 2024-2029 (%)
        • 12.18 Market opportunity by geography
          • Market opportunity by geography ($ million)
          • Data Tables on Market opportunity by geography ($ million)

        13 Drivers, Challenges, and Opportunity/Restraints

        • 13.1 Market drivers
          • 13.2 Market challenges
            • 13.3 Impact of drivers and challenges
              • Impact of drivers and challenges in 2024 and 2029
            • 13.4 Market opportunities/restraints

              14 Competitive Landscape

              • 14.1 Overview
                • 14.2 Competitive Landscape
                  • Overview on criticality of inputs and factors of differentiation
                • 14.3 Landscape disruption
                  • Overview on factors of disruption
                • 14.4 Industry risks
                  • Impact of key risks on business

                15 Competitive Analysis

                • 15.1 Companies profiled
                  • Companies covered
                • 15.2 Company ranking index
                  • Company ranking index
                • 15.3 Market positioning of companies
                  • Matrix on companies position and classification
                • 15.4 Ashland Inc.
                  • Ashland Inc. - Overview
                  • Ashland Inc. - Business segments
                  • Ashland Inc. - Key news
                  • Ashland Inc. - Key offerings
                  • Ashland Inc. - Segment focus
                  • SWOT
                • 15.5 BASF SE
                  • BASF SE - Overview
                  • BASF SE - Business segments
                  • BASF SE - Key news
                  • BASF SE - Key offerings
                  • BASF SE - Segment focus
                  • SWOT
                • 15.6 Clariant International Ltd.
                  • Clariant International Ltd. - Overview
                  • Clariant International Ltd. - Business segments
                  • Clariant International Ltd. - Key news
                  • Clariant International Ltd. - Key offerings
                  • Clariant International Ltd. - Segment focus
                  • SWOT
                • 15.7 Croda International Plc
                  • Croda International Plc - Overview
                  • Croda International Plc - Business segments
                  • Croda International Plc - Key offerings
                  • Croda International Plc - Segment focus
                  • SWOT
                • 15.8 DSM-Firmenich AG
                  • DSM-Firmenich AG - Overview
                  • DSM-Firmenich AG - Business segments
                  • DSM-Firmenich AG - Key news
                  • DSM-Firmenich AG - Key offerings
                  • DSM-Firmenich AG - Segment focus
                  • SWOT
                • 15.9 Eastman Chemical Co.
                  • Eastman Chemical Co. - Overview
                  • Eastman Chemical Co. - Business segments
                  • Eastman Chemical Co. - Key news
                  • Eastman Chemical Co. - Key offerings
                  • Eastman Chemical Co. - Segment focus
                  • SWOT
                • 15.10 Evonik Industries AG
                  • Evonik Industries AG - Overview
                  • Evonik Industries AG - Business segments
                  • Evonik Industries AG - Key news
                  • Evonik Industries AG - Key offerings
                  • Evonik Industries AG - Segment focus
                  • SWOT
                • 15.11 Givaudan SA
                  • Givaudan SA - Overview
                  • Givaudan SA - Business segments
                  • Givaudan SA - Key news
                  • Givaudan SA - Key offerings
                  • Givaudan SA - Segment focus
                  • SWOT
                • 15.12 J M Huber Corp.
                  • J M Huber Corp. - Overview
                  • J M Huber Corp. - Product / Service
                  • J M Huber Corp. - Key news
                  • J M Huber Corp. - Key offerings
                  • SWOT
                • 15.13 Lonza Group Ltd.
                  • Lonza Group Ltd. - Overview
                  • Lonza Group Ltd. - Business segments
                  • Lonza Group Ltd. - Key news
                  • Lonza Group Ltd. - Key offerings
                  • Lonza Group Ltd. - Segment focus
                  • SWOT
                • 15.14 Nouryon Chemicals Holding B.V.
                  • Nouryon Chemicals Holding B.V. - Overview
                  • Nouryon Chemicals Holding B.V. - Product / Service
                  • Nouryon Chemicals Holding B.V. - Key offerings
                  • SWOT
                • 15.15 Solvay SA
                  • Solvay SA - Overview
                  • Solvay SA - Business segments
                  • Solvay SA - Key news
                  • Solvay SA - Key offerings
                  • Solvay SA - Segment focus
                  • SWOT
                • 15.16 Symrise Group
                  • Symrise Group - Overview
                  • Symrise Group - Business segments
                  • Symrise Group - Key news
                  • Symrise Group - Key offerings
                  • Symrise Group - Segment focus
                  • SWOT
                • 15.17 The Dow Chemical Co.
                  • The Dow Chemical Co. - Overview
                  • The Dow Chemical Co. - Business segments
                  • The Dow Chemical Co. - Key news
                  • The Dow Chemical Co. - Key offerings
                  • The Dow Chemical Co. - Segment focus
                  • SWOT
                • 15.18 Wacker Chemie AG
                  • Wacker Chemie AG - Overview
                  • Wacker Chemie AG - Business segments
                  • Wacker Chemie AG - Key news
                  • Wacker Chemie AG - Key offerings
                  • Wacker Chemie AG - Segment focus
                  • SWOT

                16 Appendix

                • 16.1 Scope of the report
                  • 16.2 Inclusions and exclusions checklist
                    • Inclusions checklist
                    • Exclusions checklist
                  • 16.3 Currency conversion rates for US$
                    • Currency conversion rates for US$
                  • 16.4 Research methodology
                    • Research methodology
                  • 16.5 Data procurement
                    • Information sources
                  • 16.6 Data validation
                    • Data validation
                  • 16.7 Validation techniques employed for market sizing
                    • Validation techniques employed for market sizing
                  • 16.8 Data synthesis
                    • Data synthesis
                  • 16.9 360 degree market analysis
                    • 360 degree market analysis
                  • 16.10 List of abbreviations
                    • List of abbreviations

                  Research Methodology

                  Technavio presents a detailed picture of the market by way of study, synthesis, and summation of data from multiple sources. The analysts have presented the various facets of the market with a particular focus on identifying the key industry influencers. The data thus presented is comprehensive, reliable, and the result of extensive research, both primary and secondary.

                  INFORMATION SOURCES

                  Primary sources

                  • Manufacturers and suppliers
                  • Channel partners
                  • Industry experts
                  • Strategic decision makers

                  Secondary sources

                  • Industry journals and periodicals
                  • Government data
                  • Financial reports of key industry players
                  • Historical data
                  • Press releases

                  DATA ANALYSIS

                  Data Synthesis

                  • Collation of data
                  • Estimation of key figures
                  • Analysis of derived insights

                  Data Validation

                  • Triangulation with data models
                  • Reference against proprietary databases
                  • Corroboration with industry experts

                  REPORT WRITING

                  Qualitative

                  • Market drivers
                  • Market challenges
                  • Market trends
                  • Five forces analysis

                  Quantitative

                  • Market size and forecast
                  • Market segmentation
                  • Geographical insights
                  • Competitive landscape

                  Interested in this report?

                  Get your sample now to see our research methodology and insights!

                  Download Now

                  Frequently Asked Questions

                  Cosmetic Ingredients market growth will increase by 6571.3 million during 2025-2029 .

                  The Cosmetic Ingredients market is expected to grow at a CAGR of 8.2% during 2025-2029 .

                  Cosmetic Ingredients market is segmented by Type( Surfactants, Emollients film-formers and moisturizers, Single-use additives, Carriers powders and colorants, Others) Application( Hair care and skin care, Perfumes and fragrance, Color cosmetics, Others, South America) Source( Synthetic Ingredients, Natural ingredients, Plant extracts, Minerals, Middle East and Africa)

                  Alfa Chemicals Ltd., Ashland Inc., Aston Chemicals Ltd., BASF SE, Clariant International Ltd., Croda International Plc, DSM-Firmenich AG, Eastman Chemical Co., Evonik Industries AG, Givaudan SA, J M Huber Corp., Lonza Group Ltd., Nouryon Chemicals Holding B.V., Pharmacos India, Solvay SA, Symrise Group, The Dow Chemical Co., The Estee Lauder Co. Inc., Wacker Chemie AG are a few of the key vendors in the Cosmetic Ingredients market.

                  APAC will register the highest growth rate of 40.1% among the other regions. Therefore, the Cosmetic Ingredients market in APAC is expected to garner significant business opportunities for the vendors during the forecast period.

                  US, China, Japan, Germany, South Korea, France, India, Canada, Brazil, Italy

                  • Growing demand for natural and organic cosmetic ingredientsSince the last few years is the driving factor this market.
                  • there has been a significant rise in the demand for natural and organic cosmetics that contain little to no chemicals. Although skin care and hair care cosmetics manufactured using synthetic ingredients are highly effective over the short term is the driving factor this market.
                  • their prolonged use is known to have detrimental effects on skin and hair health. Established companies in the global cosmetic ingredients market is the driving factor this market.
                  • such as BASF SE and Croda International Plc is the driving factor this market.
                  • are placing high emphasis on expanding their portfolio of natural ingredients. For instance is the driving factor this market.
                  • For instance is the driving factor this market.
                  • in January 2024 is the driving factor this market.
                  • BASF introduced Epispot is the driving factor this market.
                  • a natural active ingredient derived from Epilobium angustifolium (rosebay willowherb) is the driving factor this market.
                  • aimed at reducing skin shine and improving the appearance of facial pores is the driving factor this market.
                  • aligning with the NoFilter trend for authentic beauty. Owing to the rising awareness about the benefits of natural cosmetic ingredients is the driving factor this market.
                  • several cosmetics companies have started offering a range of skin care and hair care products that contain natural and organic ingredients such as coconut is the driving factor this market.
                  • bakuchiol is the driving factor this market.
                  • pumpkin is the driving factor this market.
                  • blue algae is the driving factor this market.
                  • avocado is the driving factor this market.
                  • argan is the driving factor this market.
                  • and olive oil; antioxidants; hyaluronic acid; clay; and jojoba is the driving factor this market.
                  • aloe vera is the driving factor this market.
                  • sunflower is the driving factor this market.
                  • and carrot seed extracts. These natural products are manufactured from ethically and sustainably sourced ingredients and target the growing demand for organic and natural cosmetics. Beiersdorf Global AG offers a range of cosmetics under the brand NIVEA is the driving factor this market.
                  • which are free from synthetic ingredients such as parabens is the driving factor this market.
                  • silicones is the driving factor this market.
                  • colorants is the driving factor this market.
                  • and mineral oil and have 95% natural origin products. Overall is the driving factor this market.
                  • the shift toward natural and organic cosmetics is expected to boost the market during the forecast period. is the driving factor this market.

                  The Cosmetic Ingredients market vendors should focus on grabbing business opportunities from the Surfactants segment as it accounted for the largest market share in the base year.