Cosmetic Skin Care Market Analysis, Size, and Forecast 2025-2029: North America (US and Canada), Europe (France, Germany, Italy, and UK), Middle East and Africa (Egypt, KSA, Oman, and UAE), APAC (China, India, and Japan), South America (Argentina and Brazil), and Rest of World (ROW)

Cosmetic Skin Care Market Analysis, Size, and Forecast 2025-2029:
North America (US and Canada), Europe (France, Germany, Italy, and UK), Middle East and Africa (Egypt, KSA, Oman, and UAE), APAC (China, India, and Japan), South America (Argentina and Brazil), and Rest of World (ROW)

Published: Jan 2025 202 Pages SKU: IRTNTR41578

Market Overview at a Glance

$101.9 B
Market Opportunity
9.5%
CAGR
8.5
YoY growth 2024-2025(%)

Cosmetic Skin Care Market Size 2025-2029

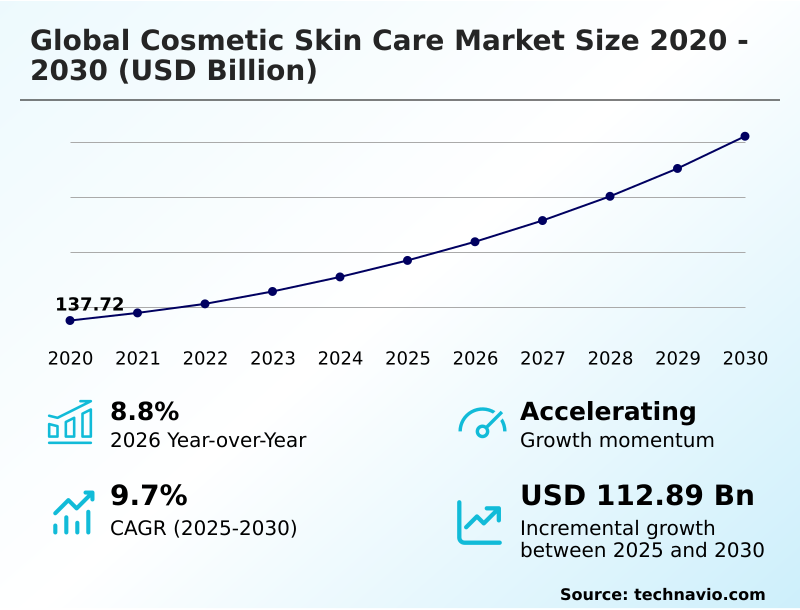
The cosmetic skin care market size is valued to increase by USD 101.9 billion, at a CAGR of 9.5% from 2024 to 2029. Growing population in age group of 30-50 years will drive the cosmetic skin care market.

Major Market Trends & Insights

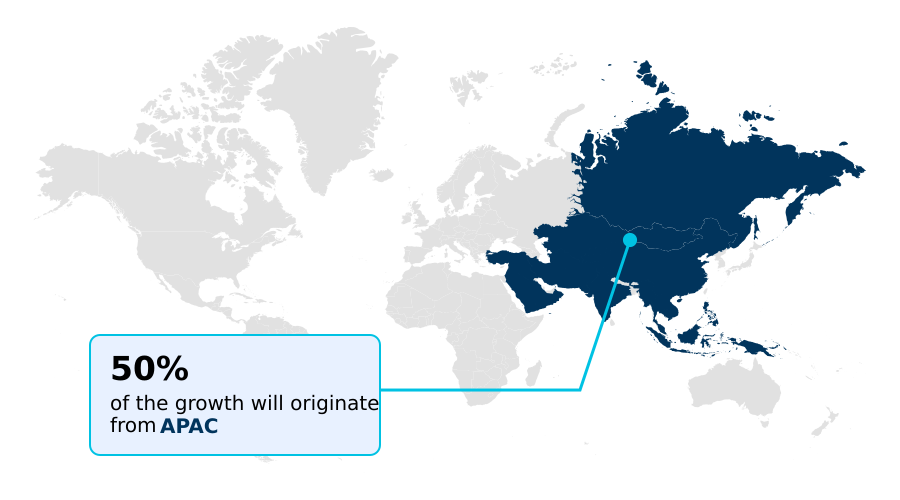
  • APAC dominated the market and accounted for a 52% growth during the forecast period.
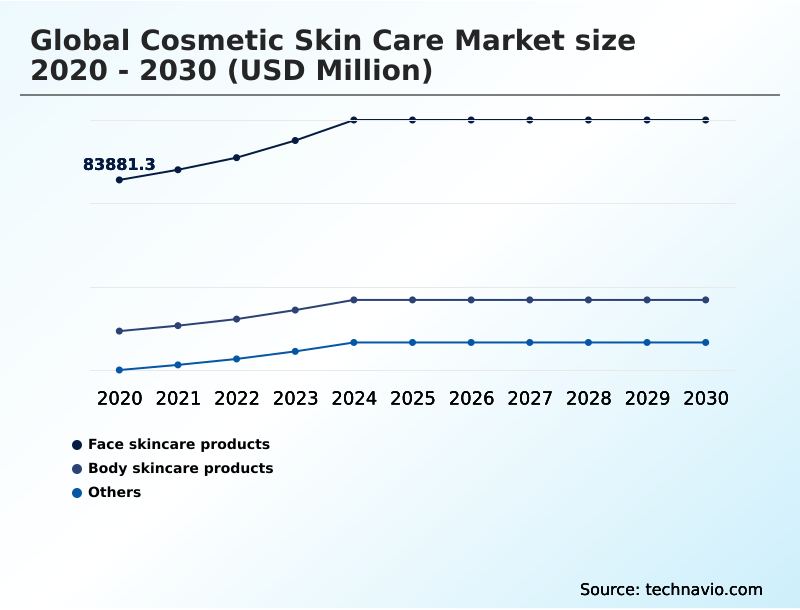
  • By Product - Face skincare products segment was valued at USD 88.00 billion in 2023
  • By Distribution Channel - Offline segment accounted for the largest market revenue share in 2023

Market Size & Forecast

  • Market Opportunities: USD 95.24 billion
  • Market Future Opportunities: USD 101.90 billion
  • CAGR : 9.5%
  • APAC: Largest market in 2023

Market Summary

  • The market encompasses a broad spectrum of products and services designed to enhance and protect the skin. This dynamic market is driven by several key factors, including the growing population in the age group of 30-50 years, who prioritize skin care for anti-aging and radiance. Another significant trend is the increasing preference for organic cosmetics and cosmeceuticals, as consumers become more health-conscious. However, the high cost of cosmetic skin care products poses a challenge for some consumers.
  • Core technologies, such as nanotechnology and peptides, continue to evolve, offering innovative solutions for various skin concerns. In the United States, for instance, the organic cosmetics market share is projected to reach 15% by 2025, reflecting the market's continuous growth and transformation. Consumers are increasingly seeking out natural and chemical-free alternatives to traditional cosmetic products, presenting an opportunity for companies to cater to this demand.

What will be the Size of the Cosmetic Skin Care Market during the forecast period?

Cosmetic Skin Care Market Size

Get Key Insights on Market Forecast (PDF) Request Free Sample

How is the Cosmetic Skin Care Market Segmented and what are the key trends of market segmentation?

The cosmetic skin care industry research report provides comprehensive data (region-wise segment analysis), with forecasts and estimates in "USD billion" for the period 2025-2029, as well as historical data from 2019-2023 for the following segments.

  • Product
    • Face skincare products
    • Body skincare products
    • Others
  • Distribution Channel
    • Offline
    • Online
  • End User
    • Women
    • Men
  • Price Point
    • Mass
    • Premium
  • Geography
    • North America
      • US
      • Canada
    • Europe
      • France
      • Germany
      • Italy
      • UK
    • Middle East and Africa
      • Egypt
      • KSA
      • Oman
      • UAE
    • APAC
      • China
      • India
      • Japan
    • South America
      • Argentina
      • Brazil
    • Rest of World (ROW)

By Product Insights

The face skincare products segment is estimated to witness significant growth during the forecast period.

The market encompasses a wide array of products and technologies, with exfoliating agents, transdermal drug delivery, and liposomal encapsulation playing significant roles. Hyaluronic acid serums, regulatory compliance, and dermal filler injections are integral components of the market, undergoing rigorous dermatological testing for photoaging prevention and wrinkle reduction assessment. Melanin production inhibition through clinical trial results is a key trend, with skin brightening ingredients and cosmeceutical formulations gaining popularity. Skin aging biomarkers, collagen synthesis, and acne treatment efficacy are crucial areas of focus for market participants. Ingredient formulation, retinol efficacy, and skin hydration levels are essential factors driving consumer preferences.

Ceramide replenishment, safety profile assessment, microdermabrasion treatments, and laser skin resurfacing are among the advanced techniques employed to enhance product efficacy. Peptide delivery systems, anti-inflammatory compounds, skin microbiome analysis, sebum regulation, and product efficacy testing are other emerging trends. The market for skin care products is vast, with face skincare products holding a substantial market share. In 2024, face skincare products accounted for approximately 60% of the market, with topical creams, lotions, toners, exfoliators, and serums catering to anti-aging, skin-whitening, and sun protection needs. Additionally, these products provide hydration, maintain skin smoothness, and help create a blemish-free appearance.

The demand for these products is expected to remain strong, growing by 15% in the next five years. Simultaneously, the market for transdermal drug delivery systems, nanoparticle technology, and chemical peel formulations is projected to expand at a rapid pace, driven by advancements in skin barrier function, UV protection factor, skin elasticity measurement, and antioxidant properties. The market for anti-inflammatory compounds and peptide delivery systems is also expected to grow by approximately 18% during the same period. In conclusion, the market is a dynamic and evolving industry, with a diverse range of products and technologies catering to various consumer needs.

The market is driven by advancements in formulations, regulatory compliance, and consumer preferences, with a focus on addressing skin aging, acne, and skin protection concerns. The market is expected to grow significantly in the coming years, with face skincare products, transdermal drug delivery systems, and nanoparticle technology leading the charge.

Cosmetic Skin Care Market Size

Request Free Sample

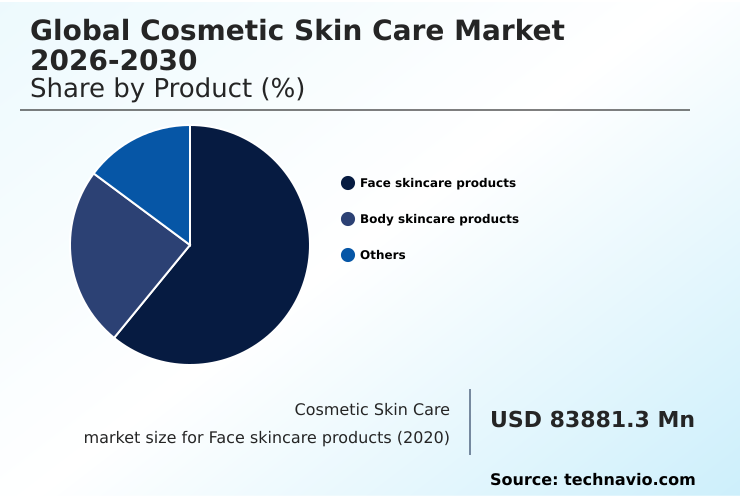
The Face skincare products segment was valued at USD 88.00 billion in 2019 and showed a gradual increase during the forecast period.

Cosmetic Skin Care Market Size

Request Free Sample

Regional Analysis

APAC is estimated to contribute 52% to the growth of the global market during the forecast period.Technavio's analysts have elaborately explained the regional trends and drivers that shape the market during the forecast period.

Cosmetic Skin Care Market Share by Geography

See How Cosmetic Skin Care Market Demand is Rising in APAC Request Free Sample

The market in the Asia Pacific (APAC) region is experiencing significant growth, making it the fastest-growing geographic segment. Major contributors to this expansion include Japan, China, India, and South Korea. Numerous companies in this region cater to the increasing demand for cosmetic skin care, driving market growth. For instance, Amorepacific, based in South Korea, offers products like TIME RESPONSE Skin Renewal Creme and TIME RESPONSE Skin Renewal Serum, which contain antioxidants to shield and rejuvenate skin.

Likewise, Bio Veda Action Research, headquartered in India, provides skin care solutions such as BIO MORNING NECTAR face lotion, BIO SANDALWOOD face cream, and BIO CARROT face cream, addressing the rising consumer preference for such products.

Market Dynamics

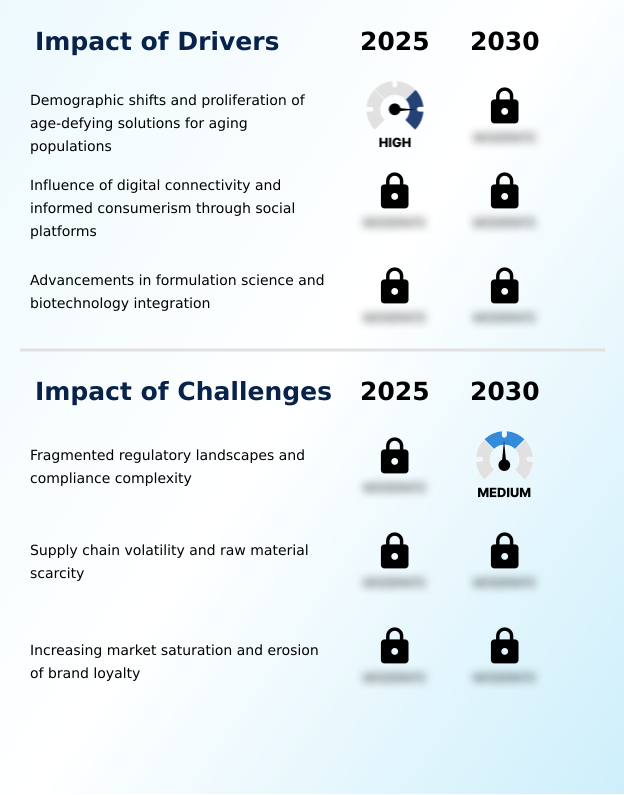
Our researchers analyzed the data with 2024 as the base year, along with the key drivers, trends, and challenges. A holistic analysis of drivers will help companies refine their marketing strategies to gain a competitive advantage.

The market is a dynamic and innovative industry, driven by consumer demand for effective solutions addressing various skin concerns. Efficacy of topical retinoids continues to be a key focus, as these ingredients demonstrate proven results in skin rejuvenation and anti-aging. Measuring skin hydration levels and assessing collagen production stimulation are crucial aspects of product development, as these factors significantly impact the appearance and health of the skin. Advanced skincare technologies, such as peptide delivery optimization and antioxidant capacity assessment, are gaining traction due to their ability to enhance the penetration and efficacy of active ingredients. The mechanisms of skin aging, including the effects of UV radiation, are extensively researched to develop targeted solutions.

Skin barrier integrity testing is essential to ensure product safety and efficacy, while clinical evaluation methods and ingredient interaction studies contribute to the development of superior formulations. Formulation stability analysis, consumer preference surveys, and packaging material selection are critical aspects of the market, as they directly impact the overall user experience and market acceptance. Regulatory guidelines compliance and supply chain sustainability are increasingly important considerations, as consumers demand transparency and eco-friendly practices. More than 70% of new product developments focus on the Asia Pacific region, driven by a large and growing consumer base. Dermal filler applications and microdermabrasion efficacy are significant market trends, as these treatments offer visible improvements and align with the growing demand for non-invasive cosmetic solutions.

Chemical peel techniques, too, remain popular due to their ability to address various skin concerns and deliver noticeable results. In contrast, the academic segment accounts for a minority share of the market, as industry-driven innovation and consumer demand continue to shape the landscape. Despite this, collaboration between academia and industry is crucial for driving breakthroughs and pushing the boundaries of what's possible in the realm of cosmetic skin care.

Cosmetic Skin Care Market Size

What are the key market drivers leading to the rise in the adoption of Cosmetic Skin Care Industry?

  • The market is primarily driven by the expanding demographic segment of individuals aged between 30 and 50 years. 
  • The market has witnessed significant growth due to the increasing population in the 30-50 age group, seeking flawless skin and enhancing their overall appearance. Middle-aged individuals are increasingly concerned about aging, with intrinsic aging causing changes in facial appearance, such as loss of skin elasticity, collagen production decrease, and the emergence of lines, wrinkles, and hyperpigmentation. Extrinsic aging factors, including climate, pollution, stress, and diet, further damage the dermis and negatively impact collagen and elastic fibers. This continuous evolution in aging patterns necessitates the development and adoption of advanced cosmetic skin care products. The market is dynamic, with ongoing research and innovation addressing various skin concerns, making cosmetic skin care a vital sector for businesses and consumers alike.

What are the market trends shaping the Cosmetic Skin Care Industry?

  • The increasing demand for organic cosmetics and cosmeceuticals represents a notable market trend. Organic cosmetics and cosmeceuticals are gaining popularity among consumers.
  • Consumers are increasingly favoring organic or chemical-free cosmetics and cosmeceuticals over their chemical counterparts. These products, devoid of harsh compounds, offer benefits such as improved skin health and reduced irritation for individuals with sensitive skin. Parabens and phthalates, commonly used in chemical cosmetics, have been linked to health concerns like cancer and diabetes. In response, the cosmetics industry is turning to natural raw materials for manufacturing organic skin care.
  • Neem extracts, soybean, fish oil, aloe vera, and guar gum are some of the natural ingredients gaining traction in the market. This shift towards organic and chemical-free cosmetics signifies a continuous evolution in consumer preferences and industry trends.

What challenges does the Cosmetic Skin Care Industry face during its growth?

  • The escalating costs of cosmetic skin care products pose a significant challenge to the industry's growth trajectory. 
  • The high-end cosmetics market is characterized by the use of premium ingredients and innovative formulations in skin care products, leading to significant price points. These products often include expensive components like diamonds, gold, caviar extract, saffron, rose, and jasmine essential oils, arginine, and other nourishing elements such as peptides and retinol. The inclusion of these ingredients, along with packaging and advertising costs, contributes to the elevated pricing.
  • Companies are continually investing in research and development to produce advanced, efficient, and safe cosmetics, utilizing a blend of antioxidants and nourishing ingredients to combat fine lines and wrinkles. This ongoing commitment to innovation and quality maintains the market's dynamism and keeps consumer expectations high.

Exclusive Technavio Analysis on Customer Landscape

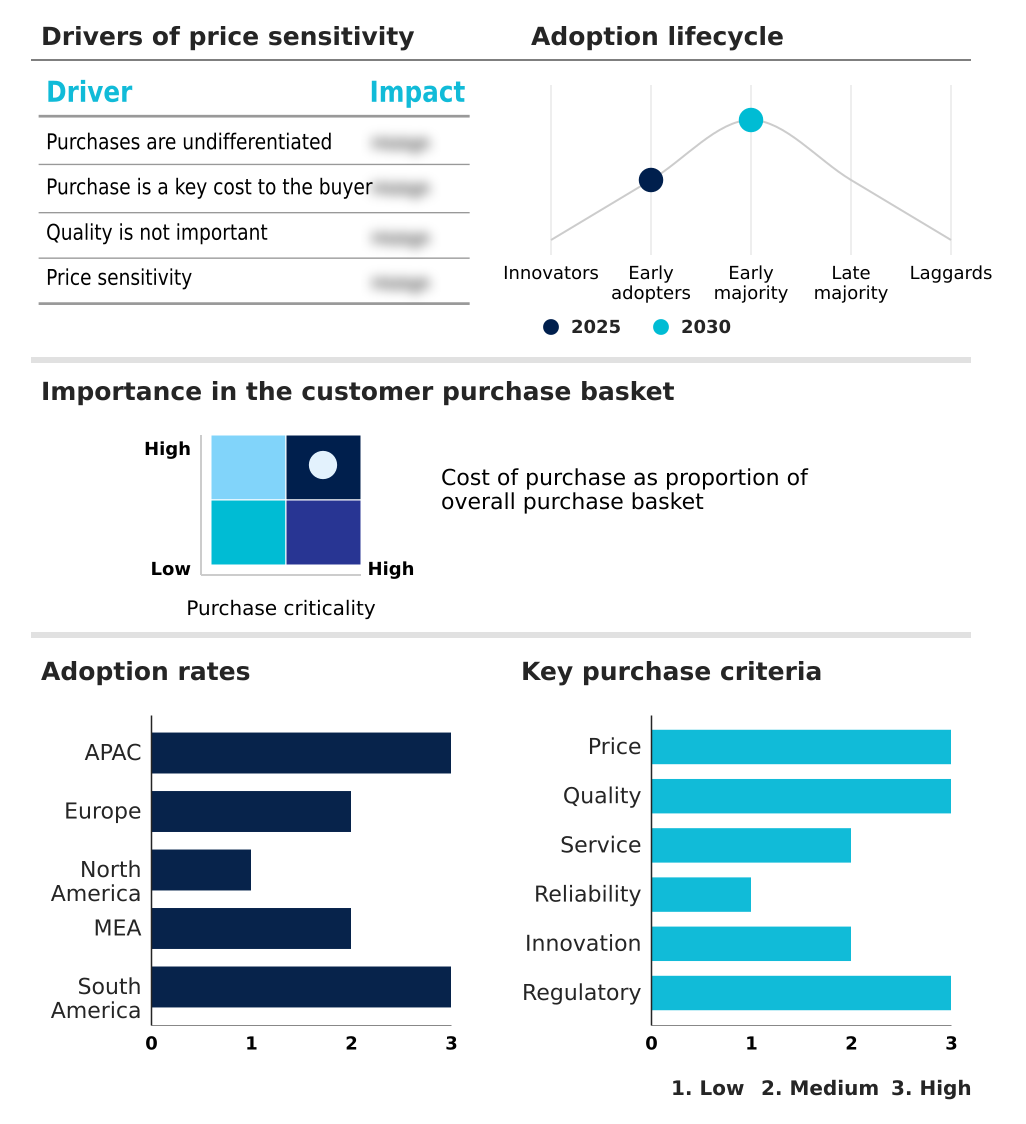
The cosmetic skin care market forecasting report includes the adoption lifecycle of the market, covering from the innovator's stage to the laggard's stage. It focuses on adoption rates in different regions based on penetration. Furthermore, the cosmetic skin care market report also includes key purchase criteria and drivers of price sensitivity to help companies evaluate and develop their market growth analysis strategies.

Cosmetic Skin Care Market Share by Geography

 Customer Landscape of Cosmetic Skin Care Industry

Competitive Landscape

Companies are implementing various strategies, such as strategic alliances, cosmetic skin care market forecast, partnerships, mergers and acquisitions, geographical expansion, and product/service launches, to enhance their presence in the industry.

Amorepacific Corp. - The company is a leading global manufacturer and marketer of personal care products, encompassing face cream, hand cream, body lotion, and shower gel, under the brands Nivea and Eucerin. These brands cater to diverse consumer needs, with Nivea focusing on skincare solutions and Eucerin specializing in dermatologically-tested products. The company's extensive product portfolio is renowned for delivering high-quality, effective solutions for various skin types and concerns.

The industry research and growth report includes detailed analyses of the competitive landscape of the market and information about key companies, including:

  • Amorepacific Corp.
  • Beiersdorf AG
  • Chanel Ltd.
  • Clamar Cosmetics
  • Colgate Palmolive Co.
  • Gayatri Herbals Pvt. Ltd.
  • Groupe Clarins
  • Hindustan Unilever ltd
  • Kanebo Cosmetics Inc.
  • Kenvue Brands LLC
  • LOreal SA
  • LVMH Moet Hennessy Louis Vuitton SE
  • Natura and Co Holding SA
  • Nutriglow Cosmetics Pvt. Ltd.
  • Oriflame Cosmetics S.A.
  • Revlon Inc.
  • Shiseido Co. Ltd.
  • The Body Shop International Ltd.
  • The Estee Lauder Co. Inc.
  • The Procter and Gamble Co.

Qualitative and quantitative analysis of companies has been conducted to help clients understand the wider business environment as well as the strengths and weaknesses of key industry players. Data is qualitatively analyzed to categorize companies as pure play, category-focused, industry-focused, and diversified; it is quantitatively analyzed to categorize companies as dominant, leading, strong, tentative, and weak.

Recent Development and News in Cosmetic Skin Care Market

  • In January 2024, L'Oréal, the world's largest cosmetics company, introduced a new range of anti-aging skincare products, Revitalift Derm, featuring a unique combination of hyaluronic acid and ceramides, as per their official press release. This launch marked a significant expansion of their skincare portfolio, targeting the growing demand for anti-aging solutions.
  • In March 2024, Estée Lauder Companies announced a strategic partnership with Deciem, a Canadian skincare brand, to distribute its popular The Ordinary and Niod product lines globally, as reported by Reuters. This collaboration aimed to leverage Deciem's innovative, science-backed skincare offerings and Estée Lauder's extensive distribution network.
  • In May 2024, Unilever, the Anglo-Dutch consumer goods giant, completed the acquisition of Paula's Choice, a US-based skincare brand known for its effective, science-backed products, for approximately USD1.1 billion, according to a company filing. This acquisition strengthened Unilever's position in the premium skincare market and expanded its offerings to cater to the growing demand for personalized skincare solutions.
  • In February 2025, the European Union approved the use of nanotechnology in cosmetics, as reported by the European Commission. This approval opened the door for cosmetic companies to use nanotechnology in their skincare products, enabling the development of more effective and advanced formulations.

Dive into Technavio's robust research methodology, blending expert interviews, extensive data synthesis, and validated models for unparalleled Cosmetic Skin Care Market insights. See full methodology.

Market Scope

Report Coverage

Details

Page number

202

Base year

2024

Historic period

2019-2023

Forecast period

2025-2029

Growth momentum & CAGR

Accelerate at a CAGR of 9.5%

Market growth 2025-2029

USD 101.9 billion

Market structure

Fragmented

YoY growth 2024-2025(%)

8.5

Key countries

US, Canada, Germany, UK, Italy, France, China, India, Japan, Brazil, Egypt, UAE, Oman, Argentina, KSA, UAE, Brazil, and Rest of World (ROW)

Competitive landscape

Leading Companies, Market Positioning of Companies, Competitive Strategies, and Industry Risks

Request Free Sample

Research Analyst Overview

  • In the dynamic and evolving the market, innovative technologies and ingredients continue to shape the industry landscape. Two noteworthy areas of development include exfoliating agents and transdermal drug delivery systems. Exfoliating agents, such as alpha-hydroxy acids and beta-hydroxy acids, play a crucial role in removing dead skin cells, revealing smoother, more radiant complexions. Transdermal drug delivery, meanwhile, is revolutionizing skin care through advanced delivery systems like liposomal encapsulation. This technology enables active ingredients, such as hyaluronic acid serums, to penetrate deeper into the skin, enhancing their efficacy. Regulatory compliance remains a key focus in the market, with dermal filler injections and dermatological testing ensuring product safety and efficacy.
  • Prevention of photoaging and reduction of wrinkles are ongoing concerns, with melanin production inhibition and skin brightening ingredients becoming increasingly popular. Clinical trial results demonstrate the effectiveness of cosmeceutical formulations containing collagen synthesis promoters, retinol, ceramides, and antioxidant properties. Skin aging biomarkers provide valuable insights into the impact of these ingredients on skin health. Acne treatment efficacy is another area of intense research, with ingredient formulations targeting sebum regulation and anti-inflammatory compounds. Peptide delivery systems and nanoparticle technology are also gaining traction, offering improved product efficacy and consumer perception. Skin microbiome analysis is a recent development in the market, shedding light on the role of beneficial bacteria in maintaining skin health.
  • UV protection factor and skin elasticity measurement are essential aspects of comprehensive skin care, with consumers increasingly seeking products that cater to these concerns. The market is a vibrant and ever-changing landscape, with continuous innovation and research driving growth and development.

What are the Key Data Covered in this Cosmetic Skin Care Market Research and Growth Report?

  • What is the expected growth of the Cosmetic Skin Care Market between 2025 and 2029?

    • USD 101.9 billion, at a CAGR of 9.5%

  • What segmentation does the market report cover?

    • The report segmented by Product (Face skincare products, Body skincare products, and Others), Distribution Channel (Offline and Online), Geography (APAC, Europe, North America, Middle East and Africa, and South America), End User (Women and Men), and Price Point (Mass and Premium)

  • Which regions are analyzed in the report?

    • APAC, Europe, North America, Middle East and Africa, and South America

  • What are the key growth drivers and market challenges?

    • Growing population in age group of 30-50 years, High cost of cosmetic skin care products

  • Who are the major players in the Cosmetic Skin Care Market?

    • Key Companies Amorepacific Corp., Beiersdorf AG, Chanel Ltd., Clamar Cosmetics, Colgate Palmolive Co., Gayatri Herbals Pvt. Ltd., Groupe Clarins, Hindustan Unilever ltd, Kanebo Cosmetics Inc., Kenvue Brands LLC, LOreal SA, LVMH Moet Hennessy Louis Vuitton SE, Natura and Co Holding SA, Nutriglow Cosmetics Pvt. Ltd., Oriflame Cosmetics S.A., Revlon Inc., Shiseido Co. Ltd., The Body Shop International Ltd., The Estee Lauder Co. Inc., and The Procter and Gamble Co.

Market Research Insights

  • The market encompasses a diverse range of products and services designed to address various skin concerns, from pore size reduction and skin tone improvement to skin regeneration and anti-aging solutions. According to industry estimates, this market is expected to reach a value of USD176.7 billion by 2025, representing a significant growth from its current size. Advertising campaigns play a crucial role in driving consumer awareness and acceptance, while formulation development and ingredient sourcing are key areas of focus for manufacturers. Product labeling, quality control metrics, and supply chain management are essential components of ensuring consumer safety and satisfaction. With the increasing demand for natural and organic ingredients, ingredient safety and sustainability are becoming increasingly important.
  • Product innovation, such as advanced active ingredient concentrations and improved manufacturing processes, are driving sales performance. Clinical studies, product stability testing, sensory evaluation, and packaging design are integral parts of the research and development process. Skin texture analysis and efficacy claims are key performance indicators for measuring product success. The skin aging process is a continuous and evolving challenge, necessitating ongoing product innovation and consumer education.

We can help! Our analysts can customize this cosmetic skin care market research report to meet your requirements.

Get in touch

1 Executive Summary

  • 1.1 Market overview
    • Executive Summary - Chart on Market Overview
    • Executive Summary - Data Table on Market Overview
    • Executive Summary - Chart on Global Market Characteristics
    • Executive Summary - Chart on Market by Geography
    • Executive Summary - Chart on Market Segmentation by Product
    • Executive Summary - Chart on Market Segmentation by Distribution Channel
    • Executive Summary - Chart on Incremental Growth
    • Executive Summary - Data Table on Incremental Growth
    • Executive Summary - Chart on Company Market Positioning

2 Technavio Analysis

  • 2.1 Analysis of price sensitivity, lifecycle, customer purchase basket, adoption rates, and purchase criteria
    • Analysis of price sensitivity, lifecycle, customer purchase basket, adoption rates, and purchase criteria
  • 2.2 Criticality of inputs and Factors of differentiation
    • Overview on criticality of inputs and factors of differentiation
  • 2.3 Factors of disruption
    • Overview on factors of disruption
  • 2.4 Impact of drivers and challenges
    • Impact of drivers and challenges in 2024 and 2029

3 Market Landscape

  • 3.1 Market ecosystem
    • Parent Market
    • Data Table on - Parent Market
  • 3.2 Market characteristics
    • Market characteristics analysis
  • 3.3 Value chain analysis
    • Value chain analysis

4 Market Sizing

  • 4.1 Market definition
    • Offerings of companies included in the market definition
  • 4.2 Market segment analysis
    • Market segments
  • 4.3 Market size 2024
    • 4.4 Market outlook: Forecast for 2024-2029
      • Chart on Global - Market size and forecast 2024-2029 ($ billion)
      • Data Table on Global - Market size and forecast 2024-2029 ($ billion)
      • Chart on Global Market: Year-over-year growth 2024-2029 (%)
      • Data Table on Global Market: Year-over-year growth 2024-2029 (%)

    5 Historic Market Size

    • 5.1 Global Cosmetic Skin Care Market 2019 - 2023
      • Historic Market Size - Data Table on Global Cosmetic Skin Care Market 2019 - 2023 ($ billion)
    • 5.2 Product segment analysis 2019 - 2023
      • Historic Market Size - Product Segment 2019 - 2023 ($ billion)
    • 5.3 Distribution Channel segment analysis 2019 - 2023
      • Historic Market Size - Distribution Channel Segment 2019 - 2023 ($ billion)
    • 5.4 Geography segment analysis 2019 - 2023
      • Historic Market Size - Geography Segment 2019 - 2023 ($ billion)
    • 5.5 Country segment analysis 2019 - 2023
      • Historic Market Size - Country Segment 2019 - 2023 ($ billion)

    6 Qualitative Analysis

    • 6.1 The AI impact on Global Cosmetic Skin Care Market

      7 Five Forces Analysis

      • 7.1 Five forces summary
        • Five forces analysis - Comparison between 2024 and 2029
      • 7.2 Bargaining power of buyers
        • Bargaining power of buyers - Impact of key factors 2024 and 2029
      • 7.3 Bargaining power of suppliers
        • Bargaining power of suppliers - Impact of key factors in 2024 and 2029
      • 7.4 Threat of new entrants
        • Threat of new entrants - Impact of key factors in 2024 and 2029
      • 7.5 Threat of substitutes
        • Threat of substitutes - Impact of key factors in 2024 and 2029
      • 7.6 Threat of rivalry
        • Threat of rivalry - Impact of key factors in 2024 and 2029
      • 7.7 Market condition
        • Chart on Market condition - Five forces 2024 and 2029

      8 Market Segmentation by Product

      • 8.1 Market segments
        • Chart on Product - Market share (2024-2029) (%)
        • Data Table on Product - Market share (2024-2029) (%)
      • 8.2 Comparison by Product
        • Chart on Comparison by Product
        • Data Table on Comparison by Product
      • 8.3 Face skincare products - Market size and forecast (2024-2029)
        • Chart on Face skincare products - Market size and forecast (2024-2029) ($ billion)
        • Data Table on Face skincare products - Market size and forecast (2024-2029) ($ billion)
        • Chart on Face skincare products - Year-over-year growth (2024-2029) (%)
        • Data Table on Face skincare products - Year-over-year growth (2024-2029) (%)
      • 8.4 Body skincare products - Market size and forecast (2024-2029)
        • Chart on Body skincare products - Market size and forecast (2024-2029) ($ billion)
        • Data Table on Body skincare products - Market size and forecast (2024-2029) ($ billion)
        • Chart on Body skincare products - Year-over-year growth (2024-2029) (%)
        • Data Table on Body skincare products - Year-over-year growth (2024-2029) (%)
      • 8.5 Others - Market size and forecast (2024-2029)
        • Chart on Others - Market size and forecast (2024-2029) ($ billion)
        • Data Table on Others - Market size and forecast (2024-2029) ($ billion)
        • Chart on Others - Year-over-year growth (2024-2029) (%)
        • Data Table on Others - Year-over-year growth (2024-2029) (%)
      • 8.6 Market opportunity by Product
        • Market opportunity by Product ($ billion)
        • Data Table on Market opportunity by Product ($ billion)

      9 Market Segmentation by Distribution Channel

      • 9.1 Market segments
        • Chart on Distribution Channel - Market share (2024-2029) (%)
        • Data Table on Distribution Channel - Market share (2024-2029) (%)
      • 9.2 Comparison by Distribution Channel
        • Chart on Comparison by Distribution Channel
        • Data Table on Comparison by Distribution Channel
      • 9.3 Offline - Market size and forecast (2024-2029)
        • Chart on Offline - Market size and forecast (2024-2029) ($ billion)
        • Data Table on Offline - Market size and forecast (2024-2029) ($ billion)
        • Chart on Offline - Year-over-year growth (2024-2029) (%)
        • Data Table on Offline - Year-over-year growth (2024-2029) (%)
      • 9.4 Online - Market size and forecast (2024-2029)
        • Chart on Online - Market size and forecast (2024-2029) ($ billion)
        • Data Table on Online - Market size and forecast (2024-2029) ($ billion)
        • Chart on Online - Year-over-year growth (2024-2029) (%)
        • Data Table on Online - Year-over-year growth (2024-2029) (%)
      • 9.5 Market opportunity by Distribution Channel
        • Market opportunity by Distribution Channel ($ billion)
        • Data Table on Market opportunity by Distribution Channel ($ billion)

      10 Market Segmentation by End User

      • 10.1 Market segments
        • Chart on End User - Market share (2024-2029) (%)
        • Data Table on End User - Market share (2024-2029) (%)
      • 10.2 Comparison by End User
        • Chart on Comparison by End User
        • Data Table on Comparison by End User
      • 10.3 Women - Market size and forecast (2024-2029)
        • Chart on Women - Market size and forecast (2024-2029) ($ billion)
        • Data Table on Women - Market size and forecast (2024-2029) ($ billion)
        • Chart on Women - Year-over-year growth (2024-2029) (%)
        • Data Table on Women - Year-over-year growth (2024-2029) (%)
      • 10.4 Men - Market size and forecast (2024-2029)
        • Chart on Men - Market size and forecast (2024-2029) ($ billion)
        • Data Table on Men - Market size and forecast (2024-2029) ($ billion)
        • Chart on Men - Year-over-year growth (2024-2029) (%)
        • Data Table on Men - Year-over-year growth (2024-2029) (%)
      • 10.5 Market opportunity by End User
        • Market opportunity by End User ($ billion)
        • Data Table on Market opportunity by End User ($ billion)

      11 Market Segmentation by Price Point

      • 11.1 Market segments
        • Chart on Price Point - Market share (2024-2029) (%)
        • Data Table on Price Point - Market share (2024-2029) (%)
      • 11.2 Comparison by Price Point
        • Chart on Comparison by Price Point
        • Data Table on Comparison by Price Point
      • 11.3 Mass - Market size and forecast (2024-2029)
        • Chart on Mass - Market size and forecast (2024-2029) ($ billion)
        • Data Table on Mass - Market size and forecast (2024-2029) ($ billion)
        • Chart on Mass - Year-over-year growth (2024-2029) (%)
        • Data Table on Mass - Year-over-year growth (2024-2029) (%)
      • 11.4 Premium - Market size and forecast (2024-2029)
        • Chart on Premium - Market size and forecast (2024-2029) ($ billion)
        • Data Table on Premium - Market size and forecast (2024-2029) ($ billion)
        • Chart on Premium - Year-over-year growth (2024-2029) (%)
        • Data Table on Premium - Year-over-year growth (2024-2029) (%)
      • 11.5 Market opportunity by Price Point
        • Market opportunity by Price Point ($ billion)
        • Data Table on Market opportunity by Price Point ($ billion)

      12 Customer Landscape

      • 12.1 Customer landscape overview
        • Analysis of price sensitivity, lifecycle, customer purchase basket, adoption rates, and purchase criteria

      13 Geographic Landscape

      • 13.1 Geographic segmentation
        • Chart on Market share by geography 2024-2029 (%)
        • Data Table on Market share by geography 2024-2029 (%)
      • 13.2 Geographic comparison
        • Chart on Geographic comparison
        • Data Table on Geographic comparison
      • 13.3 APAC - Market size and forecast 2024-2029
        • Chart on APAC - Market size and forecast 2024-2029 ($ billion)
        • Data Table on APAC - Market size and forecast 2024-2029 ($ billion)
        • Chart on APAC - Year-over-year growth 2024-2029 (%)
        • Data Table on APAC - Year-over-year growth 2024-2029 (%)
      • 13.4 Europe - Market size and forecast 2024-2029
        • Chart on Europe - Market size and forecast 2024-2029 ($ billion)
        • Data Table on Europe - Market size and forecast 2024-2029 ($ billion)
        • Chart on Europe - Year-over-year growth 2024-2029 (%)
        • Data Table on Europe - Year-over-year growth 2024-2029 (%)
      • 13.5 North America - Market size and forecast 2024-2029
        • Chart on North America - Market size and forecast 2024-2029 ($ billion)
        • Data Table on North America - Market size and forecast 2024-2029 ($ billion)
        • Chart on North America - Year-over-year growth 2024-2029 (%)
        • Data Table on North America - Year-over-year growth 2024-2029 (%)
      • 13.6 Middle East and Africa - Market size and forecast 2024-2029
        • Chart on Middle East and Africa - Market size and forecast 2024-2029 ($ billion)
        • Data Table on Middle East and Africa - Market size and forecast 2024-2029 ($ billion)
        • Chart on Middle East and Africa - Year-over-year growth 2024-2029 (%)
        • Data Table on Middle East and Africa - Year-over-year growth 2024-2029 (%)
      • 13.7 South America - Market size and forecast 2024-2029
        • Chart on South America - Market size and forecast 2024-2029 ($ billion)
        • Data Table on South America - Market size and forecast 2024-2029 ($ billion)
        • Chart on South America - Year-over-year growth 2024-2029 (%)
        • Data Table on South America - Year-over-year growth 2024-2029 (%)
      • 13.8 US - Market size and forecast 2024-2029
        • Chart on US - Market size and forecast 2024-2029 ($ billion)
        • Data Table on US - Market size and forecast 2024-2029 ($ billion)
        • Chart on US - Year-over-year growth 2024-2029 (%)
        • Data Table on US - Year-over-year growth 2024-2029 (%)
      • 13.9 China - Market size and forecast 2024-2029
        • Chart on China - Market size and forecast 2024-2029 ($ billion)
        • Data Table on China - Market size and forecast 2024-2029 ($ billion)
        • Chart on China - Year-over-year growth 2024-2029 (%)
        • Data Table on China - Year-over-year growth 2024-2029 (%)
      • 13.10 Japan - Market size and forecast 2024-2029
        • Chart on Japan - Market size and forecast 2024-2029 ($ billion)
        • Data Table on Japan - Market size and forecast 2024-2029 ($ billion)
        • Chart on Japan - Year-over-year growth 2024-2029 (%)
        • Data Table on Japan - Year-over-year growth 2024-2029 (%)
      • 13.11 India - Market size and forecast 2024-2029
        • Chart on India - Market size and forecast 2024-2029 ($ billion)
        • Data Table on India - Market size and forecast 2024-2029 ($ billion)
        • Chart on India - Year-over-year growth 2024-2029 (%)
        • Data Table on India - Year-over-year growth 2024-2029 (%)
      • 13.12 Germany - Market size and forecast 2024-2029
        • Chart on Germany - Market size and forecast 2024-2029 ($ billion)
        • Data Table on Germany - Market size and forecast 2024-2029 ($ billion)
        • Chart on Germany - Year-over-year growth 2024-2029 (%)
        • Data Table on Germany - Year-over-year growth 2024-2029 (%)
      • 13.13 UK - Market size and forecast 2024-2029
        • Chart on UK - Market size and forecast 2024-2029 ($ billion)
        • Data Table on UK - Market size and forecast 2024-2029 ($ billion)
        • Chart on UK - Year-over-year growth 2024-2029 (%)
        • Data Table on UK - Year-over-year growth 2024-2029 (%)
      • 13.14 France - Market size and forecast 2024-2029
        • Chart on France - Market size and forecast 2024-2029 ($ billion)
        • Data Table on France - Market size and forecast 2024-2029 ($ billion)
        • Chart on France - Year-over-year growth 2024-2029 (%)
        • Data Table on France - Year-over-year growth 2024-2029 (%)
      • 13.15 Canada - Market size and forecast 2024-2029
        • Chart on Canada - Market size and forecast 2024-2029 ($ billion)
        • Data Table on Canada - Market size and forecast 2024-2029 ($ billion)
        • Chart on Canada - Year-over-year growth 2024-2029 (%)
        • Data Table on Canada - Year-over-year growth 2024-2029 (%)
      • 13.16 Brazil - Market size and forecast 2024-2029
        • Chart on Brazil - Market size and forecast 2024-2029 ($ billion)
        • Data Table on Brazil - Market size and forecast 2024-2029 ($ billion)
        • Chart on Brazil - Year-over-year growth 2024-2029 (%)
        • Data Table on Brazil - Year-over-year growth 2024-2029 (%)
      • 13.17 UAE - Market size and forecast 2024-2029
        • Chart on UAE - Market size and forecast 2024-2029 ($ billion)
        • Data Table on UAE - Market size and forecast 2024-2029 ($ billion)
        • Chart on UAE - Year-over-year growth 2024-2029 (%)
        • Data Table on UAE - Year-over-year growth 2024-2029 (%)
      • 13.18 Market opportunity by geography
        • Market opportunity by geography ($ billion)
        • Data Tables on Market opportunity by geography ($ billion)
      • 13.19 Italy - Market size and forecast (2024-2029)
        • Chart on Italy - Market size and forecast (2024-2029) ($ billion)
        • Data Table on Italy - Market size and forecast (2024-2029) ($ billion)
        • Chart on Italy - Year-over-year growth (2024-2029) (%)
        • Data Table on Italy - Year-over-year growth (2024-2029) (%)
      • 13.20 Egypt - Market size and forecast (2024-2029)
        • Chart on Egypt - Market size and forecast (2024-2029) ($ billion)
        • Data Table on Egypt - Market size and forecast (2024-2029) ($ billion)
        • Chart on Egypt - Year-over-year growth (2024-2029) (%)
        • Data Table on Egypt - Year-over-year growth (2024-2029) (%)
      • 13.21 Oman - Market size and forecast (2024-2029)
        • Chart on Oman - Market size and forecast (2024-2029) ($ billion)
        • Data Table on Oman - Market size and forecast (2024-2029) ($ billion)
        • Chart on Oman - Year-over-year growth (2024-2029) (%)
        • Data Table on Oman - Year-over-year growth (2024-2029) (%)
      • 13.22 Argentina - Market size and forecast (2024-2029)
        • Chart on Argentina - Market size and forecast (2024-2029) ($ billion)
        • Data Table on Argentina - Market size and forecast (2024-2029) ($ billion)
        • Chart on Argentina - Year-over-year growth (2024-2029) (%)
        • Data Table on Argentina - Year-over-year growth (2024-2029) (%)
      • 13.23 KSA - Market size and forecast (2024-2029)
        • Chart on KSA - Market size and forecast (2024-2029) ($ billion)
        • Data Table on KSA - Market size and forecast (2024-2029) ($ billion)
        • Chart on KSA - Year-over-year growth (2024-2029) (%)
        • Data Table on KSA - Year-over-year growth (2024-2029) (%)
      • 13.24 Rest of World (ROW) - Market size and forecast (2024-2029)
        • Chart on Rest of World (ROW) - Market size and forecast (2024-2029) ($ billion)
        • Data Table on Rest of World (ROW) - Market size and forecast (2024-2029) ($ billion)
        • Chart on Rest of World (ROW) - Year-over-year growth (2024-2029) (%)
        • Data Table on Rest of World (ROW) - Year-over-year growth (2024-2029) (%)

      14 Drivers, Challenges, and Opportunity/Restraints

      • 14.1 Market drivers
        • 14.2 Market challenges
          • 14.3 Impact of drivers and challenges
            • Impact of drivers and challenges in 2024 and 2029
          • 14.4 Market opportunities/restraints

            15 Competitive Landscape

            • 15.1 Overview
              • 15.2 Competitive Landscape
                • Overview on criticality of inputs and factors of differentiation
              • 15.3 Landscape disruption
                • Overview on factors of disruption
              • 15.4 Industry risks
                • Impact of key risks on business

              16 Competitive Analysis

              • 16.1 Companies profiled
                • Companies covered
              • 16.2 Company ranking index
                • Company ranking index
              • 16.3 Market positioning of companies
                • Matrix on companies position and classification
              • 16.4 Beiersdorf AG
                • Beiersdorf AG - Overview
                • Beiersdorf AG - Business segments
                • Beiersdorf AG - Key news
                • Beiersdorf AG - Key offerings
                • Beiersdorf AG - Segment focus
                • SWOT
              • 16.5 Chanel Ltd.
                • Chanel Ltd. - Overview
                • Chanel Ltd. - Product / Service
                • Chanel Ltd. - Key offerings
                • SWOT
              • 16.6 Gayatri Herbals Pvt. Ltd.
                • Gayatri Herbals Pvt. Ltd. - Overview
                • Gayatri Herbals Pvt. Ltd. - Product / Service
                • Gayatri Herbals Pvt. Ltd. - Key offerings
                • SWOT
              • 16.7 Hindustan Unilever ltd
                • Hindustan Unilever ltd - Overview
                • Hindustan Unilever ltd - Product / Service
                • Hindustan Unilever ltd - Key offerings
                • SWOT
              • 16.8 Kanebo Cosmetics Inc.
                • Kanebo Cosmetics Inc. - Overview
                • Kanebo Cosmetics Inc. - Product / Service
                • Kanebo Cosmetics Inc. - Key offerings
                • SWOT
              • 16.9 Kenvue Brands LLC
                • Kenvue Brands LLC - Overview
                • Kenvue Brands LLC - Product / Service
                • Kenvue Brands LLC - Key offerings
                • SWOT
              • 16.10 LOreal SA
                • LOreal SA - Overview
                • LOreal SA - Business segments
                • LOreal SA - Key news
                • LOreal SA - Key offerings
                • LOreal SA - Segment focus
                • SWOT
              • 16.11 LVMH Moet Hennessy Louis Vuitton SE
                • LVMH Moet Hennessy Louis Vuitton SE - Overview
                • LVMH Moet Hennessy Louis Vuitton SE - Business segments
                • LVMH Moet Hennessy Louis Vuitton SE - Key news
                • LVMH Moet Hennessy Louis Vuitton SE - Key offerings
                • LVMH Moet Hennessy Louis Vuitton SE - Segment focus
                • SWOT
              • 16.12 Natura and Co Holding SA
                • Natura and Co Holding SA - Overview
                • Natura and Co Holding SA - Business segments
                • Natura and Co Holding SA - Key offerings
                • Natura and Co Holding SA - Segment focus
                • SWOT
              • 16.13 Oriflame Cosmetics S.A.
                • Oriflame Cosmetics S.A. - Overview
                • Oriflame Cosmetics S.A. - Product / Service
                • Oriflame Cosmetics S.A. - Key offerings
                • SWOT
              • 16.14 Revlon Inc.
                • Revlon Inc. - Overview
                • Revlon Inc. - Business segments
                • Revlon Inc. - Key offerings
                • Revlon Inc. - Segment focus
                • SWOT
              • 16.15 Shiseido Co. Ltd.
                • Shiseido Co. Ltd. - Overview
                • Shiseido Co. Ltd. - Product / Service
                • Shiseido Co. Ltd. - Key news
                • Shiseido Co. Ltd. - Key offerings
                • SWOT
              • 16.16 The Body Shop International Ltd.
                • The Body Shop International Ltd. - Overview
                • The Body Shop International Ltd. - Product / Service
                • The Body Shop International Ltd. - Key offerings
                • SWOT
              • 16.17 The Estee Lauder Co. Inc.
                • The Estee Lauder Co. Inc. - Overview
                • The Estee Lauder Co. Inc. - Product / Service
                • The Estee Lauder Co. Inc. - Key news
                • The Estee Lauder Co. Inc. - Key offerings
                • SWOT
              • 16.18 The Procter and Gamble Co.
                • The Procter and Gamble Co. - Overview
                • The Procter and Gamble Co. - Product / Service
                • The Procter and Gamble Co. - Key offerings
                • SWOT

              17 Appendix

              • 17.1 Scope of the report
                • 17.2 Inclusions and exclusions checklist
                  • Inclusions checklist
                  • Exclusions checklist
                • 17.3 Currency conversion rates for US$
                  • Currency conversion rates for US$
                • 17.4 Research methodology
                  • Research methodology
                • 17.5 Data procurement
                  • Information sources
                • 17.6 Data validation
                  • Data validation
                • 17.7 Validation techniques employed for market sizing
                  • Validation techniques employed for market sizing
                • 17.8 Data synthesis
                  • Data synthesis
                • 17.9 360 degree market analysis
                  • 360 degree market analysis
                • 17.10 List of abbreviations
                  • List of abbreviations

                Research Methodology

                Technavio presents a detailed picture of the market by way of study, synthesis, and summation of data from multiple sources. The analysts have presented the various facets of the market with a particular focus on identifying the key industry influencers. The data thus presented is comprehensive, reliable, and the result of extensive research, both primary and secondary.

                INFORMATION SOURCES

                Primary sources

                • Manufacturers and suppliers
                • Channel partners
                • Industry experts
                • Strategic decision makers

                Secondary sources

                • Industry journals and periodicals
                • Government data
                • Financial reports of key industry players
                • Historical data
                • Press releases

                DATA ANALYSIS

                Data Synthesis

                • Collation of data
                • Estimation of key figures
                • Analysis of derived insights

                Data Validation

                • Triangulation with data models
                • Reference against proprietary databases
                • Corroboration with industry experts

                REPORT WRITING

                Qualitative

                • Market drivers
                • Market challenges
                • Market trends
                • Five forces analysis

                Quantitative

                • Market size and forecast
                • Market segmentation
                • Geographical insights
                • Competitive landscape

                Interested in this report?

                Get your sample now to see our research methodology and insights!

                Download Now

                Frequently Asked Questions

                Cosmetic Skin Care market growth will increase by $ 101.9 bn during 2025-2029 .

                The Cosmetic Skin Care market is expected to grow at a CAGR of 9.5% during 2025-2029 .

                Cosmetic Skin Care market is segmented by Product( Face skincare products, Body skincare products, Others) Distribution Channel( Offline, Online, North America, South America)

                Amorepacific Corp., Beiersdorf AG, Chanel Ltd., Clamar Cosmetics, Colgate Palmolive Co., Gayatri Herbals Pvt. Ltd., Groupe Clarins, Hindustan Unilever ltd, Kanebo Cosmetics Inc., Kenvue Brands LLC, LOreal SA, LVMH Moet Hennessy Louis Vuitton SE, Natura and Co Holding SA, Nutriglow Cosmetics Pvt. Ltd., Oriflame Cosmetics S.A., Revlon Inc., Shiseido Co. Ltd., The Body Shop International Ltd., The Estee Lauder Co. Inc., The Procter and Gamble Co. are a few of the key vendors in the Cosmetic Skin Care market.

                APAC will register the highest growth rate of 52% among the other regions. Therefore, the Cosmetic Skin Care market in APAC is expected to garner significant business opportunities for the vendors during the forecast period.

                US, Canada, Germany, UK, Italy, France, China, India, Japan, Brazil, Egypt, UAE, Oman, Argentina, KSA, UAE, Brazil, Rest of World (ROW)

                • Growing population in age group of 30-50 yearsIn recent years is the driving factor this market.
                • the population in the age group of 30-50 years has been increasing worldwide. This is leading to a growing demand for cosmetic skin care products to achieve flawless-looking skin while improving the persons overall appearance. Middle-aged people are increasingly experiencing aging anxiety because of extrinsic aging factors. Intrinsic aging or chronological aging leads to changes in facial appearance is the driving factor this market.
                • including the loss of skin elasticity and the production of collagen is the driving factor this market.
                • a decrease in dermal collagen is the driving factor this market.
                • the appearance of lines and wrinkles is the driving factor this market.
                • and an increase in hyperpigmentation.Similarly is the driving factor this market.
                • extrinsic aging is caused by factors such as climate is the driving factor this market.
                • pollution is the driving factor this market.
                • stress is the driving factor this market.
                • and diet is the driving factor this market.
                • which lead to damage to the dermis is the driving factor this market.
                • besides having an adverse impact on the collagen and elastic fibers of the skin. Therefore is the driving factor this market.
                • aging anxiety is the driving factor this market.
                • environmental factors is the driving factor this market.
                • concerns about changes in facial appearance is the driving factor this market.
                • and the need to look younger have all led middle-aged people to opt for cosmetic skin care products to obtain clear and glowing skin. The rise in the middle-aged population is leading to the increased adoption of cosmetic skin care products. This has encouraged several manufacturers of cosmetic skin care products to offer skin care products specifically for the middle-aged population.Moreover is the driving factor this market.
                • the younger population under the age of 30 years is also opting for cosmetic products like anti-aging creams and skin care lotions as a part of their skin care regimen to look young and retain their youthful looks. Thus is the driving factor this market.
                • the higher adoption of beauty and skin care products among the younger population is another factor contributing to the overall growth of the market. is the driving factor this market.

                The Cosmetic Skin Care market vendors should focus on grabbing business opportunities from the Face skincare products segment as it accounted for the largest market share in the base year.