Crop Harvesting Robots Market Analysis, Size, and Forecast 2026-2030: North America (US, Canada, and Mexico), Europe (Germany, UK, and France), APAC (China, Japan, and India), Middle East and Africa (Saudi Arabia, UAE, and South Africa), South America (Brazil, Argentina, and Chile), and Rest of World (ROW)

Crop Harvesting Robots Market Analysis, Size, and Forecast 2026-2030:
North America (US, Canada, and Mexico), Europe (Germany, UK, and France), APAC (China, Japan, and India), Middle East and Africa (Saudi Arabia, UAE, and South Africa), South America (Brazil, Argentina, and Chile), and Rest of World (ROW)

Published: May 2026 289 Pages SKU: IRTNTR44559

Market Overview at a Glance

$4.36 B
Market Opportunity
25.2%
CAGR 2025 - 2030
40.3%
North America Growth
$1.19 B
Semi-autonomous robots segment 2024

Crop Harvesting Robots Market Size 2026-2030

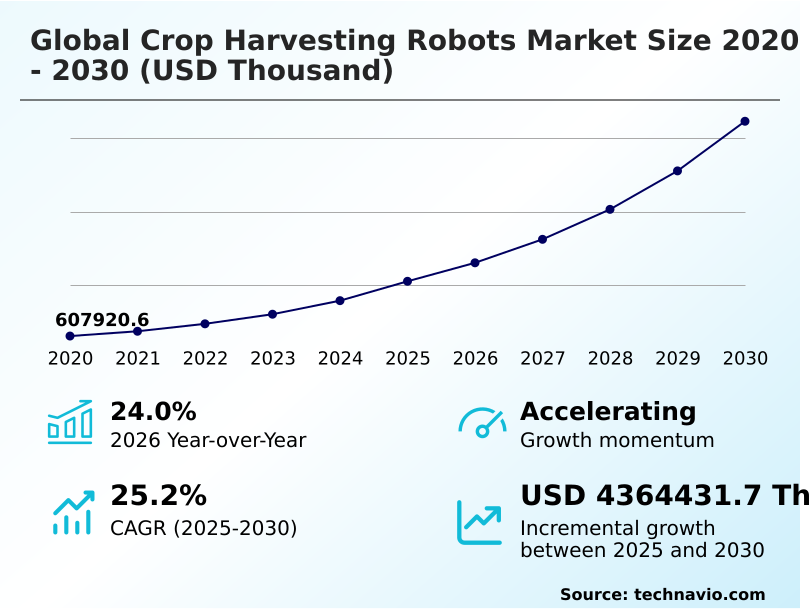
The crop harvesting robots market size is valued to increase by USD 4.36 billion, at a CAGR of 25.2% from 2025 to 2030. Increasing focus on farm mechanization will drive the crop harvesting robots market.

Major Market Trends & Insights

  • North America dominated the market and accounted for a 40.3% growth during the forecast period.
  • By Type - Semi-autonomous robots segment was valued at USD 1.19 billion in 2024
  • By Product - Fruit and vegetable harvesting robots segment accounted for the largest market revenue share in 2024

Market Size & Forecast

  • Market Opportunities:
  • Market Future Opportunities: USD 4.36 billion
  • CAGR from 2025 to 2030 : 25.2%

Market Summary

  • The Crop Harvesting Robots Market demonstrates a rapid transition toward intelligent agricultural mechanization to resolve persistent workforce deficits. Commercial farms are deploying machine vision systems to optimize field operations and enhance output quality during critical harvesting windows.
  • Integrating a precision harvesting mechanism directly addresses the escalating shortage of manual labor by ensuring timely crop collection, which acts as a primary catalyst for expanding automation. Conversely, the technical complexity of implementing a strict robotic maintenance schedule frequently causes operational delays, limiting immediate adoption among smaller agricultural enterprises.
  • In extensive orchard environments, utilizing predictive harvest planning tools has lowered labor overhead by 22% compared to traditional manual coordination. This technological shift facilitates significant post-harvest waste reduction by identifying optimal ripeness stages before extraction. Intelligent harvesting systems are fundamentally restructuring supply chain operations by stabilizing raw material inflow.
  • Agricultural producers continue to leverage these platforms to offset rising wage pressures while maximizing yield consistency.

What will be the Size of the Crop Harvesting Robots Market during the forecast period?
Get Key Insights on Market Forecast (PDF) Get Free Sample

How is the Crop Harvesting Robots Market Segmented?

The crop harvesting robots industry research report provides comprehensive data (region-wise segment analysis), with forecasts and estimates in "USD thousand" for the period 2026-2030, as well as historical data from 2020-2024 for the following segments.

  • Type
    • Semi-autonomous robots
    • Fully-autonomous robots
  • Product
    • Fruit and vegetable harvesting robots
    • Grain harvesting robots
  • Product type
    • Hardware
    • Software
    • Service
  • Geography
    • North America
      • US
      • Canada
      • Mexico
    • Europe
      • Germany
      • UK
      • France
      • Italy
      • Spain
      • The Netherlands
    • APAC
      • China
      • Japan
      • India
      • South Korea
      • Australia
      • Indonesia
    • Middle East and Africa
      • Saudi Arabia
      • UAE
      • South Africa
      • Israel
      • Turkey
    • South America
      • Brazil
      • Argentina
      • Chile

By Type Insights

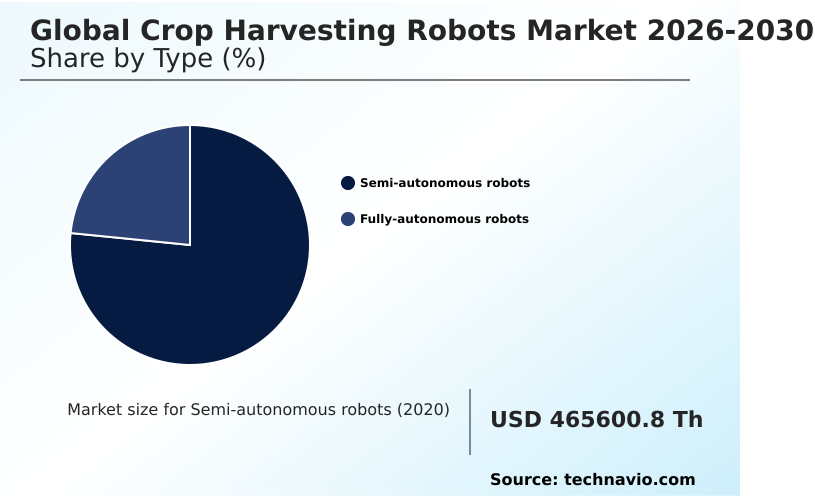
The semi-autonomous robots segment is estimated to witness significant growth during the forecast period.

Semi-autonomous robotic platforms operate by blending human oversight with advanced automation to maintain control over dynamic agricultural tasks. This hybrid operational model addresses the seasonal workforce constraint by reducing dependency on manual pickers while ensuring continuous field activity.

Operators utilize autonomous navigation technology to guide machinery through every complex agricultural field condition, allowing artificial intelligence algorithms to process immediate crop identification tasks.

These systems feature robotic gripping arms that maneuver delicately alongside a precision harvesting mechanism to preserve high value horticultural crop integrity.

By utilizing deep learning image recognition, farms transitioning to this scalable agricultural automation model have improved their error detection rates by 15% compared to fully manual processes.

As the farm mechanization rate accelerates across commercial operations, the adoption of these collaborative systems provides a stable, incremental pathway toward comprehensive automation.
Get Free Sample

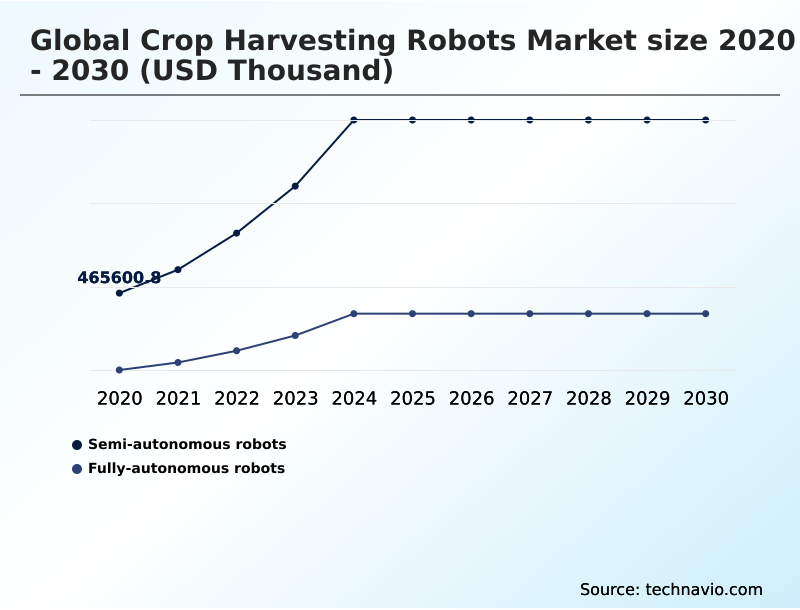
The Semi-autonomous robots segment was valued at USD 1.19 billion in 2024 and showed a gradual increase during the forecast period.
Get Free Sample

Regional Analysis

North America is estimated to contribute 40.3% to the growth of the global market during the forecast period.Technavio’s analysts have elaborately explained the regional trends and drivers that shape the market during the forecast period.
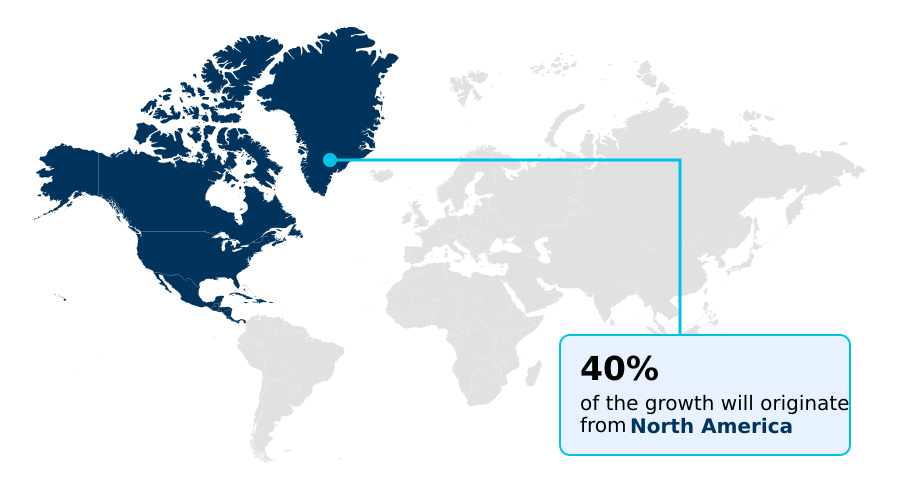
See How Crop Harvesting Robots Market Demand is Rising in North America Get Free Sample

North America and Europe demonstrate distinct regional adoption patterns driven by varying agricultural structures and labor economics.

European facilities have achieved a 35% higher penetration rate in greenhouse farming automation compared to North America, primarily due to an expanding indoor farming cluster and strict environmental mandates.

This accelerated focus on controlled environment agriculture in Europe contrasts with North American deployments, where extensive broadacre farming mechanization prioritizes high-capacity autonomous machinery.

Integrating remote operational monitoring systems with automated farm mapping has reduced fleet downtime by 18% across commercial farms. Furthermore, the implementation of predictive maintenance analytics within automated vineyard management protocols allows regional operators to lower unexpected mechanical failures by 22%.

A surge in agritech venture funding continues to provide the necessary capital for scaling these advanced platforms. Companies actively modify their supply chain strategies to align with every sustainable farming practice, ensuring long-term regional productivity.

Market Dynamics

Our researchers analyzed the data with 2025 as the base year, along with the key drivers, trends, and challenges. A holistic analysis of drivers will help companies refine their marketing strategies to gain a competitive advantage.

  • The transition toward mechanized agricultural frameworks requires comprehensive strategies to maximize operational throughput and reduce supply chain bottlenecks. Implementing robotic strawberry picking in greenhouses enables producers to maintain continuous harvesting cycles without the delays associated with manual workforce availability. This controlled environment approach directly supports higher output consistency.
  • In broadacre settings, successful autonomous grain harvesting farm integration allows facility managers to synchronize fleet movements, resulting in a 25% improvement in logistics coordination compared to unlinked traditional machinery. Ensuring precise crop selection is critical for quality control, and deploying machine vision for apple ripeness ensures only optimal produce enters the distribution network.
  • Evaluating solar powered agricultural robots efficiency reveals that renewable energy integration significantly lowers long-term operational expenditures while aligning with corporate sustainability directives. Furthermore, addressing automated fruit handling crop damage is essential for preserving the commercial value of delicate horticultural yields. Agricultural enterprises utilizing these interconnected robotic solutions experience streamlined processing timelines and minimized resource waste.
  • The continuous evolution of these mechanical platforms allows producers to adapt swiftly to fluctuating environmental and economic pressures. By leveraging advanced detection and extraction technologies, agricultural businesses establish a more resilient, cost-effective framework that meets the rising demands of international food supply chains.
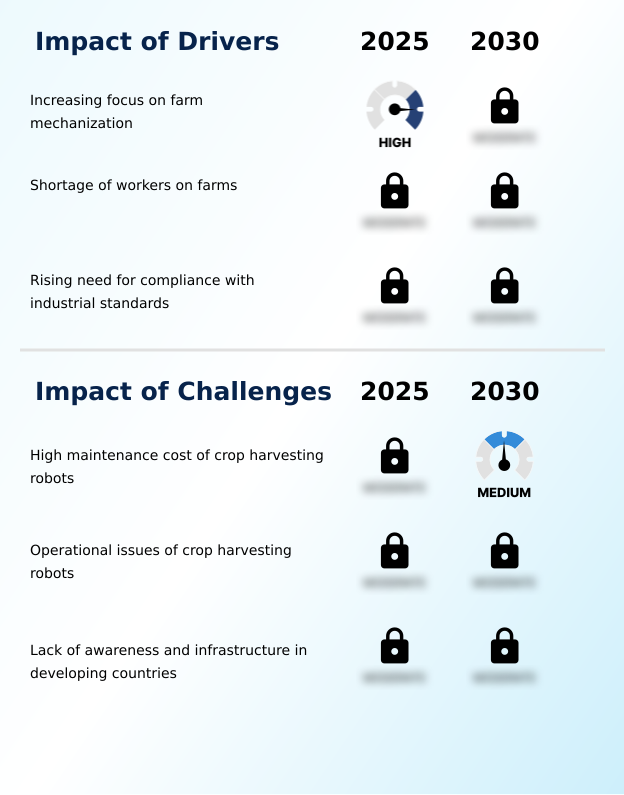
What are the key market drivers leading to the rise in the adoption of Crop Harvesting Robots Industry?

  • An increasing focus on farm mechanization serves as the primary driver propelling expansion within the agricultural automation sector.

  • The critical need to offset severe manual labor shortages acts as the primary catalyst driving the deployment of autonomous harvesting platforms.
  • Advanced crop ripeness detection mechanisms utilizing sensor-based crop detection analyze precise pigmentation metrics, enabling organizations to execute predictive harvest planning seamlessly. This capability is particularly vital for soft fruit picking, where precision handling is required to avoid commercial value degradation.
  • By assessing field dynamics, these robots utilize dynamic route optimization and adjust their operational parameters instantaneously via real time data processing.
  • Implementing these automated solutions alongside yield optimization analytics has reduced crop spoilage by 19% compared to traditional manual harvesting methods.
  • Improvements in any battery storage system directly enhance robotic hardware durability, systematically yielding a 22% improvement in overall agricultural resource efficiency. Farming enterprises utilize these robotic systems to stabilize productivity and ensure reliable supply chain outputs.

What are the market trends shaping the Crop Harvesting Robots Industry?

  • The expansion of greenhouse farms is significantly augmenting overall prosperity within the industry. This emerging trend reflects a structural shift toward controlled agricultural environments.

  • The integration of continuous machine learning capabilities accelerates a significant trend toward highly adaptable agricultural extraction systems. Advanced robotic trajectory planning enables platforms equipped with machine vision systems to navigate dense crop canopies, ensuring precise crop damage mitigation during the collection process. This technological evolution accelerates comprehensive agricultural workflow automation, allowing commercial facilities to streamline post-harvest processing.
  • The deployment of a smart combine harvester functioning as a smart agricultural implement has improved field clearance rates by 28% compared to conventional human-operated machinery. Upgraded mechanical components have expanded overall robotic payload capacity, driving a 15% reduction in required transit trips.
  • These efficiency gains directly support post-harvest waste reduction while seamless IoT farm integration feeds data into cloud-based yield tracking platforms. Businesses leverage these autonomous systems to drastically reduce operational bottlenecks and maintain high-volume supply chain continuity.

What challenges does the Crop Harvesting Robots Industry face during its growth?

  • The high maintenance costs associated with advanced robotic harvesting systems present a significant challenge limiting widespread industry adoption.

  • Ensuring consistent operational reliability in unpredictable environmental settings presents a substantial structural limitation for autonomous harvesting deployment. The integration of any solar powered agricultural machinery faces distinct limitations due to fluctuating weather patterns, which elevates unexpected harvester energy consumption during intensive processing cycles.
  • Operating advanced multi-arm robotic pickers demands adherence to a strict robotic maintenance schedule, significantly increasing overhead costs for rural agricultural enterprises. Furthermore, as organizations attempt to align with an evolving agricultural compliance standard and an intricate crop tracing standard, calibration complexities multiply.
  • Unplanned system failures involving stereoscopic camera integration reduce overall collection efficiency by 14% compared to fully optimized conventional methods. These technical vulnerabilities exacerbate industry concerns regarding unmanaged agricultural labor displacement, forcing businesses to allocate excess capital toward continuous system diagnostics and slowing broader market penetration.

Exclusive Technavio Analysis on Customer Landscape

The crop harvesting robots market forecasting report includes the adoption lifecycle of the market, covering from the innovator’s stage to the laggard’s stage. It focuses on adoption rates in different regions based on penetration. Furthermore, the crop harvesting robots market report also includes key purchase criteria and drivers of price sensitivity to help companies evaluate and develop their market growth analysis strategies.
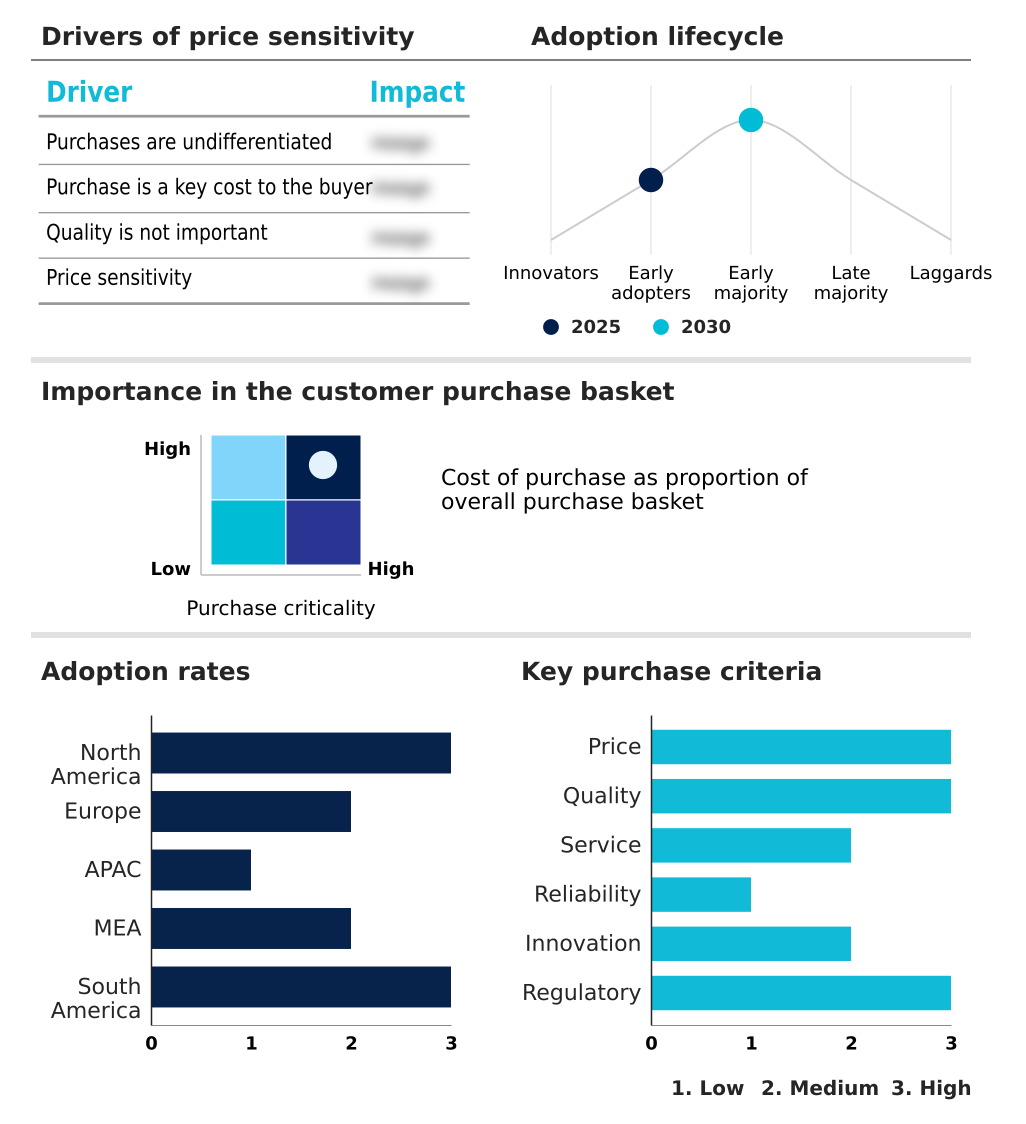
Customer Landscape of Crop Harvesting Robots Industry

Competitive Landscape

Companies are implementing various strategies, such as strategic alliances, crop harvesting robots market forecast, partnerships, mergers and acquisitions, geographical expansion, and product/service launches, to enhance their presence in the industry.

Advanced Farms Technologies Inc - The entity delivers precision robotic harvesting platforms featuring advanced machine vision and autonomous navigation mechanisms that optimize crop collection efficiency and mitigate agricultural labor dependencies across commercial farming environments.

The industry research and growth report includes detailed analyses of the competitive landscape of the market and information about key companies, including:

  • Advanced Farms Technologies Inc
  • AGCO Corp.
  • Agrobot
  • Boston Dynamics Inc.
  • CNH Industrial N.V.
  • Deere and Co.
  • Dogtooth Technologies Ltd.
  • FFRobotics
  • Fieldwork Robotics Ltd
  • Four Growers Inc.
  • Harvest CROO Robotics
  • Kubota Corp.
  • MetoMotion
  • Octiva Technologies
  • Tevel Aerobotics Technologies
  • Yanmar Holdings Co. Ltd.

Qualitative and quantitative analysis of companies has been conducted to help clients understand the wider business environment as well as the strengths and weaknesses of key industry players. Data is qualitatively analyzed to categorize companies as pure play, category-focused, industry-focused, and diversified; it is quantitatively analyzed to categorize companies as dominant, leading, strong, tentative, and weak.

Recent Development and News in Crop harvesting robots market

  • In the Agricultural and Farm Machinery industry, the accelerated integration of smart agricultural implement architectures has driven a 25% improvement in dynamic route optimization, directly increasing Crop Harvesting Robots demand among broadacre farming mechanization operations seeking higher field throughput.
  • Stringent crop tracing standard mandates have pushed agricultural compliance standard requirements upward, forcing a 40% shift toward scalable agricultural automation tools that elevate the need for precision Crop Harvesting Robots capable of real time data processing.
  • The rapid expansion of the indoor farming cluster has reshaped agricultural resource efficiency benchmarks by 30%, which significantly stimulates the deployment of Crop Harvesting Robots tailored for high value horticultural crop environments.
  • Advancements in battery storage system technologies have extended robotic hardware durability and prolonged harvester energy consumption cycles by 20%, amplifying the commercial viability and adoption rate of fully autonomous Crop Harvesting Robots in remote field locations.

Dive into Technavio’s robust research methodology, blending expert interviews, extensive data synthesis, and validated models for unparalleled Crop Harvesting Robots Market insights. See full methodology.

Market Scope
Page number 289
Base year 2025
Historic period 2020-2024
Forecast period 2026-2030
Growth momentum & CAGR Accelerate at a CAGR of 25.2%
Market growth 2026-2030 USD 4364431.7 thousand
Market structure Fragmented
YoY growth 2025-2026(%) 24.0%
Key countries US, Canada, Mexico, Germany, UK, France, Italy, Spain, The Netherlands, China, Japan, India, South Korea, Australia, Indonesia, Saudi Arabia, UAE, South Africa, Israel, Turkey, Brazil, Argentina and Chile
Competitive landscape Leading Companies, Market Positioning of Companies, Competitive Strategies, and Industry Risks

Request Free Sample

Research Analyst Overview

  • The rapid deployment of intelligent harvesting platforms is fundamentally restructuring corporate agricultural strategy, forcing executives to rethink equipment budgeting and operational compliance. Integrating sensor-based crop detection allows management to precisely align harvesting schedules with market demand, minimizing post-collection spoilage. This shift relies heavily on deep learning image recognition to differentiate mature produce from raw foliage in real time.
  • Organizations implementing automated farm mapping report a 24% improvement in field navigation efficiency compared to manual routing methods. Using advanced yield optimization analytics provides decision-makers with the critical data necessary to adjust supply chain volumes dynamically. The installation of multi-arm robotic pickers accelerates collection speeds across high-density orchards, directly offsetting concerns regarding agricultural labor displacement.
  • Incorporating stereoscopic camera integration ensures depth perception is maintained, which significantly reduces accidental cutting errors during the extraction phase. These technological advancements ensure that commercial farming operations remain profitable and highly responsive to shifting environmental conditions, cementing robotics as a cornerstone of modern agricultural product strategy.

What are the Key Data Covered in this Crop Harvesting Robots Market Research and Growth Report?

  • What is the expected growth of the Crop Harvesting Robots Market between 2026 and 2030?

    • USD 4.36 billion, at a CAGR of 25.2%

  • What segmentation does the market report cover?

    • The report is segmented by Type (Semi-autonomous robots, and Fully-autonomous robots), Product (Fruit and vegetable harvesting robots, and Grain harvesting robots), Product Type (Hardware, Software, and Service) and Geography (North America, Europe, APAC, Middle East and Africa, South America)

  • Which regions are analyzed in the report?

    • North America, Europe, APAC, Middle East and Africa and South America

  • What are the key growth drivers and market challenges?

    • Increasing focus on farm mechanization, High maintenance cost of crop harvesting robots

  • Who are the major players in the Crop Harvesting Robots Market?

    • Advanced Farms Technologies Inc, AGCO Corp., Agrobot, Boston Dynamics Inc., CNH Industrial N.V., Deere and Co., Dogtooth Technologies Ltd., FFRobotics, Fieldwork Robotics Ltd, Four Growers Inc., Harvest CROO Robotics, Kubota Corp., MetoMotion, Octiva Technologies, Tevel Aerobotics Technologies and Yanmar Holdings Co. Ltd.

Market Research Insights

  • The continuous adoption of automated agricultural machinery fundamentally optimizes field productivity while mitigating labor constraints. Implementing IoT farm integration has enhanced operational visibility, leading to a 28% improvement in supply chain responsiveness compared to disconnected operations. Cloud-based yield tracking platforms provide managers with precise output data, driving a 15% reduction in resource allocation discrepancies.
  • Facilities utilizing automated vineyard management protocols demonstrate a 30% increase in harvest efficiency over traditional manual labor techniques. This shift accelerates agricultural workflow automation, supporting a broader transition toward every sustainable farming practice. Businesses utilizing these integrated robotic frameworks consistently achieve superior operational consistency and strict alignment with evolving environmental regulations.

We can help! Our analysts can customize this crop harvesting robots market research report to meet your requirements.

Get in touch

1. Executive Summary

1.1 Market overview

Executive Summary - Chart on Market Overview
Executive Summary - Data Table on Market Overview
Executive Summary - Chart on Global Market Characteristics
Executive Summary - Chart on Market by Geography
Executive Summary - Chart on Market Segmentation by Type
Executive Summary - Chart on Market Segmentation by Product
Executive Summary - Chart on Market Segmentation by Product Type
Executive Summary - Chart on Incremental Growth
Executive Summary - Data Table on Incremental Growth
Executive Summary - Chart on Company Market Positioning

2. Technavio Analysis

2.1 Analysis of price sensitivity, lifecycle, customer purchase basket, adoption rates, and purchase criteria

2.2 Criticality of inputs and Factors of differentiation

Chart on Overview on criticality of inputs and factors of differentiation

2.3 Factors of disruption

Chart on Overview on factors of disruption

2.4 Impact of drivers and challenges

Chart on Impact of drivers and challenges in 2025 and 2030

3. Market Landscape

3.1 Market ecosystem

Chart on Parent Market
Data Table on - Parent Market

3.2 Market characteristics

Chart on Market characteristics analysis

3.3 Value chain analysis

Chart on Value chain analysis

4. Market Sizing

4.1 Market definition

Data Table on Offerings of companies included in the market definition

4.2 Market segment analysis

Market segments

4.3 Market size 2025

4.4 Market outlook: Forecast for 2025-2030

Chart on Global - Market size and forecast 2025-2030 ($ thousand)
Data Table on Global - Market size and forecast 2025-2030 ($ thousand)
Chart on Global Market: Year-over-year growth 2025-2030 (%)
Data Table on Global Market: Year-over-year growth 2025-2030 (%)

5. Historic Market Size

5.1 Global Crop Harvesting Robots Market 2020 - 2024

Historic Market Size - Data Table on Global Crop Harvesting Robots Market 2020 - 2024 ($ thousand)

5.2 Type segment analysis 2020 - 2024

Historic Market Size - Type Segment 2020 - 2024 ($ thousand)

5.3 Product segment analysis 2020 - 2024

Historic Market Size - Product Segment 2020 - 2024 ($ thousand)

5.4 Product Type segment analysis 2020 - 2024

Historic Market Size - Product Type Segment 2020 - 2024 ($ thousand)

5.5 Geography segment analysis 2020 - 2024

Historic Market Size - Geography Segment 2020 - 2024 ($ thousand)

5.6 Country segment analysis 2020 - 2024

Historic Market Size - Country Segment 2020 - 2024 ($ thousand)

6. Qualitative Analysis

6.1 Impact of AI on Global Crop Harvesting Robots Market

6.2 Impact of Geopolitical Conflicts on Global Crop Harvesting Robots Market

7. Five Forces Analysis

7.1 Five forces summary

Five forces analysis - Comparison between 2025 and 2030

7.2 Bargaining power of buyers

Bargaining power of buyers - Impact of key factors 2025 and 2030

7.3 Bargaining power of suppliers

Bargaining power of suppliers - Impact of key factors in 2025 and 2030

7.4 Threat of new entrants

Threat of new entrants - Impact of key factors in 2025 and 2030

7.5 Threat of substitutes

Threat of substitutes - Impact of key factors in 2025 and 2030

7.6 Threat of rivalry

Threat of rivalry - Impact of key factors in 2025 and 2030

7.7 Market condition

Chart on Market condition - Five forces 2025 and 2030

8. Market Segmentation by Type

8.1 Market segments

Chart on Type - Market share 2025-2030 (%)
Data Table on Type - Market share 2025-2030 (%)

8.2 Comparison by Type

Chart on Comparison by Type
Data Table on Comparison by Type

8.3 Semi-autonomous robots - Market size and forecast 2025-2030

Chart on Semi-autonomous robots - Market size and forecast 2025-2030 ($ thousand)
Data Table on Semi-autonomous robots - Market size and forecast 2025-2030 ($ thousand)
Chart on Semi-autonomous robots - Year-over-year growth 2025-2030 (%)
Data Table on Semi-autonomous robots - Year-over-year growth 2025-2030 (%)

8.4 Fully-autonomous robots - Market size and forecast 2025-2030

Chart on Fully-autonomous robots - Market size and forecast 2025-2030 ($ thousand)
Data Table on Fully-autonomous robots - Market size and forecast 2025-2030 ($ thousand)
Chart on Fully-autonomous robots - Year-over-year growth 2025-2030 (%)
Data Table on Fully-autonomous robots - Year-over-year growth 2025-2030 (%)

8.5 Market opportunity by Type

Market opportunity by Type ($ thousand)
Data Table on Market opportunity by Type ($ thousand)

9. Market Segmentation by Product

9.1 Market segments

Chart on Product - Market share 2025-2030 (%)
Data Table on Product - Market share 2025-2030 (%)

9.2 Comparison by Product

Chart on Comparison by Product
Data Table on Comparison by Product

9.3 Fruit and vegetable harvesting robots - Market size and forecast 2025-2030

Chart on Fruit and vegetable harvesting robots - Market size and forecast 2025-2030 ($ thousand)
Data Table on Fruit and vegetable harvesting robots - Market size and forecast 2025-2030 ($ thousand)
Chart on Fruit and vegetable harvesting robots - Year-over-year growth 2025-2030 (%)
Data Table on Fruit and vegetable harvesting robots - Year-over-year growth 2025-2030 (%)

9.4 Grain harvesting robots - Market size and forecast 2025-2030

Chart on Grain harvesting robots - Market size and forecast 2025-2030 ($ thousand)
Data Table on Grain harvesting robots - Market size and forecast 2025-2030 ($ thousand)
Chart on Grain harvesting robots - Year-over-year growth 2025-2030 (%)
Data Table on Grain harvesting robots - Year-over-year growth 2025-2030 (%)

9.5 Market opportunity by Product

Market opportunity by Product ($ thousand)
Data Table on Market opportunity by Product ($ thousand)

10. Market Segmentation by Product Type

10.1 Market segments

Chart on Product Type - Market share 2025-2030 (%)
Data Table on Product Type - Market share 2025-2030 (%)

10.2 Comparison by Product Type

Chart on Comparison by Product Type
Data Table on Comparison by Product Type

10.3 Hardware - Market size and forecast 2025-2030

Chart on Hardware - Market size and forecast 2025-2030 ($ thousand)
Data Table on Hardware - Market size and forecast 2025-2030 ($ thousand)
Chart on Hardware - Year-over-year growth 2025-2030 (%)
Data Table on Hardware - Year-over-year growth 2025-2030 (%)

10.4 Software - Market size and forecast 2025-2030

Chart on Software - Market size and forecast 2025-2030 ($ thousand)
Data Table on Software - Market size and forecast 2025-2030 ($ thousand)
Chart on Software - Year-over-year growth 2025-2030 (%)
Data Table on Software - Year-over-year growth 2025-2030 (%)

10.5 Service - Market size and forecast 2025-2030

Chart on Service - Market size and forecast 2025-2030 ($ thousand)
Data Table on Service - Market size and forecast 2025-2030 ($ thousand)
Chart on Service - Year-over-year growth 2025-2030 (%)
Data Table on Service - Year-over-year growth 2025-2030 (%)

10.6 Market opportunity by Product Type

Market opportunity by Product Type ($ thousand)
Data Table on Market opportunity by Product Type ($ thousand)

11. Customer Landscape

11.1 Customer landscape overview

Analysis of price sensitivity, lifecycle, customer purchase basket, adoption rates, and purchase criteria

12. Geographic Landscape

12.1 Geographic segmentation

Chart on Market share by geography 2025-2030 (%)
Data Table on Market share by geography 2025-2030 (%)

12.2 Geographic comparison

Chart on Geographic comparison
Data Table on Geographic comparison

12.3 North America - Market size and forecast 2025-2030

Chart on North America - Market size and forecast 2025-2030 ($ thousand)
Data Table on North America - Market size and forecast 2025-2030 ($ thousand)
Chart on North America - Year-over-year growth 2025-2030 (%)
Data Table on North America - Year-over-year growth 2025-2030 (%)
Chart on Regional Comparison - North America
Data Table on Regional Comparison - North America

12.3.1 US - Market size and forecast 2025-2030

Chart on US - Market size and forecast 2025-2030 ($ thousand)
Data Table on US - Market size and forecast 2025-2030 ($ thousand)
Chart on US - Year-over-year growth 2025-2030 (%)
Data Table on US - Year-over-year growth 2025-2030 (%)

12.3.2 Canada - Market size and forecast 2025-2030

Chart on Canada - Market size and forecast 2025-2030 ($ thousand)
Data Table on Canada - Market size and forecast 2025-2030 ($ thousand)
Chart on Canada - Year-over-year growth 2025-2030 (%)
Data Table on Canada - Year-over-year growth 2025-2030 (%)

12.3.3 Mexico - Market size and forecast 2025-2030

Chart on Mexico - Market size and forecast 2025-2030 ($ thousand)
Data Table on Mexico - Market size and forecast 2025-2030 ($ thousand)
Chart on Mexico - Year-over-year growth 2025-2030 (%)
Data Table on Mexico - Year-over-year growth 2025-2030 (%)

12.4 Europe - Market size and forecast 2025-2030

Chart on Europe - Market size and forecast 2025-2030 ($ thousand)
Data Table on Europe - Market size and forecast 2025-2030 ($ thousand)
Chart on Europe - Year-over-year growth 2025-2030 (%)
Data Table on Europe - Year-over-year growth 2025-2030 (%)
Chart on Regional Comparison - Europe
Data Table on Regional Comparison - Europe

12.4.1 Germany - Market size and forecast 2025-2030

Chart on Germany - Market size and forecast 2025-2030 ($ thousand)
Data Table on Germany - Market size and forecast 2025-2030 ($ thousand)
Chart on Germany - Year-over-year growth 2025-2030 (%)
Data Table on Germany - Year-over-year growth 2025-2030 (%)

12.4.2 UK - Market size and forecast 2025-2030

Chart on UK - Market size and forecast 2025-2030 ($ thousand)
Data Table on UK - Market size and forecast 2025-2030 ($ thousand)
Chart on UK - Year-over-year growth 2025-2030 (%)
Data Table on UK - Year-over-year growth 2025-2030 (%)

12.4.3 France - Market size and forecast 2025-2030

Chart on France - Market size and forecast 2025-2030 ($ thousand)
Data Table on France - Market size and forecast 2025-2030 ($ thousand)
Chart on France - Year-over-year growth 2025-2030 (%)
Data Table on France - Year-over-year growth 2025-2030 (%)

12.4.4 Italy - Market size and forecast 2025-2030

Chart on Italy - Market size and forecast 2025-2030 ($ thousand)
Data Table on Italy - Market size and forecast 2025-2030 ($ thousand)
Chart on Italy - Year-over-year growth 2025-2030 (%)
Data Table on Italy - Year-over-year growth 2025-2030 (%)

12.4.5 Spain - Market size and forecast 2025-2030

Chart on Spain - Market size and forecast 2025-2030 ($ thousand)
Data Table on Spain - Market size and forecast 2025-2030 ($ thousand)
Chart on Spain - Year-over-year growth 2025-2030 (%)
Data Table on Spain - Year-over-year growth 2025-2030 (%)

12.4.6 The Netherlands - Market size and forecast 2025-2030

Chart on The Netherlands - Market size and forecast 2025-2030 ($ thousand)
Data Table on The Netherlands - Market size and forecast 2025-2030 ($ thousand)
Chart on The Netherlands - Year-over-year growth 2025-2030 (%)
Data Table on The Netherlands - Year-over-year growth 2025-2030 (%)

12.5 APAC - Market size and forecast 2025-2030

Chart on APAC - Market size and forecast 2025-2030 ($ thousand)
Data Table on APAC - Market size and forecast 2025-2030 ($ thousand)
Chart on APAC - Year-over-year growth 2025-2030 (%)
Data Table on APAC - Year-over-year growth 2025-2030 (%)
Chart on Regional Comparison - APAC
Data Table on Regional Comparison - APAC

12.5.1 China - Market size and forecast 2025-2030

Chart on China - Market size and forecast 2025-2030 ($ thousand)
Data Table on China - Market size and forecast 2025-2030 ($ thousand)
Chart on China - Year-over-year growth 2025-2030 (%)
Data Table on China - Year-over-year growth 2025-2030 (%)

12.5.2 Japan - Market size and forecast 2025-2030

Chart on Japan - Market size and forecast 2025-2030 ($ thousand)
Data Table on Japan - Market size and forecast 2025-2030 ($ thousand)
Chart on Japan - Year-over-year growth 2025-2030 (%)
Data Table on Japan - Year-over-year growth 2025-2030 (%)

12.5.3 India - Market size and forecast 2025-2030

Chart on India - Market size and forecast 2025-2030 ($ thousand)
Data Table on India - Market size and forecast 2025-2030 ($ thousand)
Chart on India - Year-over-year growth 2025-2030 (%)
Data Table on India - Year-over-year growth 2025-2030 (%)

12.5.4 South Korea - Market size and forecast 2025-2030

Chart on South Korea - Market size and forecast 2025-2030 ($ thousand)
Data Table on South Korea - Market size and forecast 2025-2030 ($ thousand)
Chart on South Korea - Year-over-year growth 2025-2030 (%)
Data Table on South Korea - Year-over-year growth 2025-2030 (%)

12.5.5 Australia - Market size and forecast 2025-2030

Chart on Australia - Market size and forecast 2025-2030 ($ thousand)
Data Table on Australia - Market size and forecast 2025-2030 ($ thousand)
Chart on Australia - Year-over-year growth 2025-2030 (%)
Data Table on Australia - Year-over-year growth 2025-2030 (%)

12.5.6 Indonesia - Market size and forecast 2025-2030

Chart on Indonesia - Market size and forecast 2025-2030 ($ thousand)
Data Table on Indonesia - Market size and forecast 2025-2030 ($ thousand)
Chart on Indonesia - Year-over-year growth 2025-2030 (%)
Data Table on Indonesia - Year-over-year growth 2025-2030 (%)

12.6 Middle East and Africa - Market size and forecast 2025-2030

Chart on Middle East and Africa - Market size and forecast 2025-2030 ($ thousand)
Data Table on Middle East and Africa - Market size and forecast 2025-2030 ($ thousand)
Chart on Middle East and Africa - Year-over-year growth 2025-2030 (%)
Data Table on Middle East and Africa - Year-over-year growth 2025-2030 (%)
Chart on Regional Comparison - Middle East and Africa
Data Table on Regional Comparison - Middle East and Africa

12.6.1 Saudi Arabia - Market size and forecast 2025-2030

Chart on Saudi Arabia - Market size and forecast 2025-2030 ($ thousand)
Data Table on Saudi Arabia - Market size and forecast 2025-2030 ($ thousand)
Chart on Saudi Arabia - Year-over-year growth 2025-2030 (%)
Data Table on Saudi Arabia - Year-over-year growth 2025-2030 (%)

12.6.2 UAE - Market size and forecast 2025-2030

Chart on UAE - Market size and forecast 2025-2030 ($ thousand)
Data Table on UAE - Market size and forecast 2025-2030 ($ thousand)
Chart on UAE - Year-over-year growth 2025-2030 (%)
Data Table on UAE - Year-over-year growth 2025-2030 (%)

12.6.3 South Africa - Market size and forecast 2025-2030

Chart on South Africa - Market size and forecast 2025-2030 ($ thousand)
Data Table on South Africa - Market size and forecast 2025-2030 ($ thousand)
Chart on South Africa - Year-over-year growth 2025-2030 (%)
Data Table on South Africa - Year-over-year growth 2025-2030 (%)

12.6.4 Israel - Market size and forecast 2025-2030

Chart on Israel - Market size and forecast 2025-2030 ($ thousand)
Data Table on Israel - Market size and forecast 2025-2030 ($ thousand)
Chart on Israel - Year-over-year growth 2025-2030 (%)
Data Table on Israel - Year-over-year growth 2025-2030 (%)

12.6.5 Turkey - Market size and forecast 2025-2030

Chart on Turkey - Market size and forecast 2025-2030 ($ thousand)
Data Table on Turkey - Market size and forecast 2025-2030 ($ thousand)
Chart on Turkey - Year-over-year growth 2025-2030 (%)
Data Table on Turkey - Year-over-year growth 2025-2030 (%)

12.7 South America - Market size and forecast 2025-2030

Chart on South America - Market size and forecast 2025-2030 ($ thousand)
Data Table on South America - Market size and forecast 2025-2030 ($ thousand)
Chart on South America - Year-over-year growth 2025-2030 (%)
Data Table on South America - Year-over-year growth 2025-2030 (%)
Chart on Regional Comparison - South America
Data Table on Regional Comparison - South America

12.7.1 Brazil - Market size and forecast 2025-2030

Chart on Brazil - Market size and forecast 2025-2030 ($ thousand)
Data Table on Brazil - Market size and forecast 2025-2030 ($ thousand)
Chart on Brazil - Year-over-year growth 2025-2030 (%)
Data Table on Brazil - Year-over-year growth 2025-2030 (%)

12.7.2 Argentina - Market size and forecast 2025-2030

Chart on Argentina - Market size and forecast 2025-2030 ($ thousand)
Data Table on Argentina - Market size and forecast 2025-2030 ($ thousand)
Chart on Argentina - Year-over-year growth 2025-2030 (%)
Data Table on Argentina - Year-over-year growth 2025-2030 (%)

12.7.3 Chile - Market size and forecast 2025-2030

Chart on Chile - Market size and forecast 2025-2030 ($ thousand)
Data Table on Chile - Market size and forecast 2025-2030 ($ thousand)
Chart on Chile - Year-over-year growth 2025-2030 (%)
Data Table on Chile - Year-over-year growth 2025-2030 (%)

12.8 Market opportunity by geography

Market opportunity by geography ($ thousand)
Data Tables on Market opportunity by geography ($ thousand)

13. Drivers, Challenges, and Opportunity

13.1 Market drivers

Increasing focus on farm mechanization
Shortage of workers on farms
Rising need for compliance with industrial standards

13.2 Market challenges

High maintenance cost of crop harvesting robots
Operational issues of crop harvesting robots
Lack of awareness and infrastructure in developing countries

13.3 Impact of drivers and challenges

Impact of drivers and challenges in 2025 and 2030

13.4 Market opportunities

Expansion of greenhouse farms is augmenting market prosperity
Growing popularity of solar-powered crop harvesting robots
Rise in venture funding is expediting market growth

14. Competitive Landscape

14.1 Overview

14.2

Overview on criticality of inputs and factors of differentiation

14.3 Landscape disruption

Overview on factors of disruption

14.4 Industry risks

Impact of key risks on business

15. Competitive Analysis

15.1 Companies profiled

Companies covered

15.2 Company ranking index

15.3 Market positioning of companies

Matrix on companies position and classification

15.4 Advanced Farms Technologies Inc

Advanced Farms Technologies Inc - Overview
Advanced Farms Technologies Inc - Product / Service
Advanced Farms Technologies Inc - Key offerings
SWOT

15.5 AGCO Corp.

AGCO Corp. - Overview
AGCO Corp. - Product / Service
AGCO Corp. - Key offerings
SWOT

15.6 Agrobot

Agrobot - Overview
Agrobot - Product / Service
Agrobot - Key offerings
SWOT

15.7 Boston Dynamics Inc.

Boston Dynamics Inc. - Overview
Boston Dynamics Inc. - Product / Service
Boston Dynamics Inc. - Key offerings
SWOT

15.8 CNH Industrial N.V.

CNH Industrial N.V. - Overview
CNH Industrial N.V. - Business segments
CNH Industrial N.V. - Key offerings
CNH Industrial N.V. - Segment focus
SWOT

15.9 Deere and Co.

Deere and Co. - Overview
Deere and Co. - Business segments
Deere and Co. - Key offerings
Deere and Co. - Segment focus
SWOT

15.10 Dogtooth Technologies Ltd.

Dogtooth Technologies Ltd. - Overview
Dogtooth Technologies Ltd. - Product / Service
Dogtooth Technologies Ltd. - Key offerings
SWOT

15.11 FFRobotics

FFRobotics - Overview
FFRobotics - Product / Service
FFRobotics - Key offerings
SWOT

15.12 Fieldwork Robotics Ltd

Fieldwork Robotics Ltd - Overview
Fieldwork Robotics Ltd - Product / Service
Fieldwork Robotics Ltd - Key offerings
SWOT

15.13 Four Growers Inc.

Four Growers Inc. - Overview
Four Growers Inc. - Product / Service
Four Growers Inc. - Key offerings
SWOT

15.14 Harvest CROO Robotics

Harvest CROO Robotics - Overview
Harvest CROO Robotics - Product / Service
Harvest CROO Robotics - Key offerings
SWOT

15.15 Kubota Corp.

Kubota Corp. - Overview
Kubota Corp. - Business segments
Kubota Corp. - Key offerings
Kubota Corp. - Segment focus
SWOT

15.16 MetoMotion

MetoMotion - Overview
MetoMotion - Product / Service
MetoMotion - Key offerings
SWOT

15.17 Octiva Technologies

Octiva Technologies - Overview
Octiva Technologies - Product / Service
Octiva Technologies - Key offerings
SWOT

15.18 Yanmar Holdings Co. Ltd.

Yanmar Holdings Co. Ltd. - Overview
Yanmar Holdings Co. Ltd. - Product / Service
Yanmar Holdings Co. Ltd. - Key offerings
SWOT

16. Appendix

16.1 Scope of the report

Market definition
Objectives
Notes and caveats

16.2 Inclusions and exclusions checklist

Inclusions checklist
Exclusions checklist

16.3 Currency conversion rates for US$

16.4 Research methodology

16.5 Data procurement

Information sources

16.6 Data validation

16.7 Validation techniques employed for market sizing

16.8 Data synthesis

16.9 360 degree market analysis

16.10 List of abbreviations

Research Methodology

Technavio presents a detailed picture of the market by way of study, synthesis, and summation of data from multiple sources. The analysts have presented the various facets of the market with a particular focus on identifying the key industry influencers. The data thus presented is comprehensive, reliable, and the result of extensive research, both primary and secondary.

INFORMATION SOURCES

Primary sources

  • Manufacturers and suppliers
  • Channel partners
  • Industry experts
  • Strategic decision makers

Secondary sources

  • Industry journals and periodicals
  • Government data
  • Financial reports of key industry players
  • Historical data
  • Press releases

DATA ANALYSIS

Data Synthesis

  • Collation of data
  • Estimation of key figures
  • Analysis of derived insights

Data Validation

  • Triangulation with data models
  • Reference against proprietary databases
  • Corroboration with industry experts

REPORT WRITING

Qualitative

  • Market drivers
  • Market challenges
  • Market trends
  • Five forces analysis

Quantitative

  • Market size and forecast
  • Market segmentation
  • Geographical insights
  • Competitive landscape

Interested in this report?

Get your sample now to see our research methodology and insights!

Download Now

Frequently Asked Questions

Crop Harvesting Robots market growth will increase by USD 4364431.7 thousand thousand during 2026-2030.

The Crop Harvesting Robots market is expected to grow at a CAGR of 25.2% during 2026-2030.

Crop Harvesting Robots market is segmented by Type (Semi-autonomous robots, Fully-autonomous robots) Product (Fruit and vegetable harvesting robots, Grain harvesting robots) Product type (Hardware, Software, Service)

Advanced Farms Technologies Inc, AGCO Corp., Agrobot, Boston Dynamics Inc., CNH Industrial N.V., Deere and Co., Dogtooth Technologies Ltd., FFRobotics, Fieldwork Robotics Ltd, Four Growers Inc., Harvest CROO Robotics, Kubota Corp., MetoMotion, Octiva Technologies, Tevel Aerobotics Technologies, Yanmar Holdings Co. Ltd. are a few of the key vendors in the Crop Harvesting Robots market.

North America will register the highest growth rate of 40.3% among the other regions. Therefore, the Crop Harvesting Robots market in North America is expected to garner significant business opportunities for the vendors during the forecast period.

US, Canada, Mexico, Germany, UK, France, Italy, Spain, The Netherlands, China, Japan, India, South Korea, Australia, Indonesia, Saudi Arabia, UAE, South Africa, Israel, Turkey, Brazil, Argentina, Chile

  • Increasing focus on farm mechanization is the driving factor this market.

The Crop Harvesting Robots market vendors should focus on grabbing business opportunities from the Type segment as it accounted for the largest market share in the base year.
RIA - Research AI Assistant
Ask RIA
