
Customer Analytics Applications Market Size 2024-2028
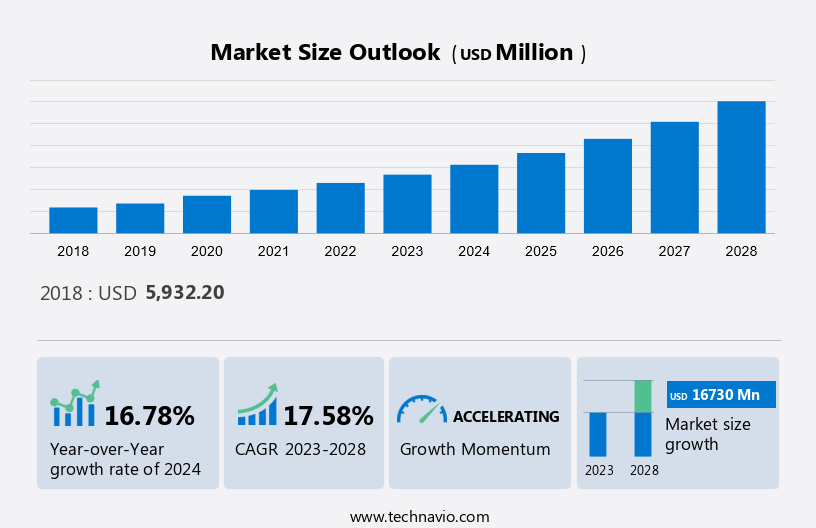
The customer analytics applications market size is estimated to grow by USD 16.73 billion at a CAGR of 17.58% between 2023 and 2028. The growth of the market depends on several factors, including the increasing number of social media users, the growing need for improved customer satisfaction, and an increase in the adoption of customer analytics by SMEs. Customer analytics application refers to a software or system that analyzes customer data such as behavioral, demographic, and personal information to gain insights into their behavior, preferences, and needs. It uses various techniques such as data mining, predictive modeling, and statistical analysis to gather information and make informed decisions in marketing, sales, product development, and overall customer management. The goal of a customer analytics application is to enhance customer understanding and improve business strategies by allowing companies to make data-driven decisions and provide personalized experiences to their customers.
What will be the Size of the Market During the Forecast Period?
To learn more about this report, View Report Sample
Market Dynamics
Key Market Driver
An increase in the adoption of customer analytics by SMEs is notably driving market growth. Expanding the efficiency and performance of business operations is critical to achieving the desired set of goals of an organization. Businesses with a customer-centric approach deal with massive amounts of customer data, which is stored, managed, and processed in real-time. SMEs generate numerous forms of customer data related to customer demographics and sales, marketing campaigns, websites, and conversations. Consequently, these businesses must scrutinize all this customer-related data to achieve a competitive edge in the market. SMEs are majorly using these as they enable better forecasting, resource management, and streamlining of data under one platform, lower operational costs, improve decision-making, and expand sales.
In addition, the increase in customer data, along with the companies' need to automate customer data processing, is leading to the increased adoption by SMEs. Hence, customer analytics is being executed across SMEs for better management of their business operations via a centralized management system with enhanced collaboration, productivity, simplified compliance, and risk management. Such factors are the significant driving factors driving the growth of the global market during the forecast period.
Major Market Trends
Advancements in technology are an emerging trend shaping the market growth. AI and ML technologies have revolutionized the way businesses understand and analyze customer data, allowing them to make more informed decisions and deliver customized experiences. Also, AI and ML have played a critical role in fake detection and prevention in the customer analytics market. Algorithms can identify unusual activities that may indicate fraud by analyzing transactional data and behavioral patterns. This allows businesses to secure themselves and their customers from potential financial losses.
Additionally, AI and ML have enhanced customer segmentation capabilities. Businesses can group customers based on their similarities by using clustering algorithms, allowing them to create targeted marketing campaigns for specific segments. This enables enterprises to personalize their messages and offers, resulting in higher customer engagement and conversion rates. These factors are anticipated to fuel the market growth and trends during the forecast period.
Significant Market Restrain
Data integration issues are a significant challenge hindering market growth. To analyze customer data generated from various types of systems, enterprises use these. The expansion in the use of smart devices and Internet penetration is creating huge amounts of data, which is leading to cluttered data types. Also, companies store data on on-premises infrastructure, on the cloud, or using a combination of both, relying on the sensitivity of the data. These IT architectures, due to differences in protocols, create complexities while migrating the in-house data from on-premises infrastructure to cloud-based software programs, as data can be stored in various formats and result in interoperability issues.
However, addressing such problems involves major application re-programming and integration. It also augments the intricacy of applications and advances the time consumed in solving these issues. Consequently, the problems associated with data integration across numerous architectures can be a challenge for the implementation. Such factors may hinder the market growth during the forecast period.
Market Segmentation
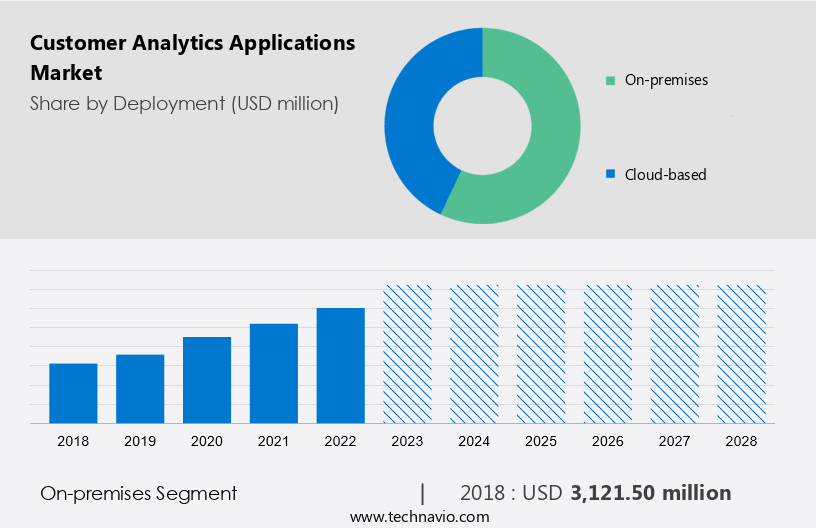
By Deployment Segment
The market share growth by the on-premises segment will be significant during the forecast period. The customer analytics applications market is witnessing notable advancements with the integration of Artificial Intelligence (AI) and Machine Learning (ML) technologies. Businesses are leveraging these technologies to automate processes and gain valuable customer insights. While Cloud deployment mode is gaining popularity due to its flexibility and scalability, the on-premises segment continues to grow. This approach offers advantages such as increased data security, greater control over analytics processes, and the ability to customize applications to specific business needs.
Get a glance at the market contribution of various segments View Free PDF Sample
The on-premises segment was the largest and was valued at USD 3.12 billion in 2018. Retailers, for instance, can utilize on-premises customer analytics applications for their loyalty programs. Real-time data processing enables them to gain insights into customer purchasing behavior, informing decisions on pricing, promotions, and product offerings. Key players in the customer analytics applications market include Mixpanel, Manthan System, Second Measure, Absolute Data, Neustar, NICE Systems, Segment, Calibremind, Clarity Insight, Amperity, Tableau, and more. These trailblazers offer various solutions, including commerce analytics, social media analytics, customer data platforms, and e-commerce analytics. Moreover, the application of customer analytics extends to industries like banks and telecoms. Data mining, semantic analysis, neural networks, multivariate statistics, and other analytic models are employed to process large volumes of data and gain valuable insights. Processing apps and computing capacity are essential components, that enable organizations to make informed decisions and optimize customer experiences.
By End-user Segment
The market share growth by the retail segment will be significant during the forecast period. The introduction in the retail sector is growing owing to the growth and proliferation of retail and e-commerce companies worldwide. To analyze customer data better, develop customer relations, and enhance their performance in the marketplace, retail companies are adopting these. The rising competition among retail companies is propelling the demand to shift their investment strategies. Retail companies generally interpret customer data to develop customer purchase patterns predict sales, smart inventory choices, competitive pricing, personalized advertisements, customer-specific offers, and store-specific product offerings. In addition, to provide an intelligent shopping experience to their customers based on their previous shopping history, retail companies are using these. Therefore, the rising use in the retail sector will fuel the growth of the global market during the forecast period.
Regional Overview
For more insights on the market share of various regions Download PDF Sample now!
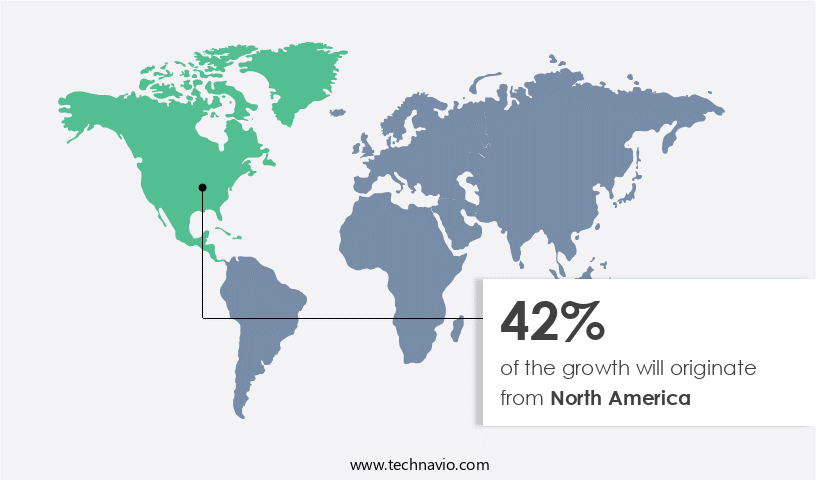
North America is estimated to contribute 42% to the growth of the global market during the forecast period. Technavio's analysts have elaborately explained the regional trends and drivers that shape the market during the forecast period. The region contributes to the highest share of the overall global market. The demand in the region is majorly due to the advancement in the adoption of public cloud services and the existence of major companies in the market. Also, the growth of SMEs is another primary reason for the rising demand in the region.
Additionally, North America was the leader in the number of smart factory initiatives of all the manufacturers that are operational in 2021. Such developments will lead to a boost in the rate of data generation, thereby propelling the requirement to analyze the data. Such factors will fuel the demand and adoption and the growth of the market in the region during the forecast period.
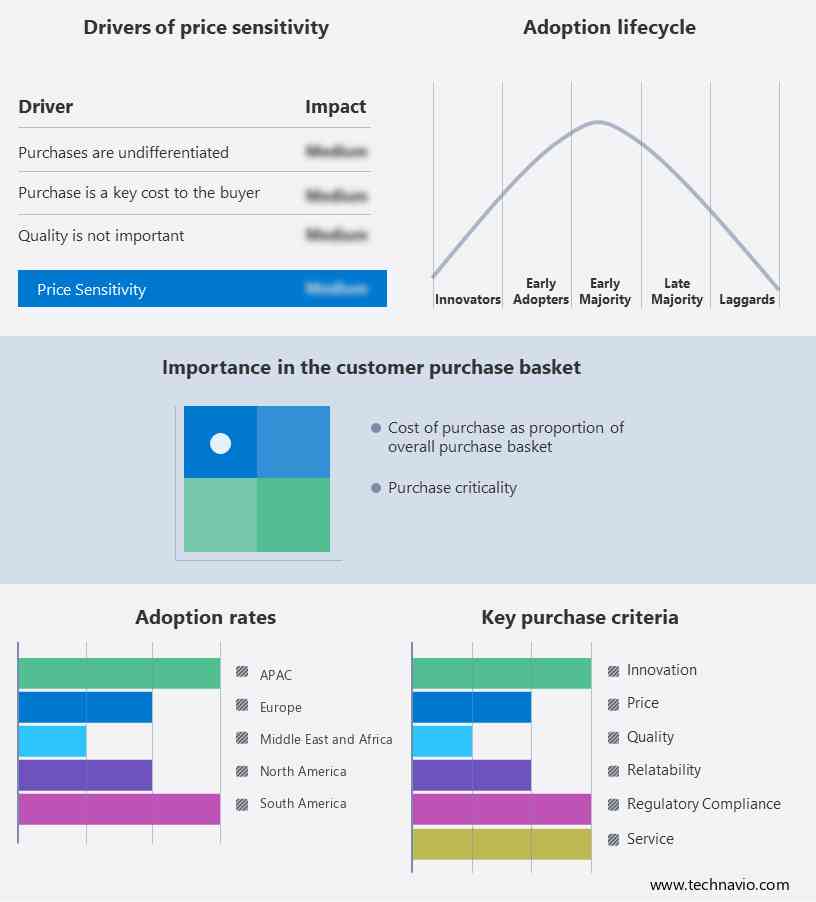
Market Customer Landscape
The Market report includes the adoption lifecycle of the market, covering from the innovator's stage to the laggard's stage. It focuses on adoption rates in different regions based on penetration. Furthermore, the report also includes key purchase criteria and drivers of price sensitivity to help companies evaluate and develop their growth strategies.
Global Market Customer Landscape
Who are the Major Customer Analytics Applications Market Companies?
Companies are implementing various strategies, such as strategic alliances, partnerships, mergers and acquisitions, geographical expansion, and product/service launches, to enhance their presence in the market.
Adobe Inc. - The company offers customer analytics applications that are built on the Adobe Experience Platform which lets join all data from every channel into a single interface for real-time, omnichannel analysis and visualization, allowing to make better decisions with a holistic view of the business, under the brand name of Adobe.
Alphabet Inc. - The company offers customer analytics applications such as Google Analytics 360 that help in understanding the customers by improving the website and creating tailored audience lists.
Alteryx Inc. - The company offers customer analytics applications Alteryx Analytics Cloud for Customer Intelligence, ingest all sources of customer data, both internal and external, to develop a central, deep, and holistic customer profile.
The research report also includes detailed analyses of the competitive landscape of the market and information about 20 market companies, including:
- Exigent Group Ltd.
- International Business Machines Corp.
- LatentView Analytics
- Microsoft Corp.
- Oracle Corp.
- QlikTech international AB
- Qualtrics LLC
- Salesforce Inc.
- SAP SE
- SAS Institute Inc.
- Sisense Ltd.
- Tata Consultancy Services Ltd.
- Telefonaktiebolaget LM Ericsson
- Teradata Corp.
- Thales Group
- TikaMobile Inc.
- Zoho Corp. Pvt. Ltd.
Qualitative and quantitative analysis of companies has been conducted to help clients understand the wider business environment as well as the strengths and weaknesses of key market players. Data is qualitatively analyzed to categorize companies as pure play, category-focused, industry-focused, and diversified; it is quantitatively analyzed to categorize companies as dominant, leading, strong, tentative, and weak.
Segment Overview
The market research report provides comprehensive data (region wise segment analysis), with forecasts and estimates in "USD Billion" for the period 2024 to 2028, as well as historical data from 2018 to 2022 for the following segments
- End-user Outlook
- Retail
- BFSI
- Telecom and IT
- Healthcare
- Others
- Deployment Outlook
- On-premise
- Cloud
- Region Outlook
- North America
- The U.S.
- Canada
- South America
- Chile
- Brazil
- Argentina
- Europe
- U.K.
- Germany
- France
- Rest of Europe
- APAC
- China
- India
- Middle East & Africa
- Saudi Arabia
- South Africa
- Rest of the Middle East & Africa
- North America
Market Analyst Overview
In the rapidly evolving digital landscape, Artificial Intelligence and Machine Learning are transforming business process automation through advanced data models and analytic models. Cloud-based solutions like Software as a Service (SaaS) offer scalable cloud deployment modes, enhancing commerce and online purchasing experiences. Tools such as Mixpanel, Manthan System, Second Measure, and Absolute Data provide insights into consumer behavior, supporting personalized communications and repeat purchases. Platforms like Tableau, NICE Systems, and Calibremind offer powerful social media analytics and data security features, addressing privacy concerns. Customer Data Platforms (CDPs) like Amperity and Motionlogic help in crafting targeted strategies using semantic analysis and neural networks. For industries such as banks and telecoms, Experience Cloud and T-Systems deliver cloud-based solutions that improve product management and computing capacity. With skilled professionals leveraging multivariate statistics and processing apps, businesses can efficiently manage data security while utilizing social media analytics for enhanced decision-making.
|
Market Scope |
|
|
Report Coverage |
Details |
|
Page number |
192 |
|
Base year |
2023 |
|
Historic period |
2018 - 2022 |
|
Forecast period |
2024-2028 |
|
Growth momentum & CAGR |
Accelerate at a CAGR of 17.58% |
|
Market growth 2024-2028 |
USD 16.73 billion |
|
Market structure |
Fragmented |
|
YoY growth 2023-2024(%) |
16.78 |
|
Regional analysis |
North America, Europe, APAC, South America, and Middle East and Africa |
|
Performing market contribution |
North America at 42% |
|
Key countries |
US, Germany, China, UK, and Japan |
|
Competitive landscape |
Leading Companies, Market Positioning of Companies, Competitive Strategies, and Industry Risks |
|
Key companies profiled |
Adobe Inc., Alphabet Inc., Alteryx Inc., Exigent Group Ltd., International Business Machines Corp., LatentView Analytics, Microsoft Corp., Oracle Corp., QlikTech international AB, Qualtrics LLC, Salesforce Inc., SAP SE, SAS Institute Inc., Sisense Ltd., Tata Consultancy Services Ltd., Telefonaktiebolaget LM Ericsson, Teradata Corp., Thales Group, TikaMobile Inc., and Zoho Corp. Pvt. Ltd. |
|
Market dynamics |
Parent market analysis, Market forecasting growth inducers and obstacles, Fast-growing and slow-growing segment analysis, Market growth and Forecasting, COVID 19 impact and recovery analysis and future consumer dynamics, Market condition analysis for forecast period |
|
Customization purview |
If our market report has not included the data that you are looking for, you can reach out to our analysts and get segments customized. |
What are the Key Data Covered in this Market Forecast Report?
- CAGR of the market during the forecast period
- Detailed information on factors that will drive the market growth and forecasting of the market between 2024 and 2028
- Precise estimation of the market size and its contribution to the parent market
- Accurate predictions about upcoming market trends and analysis and changes in consumer behavior
- Growth of the market across Europe, North America, APAC, South America, and Middle East and Africa
- Thorough market growth analysis of the market's competitive landscape and detailed information about companies
- Comprehensive market analysis and report on the factors that will challenge the market research and growth of market companies
We can help! Our analysts can customize this market research report to meet your requirements.
 RIA -
RIA - 
