Cycling Wear Market Analysis, Size, and Forecast 2026-2030: Europe (Germany, France, and UK), North America (US, Canada, and Mexico), APAC (China, India, and Japan), South America (Brazil and Argentina), Middle East and Africa (Saudi Arabia, South Africa, and UAE), and Rest of World (ROW)

Cycling Wear Market Analysis, Size, and Forecast 2026-2030:
Europe (Germany, France, and UK), North America (US, Canada, and Mexico), APAC (China, India, and Japan), South America (Brazil and Argentina), Middle East and Africa (Saudi Arabia, South Africa, and UAE), and Rest of World (ROW)

Published: Mar 2026 288 Pages SKU: IRTNTR41654

Market Overview at a Glance

$2.20 B
Market Opportunity
8.4%
CAGR 2025 - 2030
35.2%
Europe Growth
$2.73 B
Offline segment 2024

Cycling Wear Market Size 2026-2030

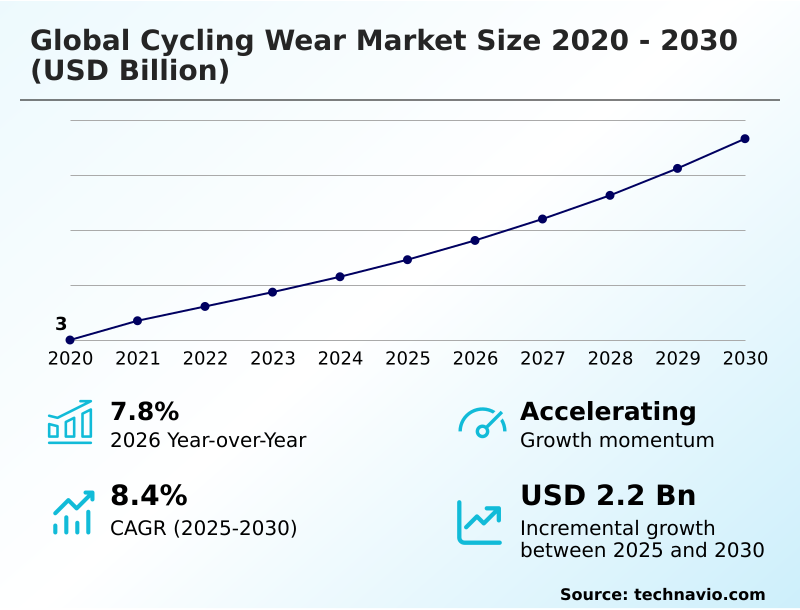
The cycling wear market size is valued to increase by USD 2.20 billion, at a CAGR of 8.4% from 2025 to 2030. Strategic engineering and aerodynamic performance innovations will drive the cycling wear market.

Major Market Trends & Insights

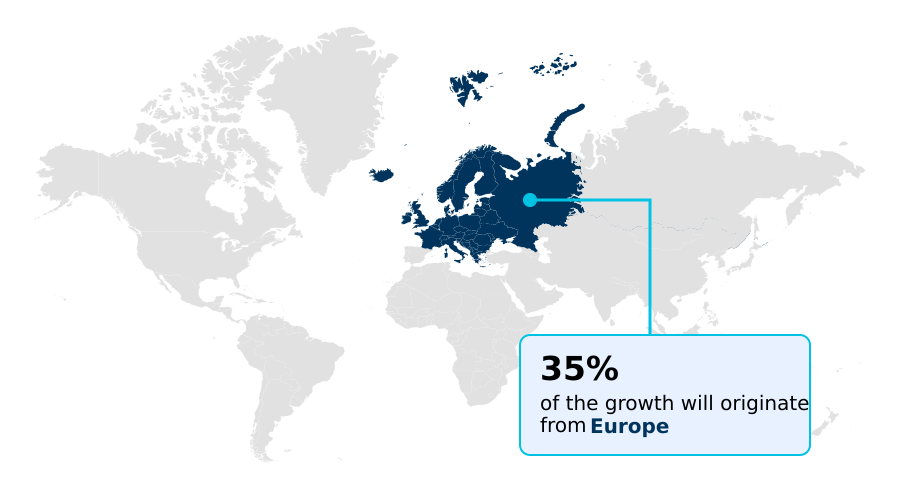
  • Europe dominated the market and accounted for a 35.2% growth during the forecast period.
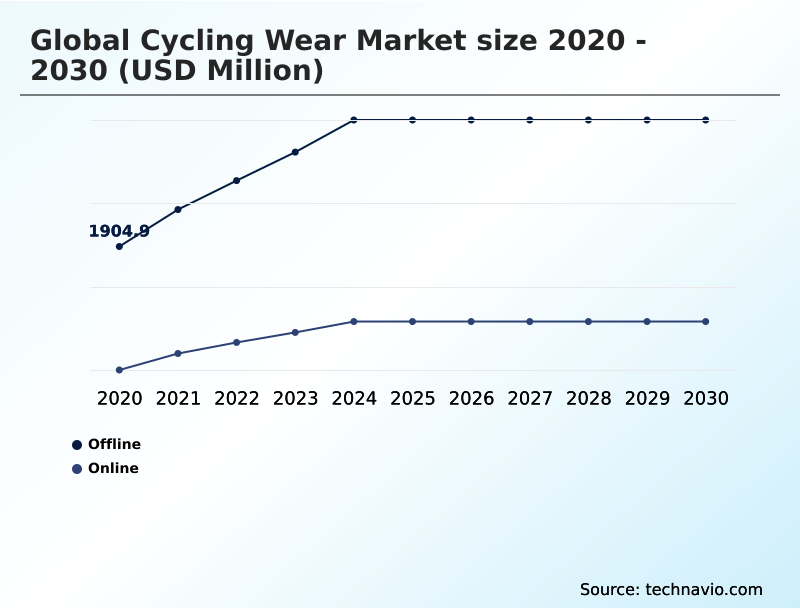
  • By Distribution Channel - Offline segment was valued at USD 2.73 billion in 2024
  • By Product - Clothing segment accounted for the largest market revenue share in 2024

Market Size & Forecast

  • Market Opportunities: USD 3.66 billion
  • Market Future Opportunities: USD 2.20 billion
  • CAGR from 2025 to 2030 : 8.4%

Market Summary

  • The cycling wear market is experiencing a significant transformation, driven by a convergence of technological innovation and evolving consumer priorities. Demand is shifting from basic athletic wear to specialized, high-performance apparel engineered for aerodynamic efficiency, thermal regulation, and enhanced comfort.
  • This has led to the adoption of advanced materials and manufacturing techniques, such as body-mapped panel construction, seamless designs, and the integration of smart textiles for biometric monitoring.
  • A key business scenario involves supply chain optimization, where manufacturers are leveraging data analytics to better align production with real-time demand, aiming to mitigate the costly issue of inventory surpluses that have recently plagued the industry. Concurrently, a strong push toward sustainability is reshaping material sourcing and production processes, with a growing emphasis on recycled polyester and bio-based alternatives.
  • However, this transition introduces challenges related to higher operational costs and the need to navigate complex regulatory frameworks. The market is also diversifying, with growing sub-segments for gravel, urban commuting, and indoor cycling, each requiring unique apparel solutions that balance performance, durability, and aesthetics to capture a discerning global audience.

What will be the Size of the Cycling Wear Market during the forecast period?

Get Key Insights on Market Forecast (PDF) Request Free Sample

How is the Cycling Wear Market Segmented?

The cycling wear industry research report provides comprehensive data (region-wise segment analysis), with forecasts and estimates in "USD million" for the period 2026-2030, as well as historical data from 2020-2024 for the following segments.

  • Distribution channel
    • Offline
    • Online
  • Product
    • Clothing
    • Footwear
    • Others
  • Price range
    • Moderate
    • Low
    • Premium
  • Geography
    • Europe
      • Germany
      • France
      • UK
    • North America
      • US
      • Canada
      • Mexico
    • APAC
      • China
      • India
      • Japan
    • South America
      • Brazil
      • Argentina
    • Middle East and Africa
      • Saudi Arabia
      • South Africa
      • UAE
    • Rest of World (ROW)

By Distribution Channel Insights

The offline segment is estimated to witness significant growth during the forecast period.

The offline segment remains a critical touchpoint, providing the tactile experience necessary to evaluate high-performance garments. Specialized retail environments allow riders to assess technical features like chamois pad design and the feel of four-way stretch material firsthand.

Expert staff can explain the benefits of welded seams over traditional stitching and the durability of advanced sublimation printing techniques.

While direct-to-consumer channels grow, the ability to try on items like bib tights and receive advice on cycling gear maintenance for specific cycling apparel materials reinforces the value of physical stores.

However, this channel also contributes to inventory challenges, with the industry inventory-to-sales ratio reaching 4.1 to 1, as brands balance production of custom cycling kits with stock management.

Request Free Sample

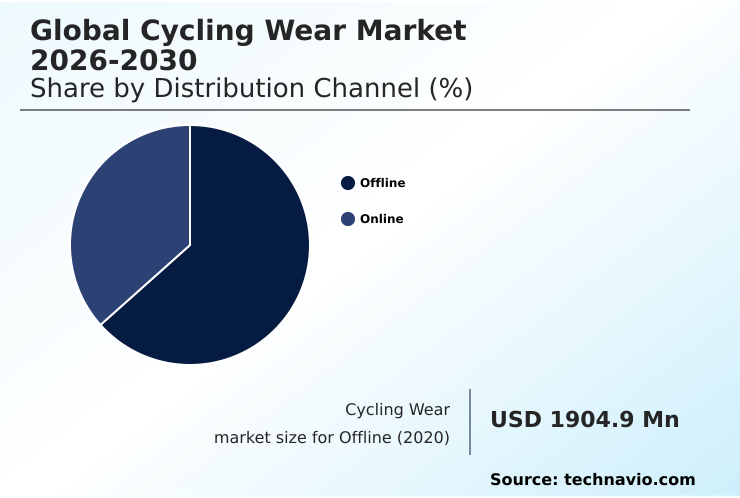
The Offline segment was valued at USD 2.73 billion in 2024 and showed a gradual increase during the forecast period.

Request Free Sample

Regional Analysis

Europe is estimated to contribute 35.2% to the growth of the global market during the forecast period.Technavio’s analysts have elaborately explained the regional trends and drivers that shape the market during the forecast period.

See How Cycling Wear Market Demand is Rising in Europe Request Free Sample

The geographic landscape reveals distinct regional demands influencing product development. In urbanized regions like Europe, which accounts for 35.2% of incremental growth, demand is high for commuter cycling pants featuring prominent reflective elements for safety.

This has spurred innovation in high-visibility dyes used in items like a high-visibility cycling vest. In contrast, North America, with its vast trail networks, drives the mountain bike clothing segment, which requires durable abrasion-resistant panels.

The APAC region, exhibiting the fastest CAGR at 9.3%, shows a rising appetite for performance features such as advanced moisture-wicking fabrics, compression technology in compression cycling socks, and footwear with customizable cleat system compatibility and heat-moldable insoles, signaling a maturing consumer base.

Market Dynamics

Our researchers analyzed the data with 2025 as the base year, along with the key drivers, trends, and challenges. A holistic analysis of drivers will help companies refine their marketing strategies to gain a competitive advantage.

  • Understanding how to choose cycling clothing for rain is a critical decision for consumers, pushing manufacturers to innovate beyond basic waterproofing. The advancements in smart cycling apparel technology are a key differentiator, as riders now seek data-driven insights on their performance. For many, the debate between an aerodynamic vs lightweight cycling jersey highlights the nuanced demands of competitive cyclists.
  • Simultaneously, the importance of chamois in cycling shorts remains paramount for endurance athletes seeking the best cycling wear for long distance rides. The market is also addressing the challenges of creating waterproof breathable fabric that performs in varied conditions, a crucial factor for riders in hot and humid weather.
  • A significant focus is on sustainable materials in premium cycling apparel, a trend that resonates with environmentally conscious consumers. This push for innovation is creating a complex supply chain, where an inventory imbalance of 4.1 to 1 illustrates a significant disconnect between production and sales, a stark increase from previous years.
  • Other key considerations include the benefits of compression in cycling bib shorts, the difference between road and gravel cycling shoes, and the impact of fabric choice on cycling performance.
  • Questions around what to wear for a first century ride or how to layer cycling clothes for cold weather continue to drive educational content and product diversification, including solutions for cycling clothing for sensitive skin and understanding UV protection ratings in cycling apparel.

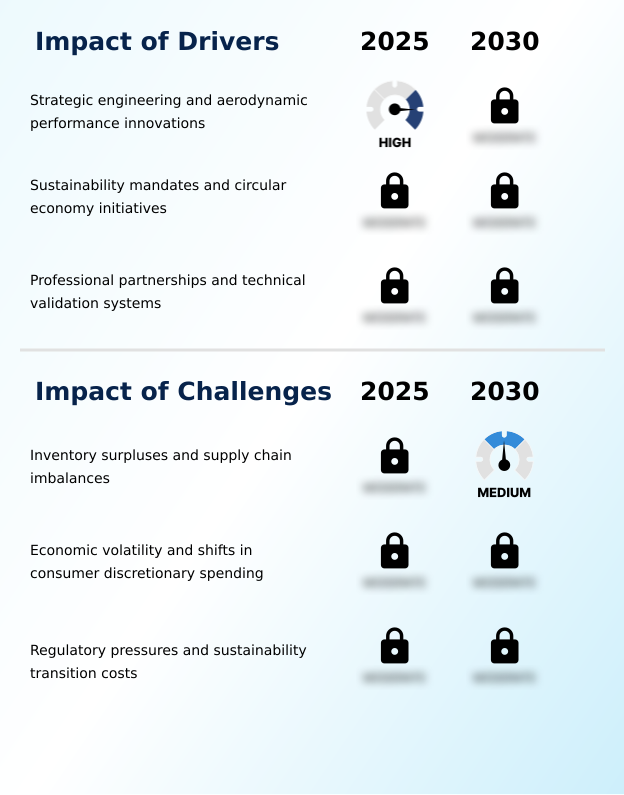
What are the key market drivers leading to the rise in the adoption of Cycling Wear Industry?

  • Strategic engineering and innovations in aerodynamic performance are key drivers propelling market growth.

  • Strategic engineering is a primary driver, with advancements in aerodynamic efficiency at the forefront of technical cycling clothing.
  • The development of an aerodynamic cycling jersey now involves extensive computational fluid dynamics modeling and wind tunnel testing, which can reduce drag by up to 5%.
  • This push for performance extends to footwear, where a carbon fiber sole maximizes power transfer.
  • Concurrently, the shift toward sustainable cycling wear is compelling brands to innovate with materials, evidenced by a 40% increase in recycled polyester use and the exploration of bio-based alternatives.
  • This trend satisfies demand for pro-level cycling kits that are both high-performing and environmentally conscious, influencing everything from a lightweight cycling jacket to specialized gravel cycling apparel.

What are the market trends shaping the Cycling Wear Industry?

  • An increasing focus on ergonomic fit and enhanced rider comfort is a prominent upcoming trend in the market. Manufacturers are prioritizing advanced materials and designs to improve the overall cycling experience.

  • A major trend is the integration of smart textiles for enhanced performance cycling apparel. Innovations in cycling clothing technology now include embedded sensors for biometric monitoring, with some achieving 98% accuracy in tracking heart rate. This data-driven approach is complemented by an intense focus on ergonomic fit, utilizing body-mapped panel construction and seamless construction to reduce friction.
  • The rise of premium cycling apparel is evident in women's specific cycling apparel and men's cycling bib shorts featuring chafe-resistant stitching. Furthermore, materials with a 3d knit structure are improving airflow by over 20%, a feature crucial for high-intensity indoor cycling clothing where ventilation is paramount.

What challenges does the Cycling Wear Industry face during its growth?

  • Inventory surpluses and supply chain imbalances present a key challenge affecting industry growth and profitability.

  • A key market challenge involves managing production costs while meeting demand for advanced features in all-weather cycling gear. The transition to sustainable hydrophobic treatment alternatives for items like waterproof cycling trousers increases material expenses by up to 15%. Balancing features like thermal regulation in a thermal cycling base layer with breathability from mesh ventilation panels adds complexity.
  • Furthermore, consumers expect high-end details like laser-cut bib straps and flatlock stitching even in mid-tier urban commuter cycling wear. Incorporating UV protection fabric and effective anti-odor technology without significant price hikes is a persistent issue, especially as supply chain imbalances affect nearly one-third of specialized textile shipments.

Exclusive Technavio Analysis on Customer Landscape

The cycling wear market forecasting report includes the adoption lifecycle of the market, covering from the innovator’s stage to the laggard’s stage. It focuses on adoption rates in different regions based on penetration. Furthermore, the cycling wear market report also includes key purchase criteria and drivers of price sensitivity to help companies evaluate and develop their market growth analysis strategies.

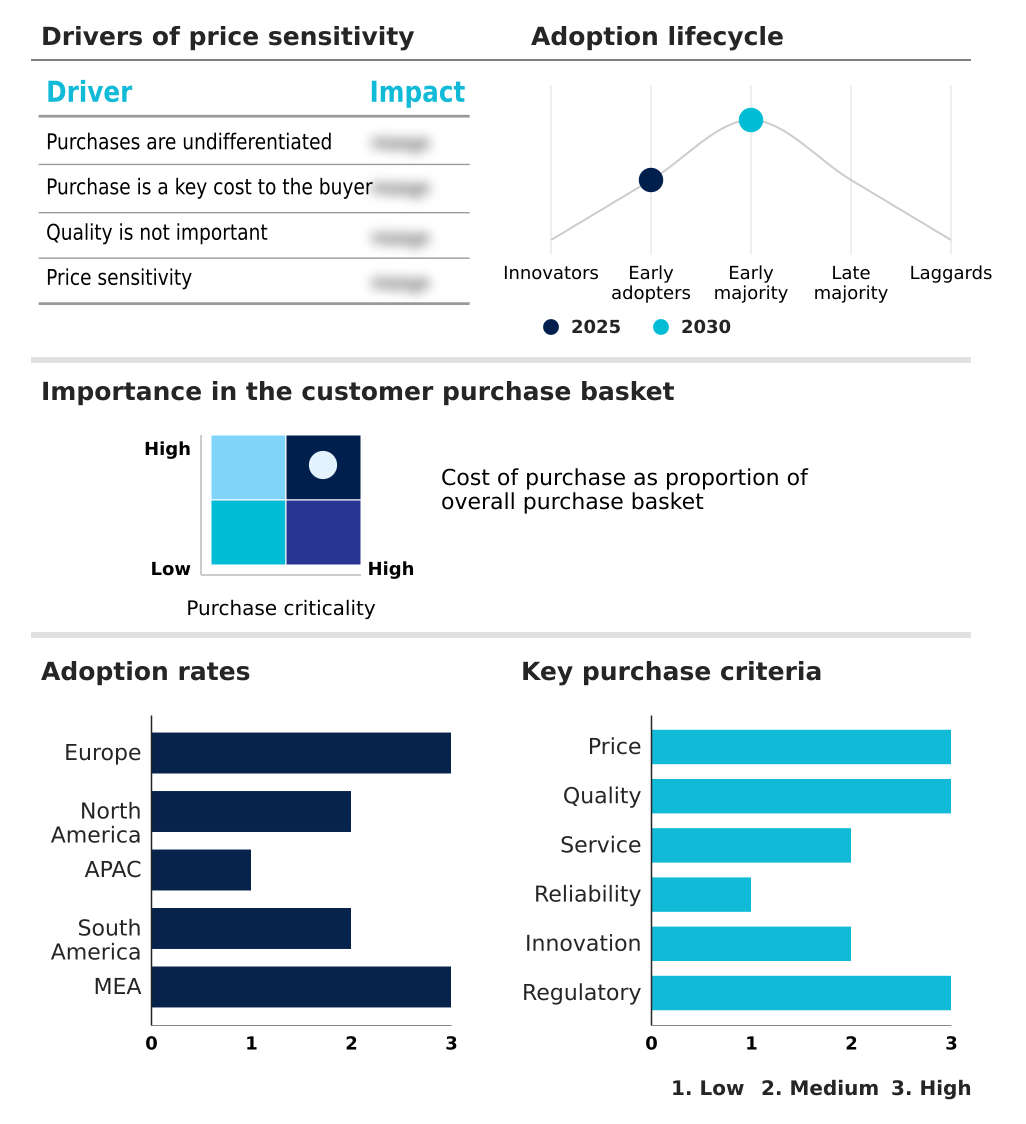
Customer Landscape of Cycling Wear Industry

Competitive Landscape

Companies are implementing various strategies, such as strategic alliances, cycling wear market forecast, partnerships, mergers and acquisitions, geographical expansion, and product/service launches, to enhance their presence in the industry.

Adidas AG - Key offerings comprise a portfolio of technical cycling apparel engineered for performance, comfort, and aerodynamics, catering to both professional athletes and recreational riders.

The industry research and growth report includes detailed analyses of the competitive landscape of the market and information about key companies, including:

  • Adidas AG
  • ASSOS of Switzerland GmbH
  • BLACK SHEEP CYCLING
  • CCN Sport
  • Cycle Clothing Ltd.
  • Garmin Ltd.
  • Giant Bicycle Inc.
  • Jaggad Pty Ltd.
  • Le Col
  • Manifattura Valcismon S.p.A.
  • MYSENLAN
  • Nike Inc.
  • PEARL iZUMi
  • Pentland Brands Ltd.
  • Rapha Racing Ltd.
  • Recreational Equipment Inc.
  • Shimano Inc.
  • Trek Bicycle Corp.
  • Troy Lee Designs Inc.
  • Velocio LLC

Qualitative and quantitative analysis of companies has been conducted to help clients understand the wider business environment as well as the strengths and weaknesses of key industry players. Data is qualitatively analyzed to categorize companies as pure play, category-focused, industry-focused, and diversified; it is quantitatively analyzed to categorize companies as dominant, leading, strong, tentative, and weak.

Recent Development and News in Cycling wear market

  • In October, 2024, Pearl Izumi launched its Attack Collection, which features jerseys and shorts constructed from lightweight, breathable materials designed to provide superior comfort for recreational and professional riders alike.
  • In December, 2024, Selle Italia acquired Vittoria Cycling Shoes to broaden its expertise in the footwear category and create a more integrated product ecosystem for performance-oriented cyclists.
  • In March, 2025, MAAP unveiled the Aeon Jersey, which utilizes Polartec Delta fabric technology to create a 3D knit structure that enhances airflow and moisture-wicking properties.
  • In April, 2025, CUORE introduced the Gold Pro Speed Suit, which was meticulously optimized for superior aerodynamics, demonstrating that even speed-oriented garments are being refined for mixed-terrain racing.

Dive into Technavio’s robust research methodology, blending expert interviews, extensive data synthesis, and validated models for unparalleled Cycling Wear Market insights. See full methodology.

Market Scope
Page number 288
Base year 2025
Historic period 2020-2024
Forecast period 2026-2030
Growth momentum & CAGR Accelerate at a CAGR of 8.4%
Market growth 2026-2030 USD 2203.7 million
Market structure Fragmented
YoY growth 2025-2026(%) 7.8%
Key countries Germany, France, UK, Italy, Spain, The Netherlands, US, Canada, Mexico, China, India, Japan, South Korea, Australia, Singapore, Brazil, Argentina, Chile, Saudi Arabia, South Africa, UAE, Egypt and Nigeria
Competitive landscape Leading Companies, Market Positioning of Companies, Competitive Strategies, and Industry Risks

Request Free Sample

Research Analyst Overview

  • The cycling wear market is driven by a relentless pursuit of performance, with R&D centered on materials that enhance aerodynamic efficiency and provide superior thermal regulation. Boardroom decisions are increasingly shaped by the need for sustainable practices, mandating a shift toward recycled polyester and bio-based alternatives.
  • Innovations such as the 3D knit structure, advanced DWR coating, and welded seams are becoming standard. The use of computational fluid dynamics and extensive wind tunnel testing in product development has led to apparel that reduces drag by over 5%.
  • Features like flatlock stitching, a customizable cleat system, and heat-moldable insoles address comfort, while a high-tech carbon fiber sole ensures maximum power transfer. The focus extends to details like laser-cut bib straps, mesh ventilation panels, and silicone leg grippers. As the industry moves away from perfluorinated chemicals, it embraces new technologies like hydrophobic treatment and advanced sublimation printing.
  • From smart textiles for biometric monitoring to chafe-resistant stitching and ergonomic fit, every element is meticulously engineered.

What are the Key Data Covered in this Cycling Wear Market Research and Growth Report?

  • What is the expected growth of the Cycling Wear Market between 2026 and 2030?

    • USD 2.20 billion, at a CAGR of 8.4%

  • What segmentation does the market report cover?

    • The report is segmented by Distribution Channel (Offline, and Online), Product (Clothing, Footwear, and Others), Price Range (Moderate, Low, and Premium) and Geography (Europe, North America, APAC, South America, Middle East and Africa)

  • Which regions are analyzed in the report?

    • Europe, North America, APAC, South America and Middle East and Africa

  • What are the key growth drivers and market challenges?

    • Strategic engineering and aerodynamic performance innovations, Inventory surpluses and supply chain imbalances

  • Who are the major players in the Cycling Wear Market?

    • Adidas AG, ASSOS of Switzerland GmbH, BLACK SHEEP CYCLING, CCN Sport, Cycle Clothing Ltd., Garmin Ltd., Giant Bicycle Inc., Jaggad Pty Ltd., Le Col, Manifattura Valcismon S.p.A., MYSENLAN, Nike Inc., PEARL iZUMi, Pentland Brands Ltd., Rapha Racing Ltd., Recreational Equipment Inc., Shimano Inc., Trek Bicycle Corp., Troy Lee Designs Inc. and Velocio LLC

Market Research Insights

  • Market dynamics are increasingly influenced by the tension between high-performance innovation and supply chain volatility. While demand for technical cycling clothing and premium cycling apparel remains strong, companies are navigating significant inventory imbalances, with stock-to-sales ratios rising from 2.9 to 1 to a challenging 4.1 to 1.
  • This has cooled demand for high-end equipment in some markets, with annual sales in regions like China showing a significant downturn. The push for sustainable cycling wear and specialized gear for disciplines like gravel cycling apparel and urban commuter cycling wear is creating new growth avenues.
  • However, success hinges on effective inventory management and offering value-driven products, from an aerodynamic cycling jersey to a lightweight cycling jacket, that meet technical demands without alienating price-sensitive consumers in a fluctuating economic climate.

We can help! Our analysts can customize this cycling wear market research report to meet your requirements.

Get in touch

1. Executive Summary

1.1 Market overview

Executive Summary - Chart on Market Overview
Executive Summary - Data Table on Market Overview
Executive Summary - Chart on Global Market Characteristics
Executive Summary - Chart on Market by Geography
Executive Summary - Chart on Market Segmentation by Distribution Channel
Executive Summary - Chart on Market Segmentation by Product
Executive Summary - Chart on Market Segmentation by Price Range
Executive Summary - Chart on Incremental Growth
Executive Summary - Data Table on Incremental Growth
Executive Summary - Chart on Company Market Positioning

2. Technavio Analysis

2.1 Analysis of price sensitivity, lifecycle, customer purchase basket, adoption rates, and purchase criteria

2.2 Criticality of inputs and Factors of differentiation

Chart on Overview on criticality of inputs and factors of differentiation

2.3 Factors of disruption

Chart on Overview on factors of disruption

2.4 Impact of drivers and challenges

Chart on Impact of drivers and challenges in 2025 and 2030

3. Market Landscape

3.1 Market ecosystem

Chart on Parent Market
Data Table on - Parent Market

3.2 Market characteristics

Chart on Market characteristics analysis

3.3 Value chain analysis

Chart on Value chain analysis

4. Market Sizing

4.1 Market definition

Data Table on Offerings of companies included in the market definition

4.2 Market segment analysis

Market segments

4.3 Market size 2025

4.4 Market outlook: Forecast for 2025-2030

Chart on Global - Market size and forecast 2025-2030 ($ million)
Data Table on Global - Market size and forecast 2025-2030 ($ million)
Chart on Global Market: Year-over-year growth 2025-2030 (%)
Data Table on Global Market: Year-over-year growth 2025-2030 (%)

5. Historic Market Size

5.1 Global Cycling Wear Market 2020 - 2024

Historic Market Size - Data Table on Global Cycling Wear Market 2020 - 2024 ($ million)

5.2 Distribution Channel segment analysis 2020 - 2024

Historic Market Size - Distribution Channel Segment 2020 - 2024 ($ million)

5.3 Product segment analysis 2020 - 2024

Historic Market Size - Product Segment 2020 - 2024 ($ million)

5.4 Price Range segment analysis 2020 - 2024

Historic Market Size - Price Range Segment 2020 - 2024 ($ million)

5.5 Geography segment analysis 2020 - 2024

Historic Market Size - Geography Segment 2020 - 2024 ($ million)

5.6 Country segment analysis 2020 - 2024

Historic Market Size - Country Segment 2020 - 2024 ($ million)

6. Qualitative Analysis

6.1 Impact of AI on Global Cycling Wear Market

6.2 Impact of geopolitical conflicts on Global Cycling Wear Market

7. Five Forces Analysis

7.1 Five forces summary

Five forces analysis - Comparison between 2025 and 2030

7.2 Bargaining power of buyers

Bargaining power of buyers - Impact of key factors 2025 and 2030

7.3 Bargaining power of suppliers

Bargaining power of suppliers - Impact of key factors in 2025 and 2030

7.4 Threat of new entrants

Threat of new entrants - Impact of key factors in 2025 and 2030

7.5 Threat of substitutes

Threat of substitutes - Impact of key factors in 2025 and 2030

7.6 Threat of rivalry

Threat of rivalry - Impact of key factors in 2025 and 2030

7.7 Market condition

Chart on Market condition - Five forces 2025 and 2030

8. Market Segmentation by Distribution Channel

8.1 Market segments

Chart on Distribution Channel - Market share 2025-2030 (%)
Data Table on Distribution Channel - Market share 2025-2030 (%)

8.2 Comparison by Distribution Channel

Chart on Comparison by Distribution Channel
Data Table on Comparison by Distribution Channel

8.3 Offline - Market size and forecast 2025-2030

Chart on Offline - Market size and forecast 2025-2030 ($ million)
Data Table on Offline - Market size and forecast 2025-2030 ($ million)
Chart on Offline - Year-over-year growth 2025-2030 (%)
Data Table on Offline - Year-over-year growth 2025-2030 (%)

8.4 Online - Market size and forecast 2025-2030

Chart on Online - Market size and forecast 2025-2030 ($ million)
Data Table on Online - Market size and forecast 2025-2030 ($ million)
Chart on Online - Year-over-year growth 2025-2030 (%)
Data Table on Online - Year-over-year growth 2025-2030 (%)

8.5 Market opportunity by Distribution Channel

Market opportunity by Distribution Channel ($ million)
Data Table on Market opportunity by Distribution Channel ($ million)

9. Market Segmentation by Product

9.1 Market segments

Chart on Product - Market share 2025-2030 (%)
Data Table on Product - Market share 2025-2030 (%)

9.2 Comparison by Product

Chart on Comparison by Product
Data Table on Comparison by Product

9.3 Clothing - Market size and forecast 2025-2030

Chart on Clothing - Market size and forecast 2025-2030 ($ million)
Data Table on Clothing - Market size and forecast 2025-2030 ($ million)
Chart on Clothing - Year-over-year growth 2025-2030 (%)
Data Table on Clothing - Year-over-year growth 2025-2030 (%)

9.4 Footwear - Market size and forecast 2025-2030

Chart on Footwear - Market size and forecast 2025-2030 ($ million)
Data Table on Footwear - Market size and forecast 2025-2030 ($ million)
Chart on Footwear - Year-over-year growth 2025-2030 (%)
Data Table on Footwear - Year-over-year growth 2025-2030 (%)

9.5 Others - Market size and forecast 2025-2030

Chart on Others - Market size and forecast 2025-2030 ($ million)
Data Table on Others - Market size and forecast 2025-2030 ($ million)
Chart on Others - Year-over-year growth 2025-2030 (%)
Data Table on Others - Year-over-year growth 2025-2030 (%)

9.6 Market opportunity by Product

Market opportunity by Product ($ million)
Data Table on Market opportunity by Product ($ million)

10. Market Segmentation by Price Range

10.1 Market segments

Chart on Price Range - Market share 2025-2030 (%)
Data Table on Price Range - Market share 2025-2030 (%)

10.2 Comparison by Price Range

Chart on Comparison by Price Range
Data Table on Comparison by Price Range

10.3 Moderate - Market size and forecast 2025-2030

Chart on Moderate - Market size and forecast 2025-2030 ($ million)
Data Table on Moderate - Market size and forecast 2025-2030 ($ million)
Chart on Moderate - Year-over-year growth 2025-2030 (%)
Data Table on Moderate - Year-over-year growth 2025-2030 (%)

10.4 Low - Market size and forecast 2025-2030

Chart on Low - Market size and forecast 2025-2030 ($ million)
Data Table on Low - Market size and forecast 2025-2030 ($ million)
Chart on Low - Year-over-year growth 2025-2030 (%)
Data Table on Low - Year-over-year growth 2025-2030 (%)

10.5 Premium - Market size and forecast 2025-2030

Chart on Premium - Market size and forecast 2025-2030 ($ million)
Data Table on Premium - Market size and forecast 2025-2030 ($ million)
Chart on Premium - Year-over-year growth 2025-2030 (%)
Data Table on Premium - Year-over-year growth 2025-2030 (%)

10.6 Market opportunity by Price Range

Market opportunity by Price Range ($ million)
Data Table on Market opportunity by Price Range ($ million)

11. Customer Landscape

11.1 Customer landscape overview

Analysis of price sensitivity, lifecycle, customer purchase basket, adoption rates, and purchase criteria

12. Geographic Landscape

12.1 Geographic segmentation

Chart on Market share by geography 2025-2030 (%)
Data Table on Market share by geography 2025-2030 (%)

12.2 Geographic comparison

Chart on Geographic comparison
Data Table on Geographic comparison

12.3 Europe - Market size and forecast 2025-2030

Chart on Europe - Market size and forecast 2025-2030 ($ million)
Data Table on Europe - Market size and forecast 2025-2030 ($ million)
Chart on Europe - Year-over-year growth 2025-2030 (%)
Data Table on Europe - Year-over-year growth 2025-2030 (%)
Chart on Regional Comparison - Europe
Data Table on Regional Comparison - Europe

12.3.1 Germany - Market size and forecast 2025-2030

Chart on Germany - Market size and forecast 2025-2030 ($ million)
Data Table on Germany - Market size and forecast 2025-2030 ($ million)
Chart on Germany - Year-over-year growth 2025-2030 (%)
Data Table on Germany - Year-over-year growth 2025-2030 (%)

12.3.2 France - Market size and forecast 2025-2030

Chart on France - Market size and forecast 2025-2030 ($ million)
Data Table on France - Market size and forecast 2025-2030 ($ million)
Chart on France - Year-over-year growth 2025-2030 (%)
Data Table on France - Year-over-year growth 2025-2030 (%)

12.3.3 UK - Market size and forecast 2025-2030

Chart on UK - Market size and forecast 2025-2030 ($ million)
Data Table on UK - Market size and forecast 2025-2030 ($ million)
Chart on UK - Year-over-year growth 2025-2030 (%)
Data Table on UK - Year-over-year growth 2025-2030 (%)

12.3.4 Italy - Market size and forecast 2025-2030

Chart on Italy - Market size and forecast 2025-2030 ($ million)
Data Table on Italy - Market size and forecast 2025-2030 ($ million)
Chart on Italy - Year-over-year growth 2025-2030 (%)
Data Table on Italy - Year-over-year growth 2025-2030 (%)

12.3.5 Spain - Market size and forecast 2025-2030

Chart on Spain - Market size and forecast 2025-2030 ($ million)
Data Table on Spain - Market size and forecast 2025-2030 ($ million)
Chart on Spain - Year-over-year growth 2025-2030 (%)
Data Table on Spain - Year-over-year growth 2025-2030 (%)

12.3.6 The Netherlands - Market size and forecast 2025-2030

Chart on The Netherlands - Market size and forecast 2025-2030 ($ million)
Data Table on The Netherlands - Market size and forecast 2025-2030 ($ million)
Chart on The Netherlands - Year-over-year growth 2025-2030 (%)
Data Table on The Netherlands - Year-over-year growth 2025-2030 (%)

12.4 North America - Market size and forecast 2025-2030

Chart on North America - Market size and forecast 2025-2030 ($ million)
Data Table on North America - Market size and forecast 2025-2030 ($ million)
Chart on North America - Year-over-year growth 2025-2030 (%)
Data Table on North America - Year-over-year growth 2025-2030 (%)
Chart on Regional Comparison - North America
Data Table on Regional Comparison - North America

12.4.1 US - Market size and forecast 2025-2030

Chart on US - Market size and forecast 2025-2030 ($ million)
Data Table on US - Market size and forecast 2025-2030 ($ million)
Chart on US - Year-over-year growth 2025-2030 (%)
Data Table on US - Year-over-year growth 2025-2030 (%)

12.4.2 Canada - Market size and forecast 2025-2030

Chart on Canada - Market size and forecast 2025-2030 ($ million)
Data Table on Canada - Market size and forecast 2025-2030 ($ million)
Chart on Canada - Year-over-year growth 2025-2030 (%)
Data Table on Canada - Year-over-year growth 2025-2030 (%)

12.4.3 Mexico - Market size and forecast 2025-2030

Chart on Mexico - Market size and forecast 2025-2030 ($ million)
Data Table on Mexico - Market size and forecast 2025-2030 ($ million)
Chart on Mexico - Year-over-year growth 2025-2030 (%)
Data Table on Mexico - Year-over-year growth 2025-2030 (%)

12.5 APAC - Market size and forecast 2025-2030

Chart on APAC - Market size and forecast 2025-2030 ($ million)
Data Table on APAC - Market size and forecast 2025-2030 ($ million)
Chart on APAC - Year-over-year growth 2025-2030 (%)
Data Table on APAC - Year-over-year growth 2025-2030 (%)
Chart on Regional Comparison - APAC
Data Table on Regional Comparison - APAC

12.5.1 China - Market size and forecast 2025-2030

Chart on China - Market size and forecast 2025-2030 ($ million)
Data Table on China - Market size and forecast 2025-2030 ($ million)
Chart on China - Year-over-year growth 2025-2030 (%)
Data Table on China - Year-over-year growth 2025-2030 (%)

12.5.2 India - Market size and forecast 2025-2030

Chart on India - Market size and forecast 2025-2030 ($ million)
Data Table on India - Market size and forecast 2025-2030 ($ million)
Chart on India - Year-over-year growth 2025-2030 (%)
Data Table on India - Year-over-year growth 2025-2030 (%)

12.5.3 Japan - Market size and forecast 2025-2030

Chart on Japan - Market size and forecast 2025-2030 ($ million)
Data Table on Japan - Market size and forecast 2025-2030 ($ million)
Chart on Japan - Year-over-year growth 2025-2030 (%)
Data Table on Japan - Year-over-year growth 2025-2030 (%)

12.5.4 South Korea - Market size and forecast 2025-2030

Chart on South Korea - Market size and forecast 2025-2030 ($ million)
Data Table on South Korea - Market size and forecast 2025-2030 ($ million)
Chart on South Korea - Year-over-year growth 2025-2030 (%)
Data Table on South Korea - Year-over-year growth 2025-2030 (%)

12.5.5 Australia - Market size and forecast 2025-2030

Chart on Australia - Market size and forecast 2025-2030 ($ million)
Data Table on Australia - Market size and forecast 2025-2030 ($ million)
Chart on Australia - Year-over-year growth 2025-2030 (%)
Data Table on Australia - Year-over-year growth 2025-2030 (%)

12.5.6 Singapore - Market size and forecast 2025-2030

Chart on Singapore - Market size and forecast 2025-2030 ($ million)
Data Table on Singapore - Market size and forecast 2025-2030 ($ million)
Chart on Singapore - Year-over-year growth 2025-2030 (%)
Data Table on Singapore - Year-over-year growth 2025-2030 (%)

12.6 South America - Market size and forecast 2025-2030

Chart on South America - Market size and forecast 2025-2030 ($ million)
Data Table on South America - Market size and forecast 2025-2030 ($ million)
Chart on South America - Year-over-year growth 2025-2030 (%)
Data Table on South America - Year-over-year growth 2025-2030 (%)
Chart on Regional Comparison - South America
Data Table on Regional Comparison - South America

12.6.1 Brazil - Market size and forecast 2025-2030

Chart on Brazil - Market size and forecast 2025-2030 ($ million)
Data Table on Brazil - Market size and forecast 2025-2030 ($ million)
Chart on Brazil - Year-over-year growth 2025-2030 (%)
Data Table on Brazil - Year-over-year growth 2025-2030 (%)

12.6.2 Argentina - Market size and forecast 2025-2030

Chart on Argentina - Market size and forecast 2025-2030 ($ million)
Data Table on Argentina - Market size and forecast 2025-2030 ($ million)
Chart on Argentina - Year-over-year growth 2025-2030 (%)
Data Table on Argentina - Year-over-year growth 2025-2030 (%)

12.6.3 Chile - Market size and forecast 2025-2030

Chart on Chile - Market size and forecast 2025-2030 ($ million)
Data Table on Chile - Market size and forecast 2025-2030 ($ million)
Chart on Chile - Year-over-year growth 2025-2030 (%)
Data Table on Chile - Year-over-year growth 2025-2030 (%)

12.7 Middle East and Africa - Market size and forecast 2025-2030

Chart on Middle East and Africa - Market size and forecast 2025-2030 ($ million)
Data Table on Middle East and Africa - Market size and forecast 2025-2030 ($ million)
Chart on Middle East and Africa - Year-over-year growth 2025-2030 (%)
Data Table on Middle East and Africa - Year-over-year growth 2025-2030 (%)
Chart on Regional Comparison - Middle East and Africa
Data Table on Regional Comparison - Middle East and Africa

12.7.1 Saudi Arabia - Market size and forecast 2025-2030

Chart on Saudi Arabia - Market size and forecast 2025-2030 ($ million)
Data Table on Saudi Arabia - Market size and forecast 2025-2030 ($ million)
Chart on Saudi Arabia - Year-over-year growth 2025-2030 (%)
Data Table on Saudi Arabia - Year-over-year growth 2025-2030 (%)

12.7.2 South Africa - Market size and forecast 2025-2030

Chart on South Africa - Market size and forecast 2025-2030 ($ million)
Data Table on South Africa - Market size and forecast 2025-2030 ($ million)
Chart on South Africa - Year-over-year growth 2025-2030 (%)
Data Table on South Africa - Year-over-year growth 2025-2030 (%)

12.7.3 UAE - Market size and forecast 2025-2030

Chart on UAE - Market size and forecast 2025-2030 ($ million)
Data Table on UAE - Market size and forecast 2025-2030 ($ million)
Chart on UAE - Year-over-year growth 2025-2030 (%)
Data Table on UAE - Year-over-year growth 2025-2030 (%)

12.7.4 Egypt - Market size and forecast 2025-2030

Chart on Egypt - Market size and forecast 2025-2030 ($ million)
Data Table on Egypt - Market size and forecast 2025-2030 ($ million)
Chart on Egypt - Year-over-year growth 2025-2030 (%)
Data Table on Egypt - Year-over-year growth 2025-2030 (%)

12.7.5 Nigeria - Market size and forecast 2025-2030

Chart on Nigeria - Market size and forecast 2025-2030 ($ million)
Data Table on Nigeria - Market size and forecast 2025-2030 ($ million)
Chart on Nigeria - Year-over-year growth 2025-2030 (%)
Data Table on Nigeria - Year-over-year growth 2025-2030 (%)

12.8 Market opportunity by geography

Market opportunity by geography ($ million)
Data Tables on Market opportunity by geography ($ million)

13. Drivers, Challenges, and Opportunity

13.1 Market drivers

Strategic engineering and aerodynamic performance innovations
Sustainability mandates and circular economy initiatives
Professional partnerships and technical validation systems

13.2 Market challenges

Inventory surpluses and supply chain imbalances
Economic volatility and shifts in consumer discretionary spending
Regulatory pressures and sustainability transition costs

13.3 Impact of drivers and challenges

Impact of drivers and challenges in 2025 and 2030

13.4 Market opportunities

Increasing focus on ergonomic fit and rider comfort
Integration of smart textiles and wearable performance technology
Focus on gravel specific designs and aerodynamic versatility

14. Competitive Landscape

14.1 Overview

14.2

Overview on criticality of inputs and factors of differentiation

14.3 Landscape disruption

Overview on factors of disruption

14.4 Industry risks

Impact of key risks on business

15. Competitive Analysis

15.1 Companies profiled

Companies covered

15.2 Company ranking index

15.3 Market positioning of companies

Matrix on companies position and classification

15.4 Adidas AG

Adidas AG - Overview
Adidas AG - Business segments
Adidas AG - Key news
Adidas AG - Key offerings
Adidas AG - Segment focus
SWOT

15.5 ASSOS of Switzerland GmbH

ASSOS of Switzerland GmbH - Overview
ASSOS of Switzerland GmbH - Product / Service
ASSOS of Switzerland GmbH - Key offerings
SWOT

15.6 BLACK SHEEP CYCLING

BLACK SHEEP CYCLING - Overview
BLACK SHEEP CYCLING - Product / Service
BLACK SHEEP CYCLING - Key offerings
SWOT

15.7 CCN Sport

CCN Sport - Overview
CCN Sport - Product / Service
CCN Sport - Key offerings
SWOT

15.8 Cycle Clothing Ltd.

Cycle Clothing Ltd. - Overview
Cycle Clothing Ltd. - Product / Service
Cycle Clothing Ltd. - Key offerings
SWOT

15.9 Garmin Ltd.

Garmin Ltd. - Overview
Garmin Ltd. - Business segments
Garmin Ltd. - Key news
Garmin Ltd. - Key offerings
Garmin Ltd. - Segment focus
SWOT

15.10 Giant Bicycle Inc.

Giant Bicycle Inc. - Overview
Giant Bicycle Inc. - Product / Service
Giant Bicycle Inc. - Key offerings
SWOT

15.11 Jaggad Pty Ltd.

Jaggad Pty Ltd. - Overview
Jaggad Pty Ltd. - Product / Service
Jaggad Pty Ltd. - Key offerings
SWOT

15.12 Le Col

Le Col - Overview
Le Col - Product / Service
Le Col - Key offerings
SWOT

15.13 Manifattura Valcismon S.p.A.

Manifattura Valcismon S.p.A. - Overview
Manifattura Valcismon S.p.A. - Product / Service
Manifattura Valcismon S.p.A. - Key offerings
SWOT

15.14 MYSENLAN

MYSENLAN - Overview
MYSENLAN - Product / Service
MYSENLAN - Key offerings
SWOT

15.15 Nike Inc.

Nike Inc. - Overview
Nike Inc. - Business segments
Nike Inc. - Key news
Nike Inc. - Key offerings
Nike Inc. - Segment focus
SWOT

15.16 Pentland Brands Ltd.

Pentland Brands Ltd. - Overview
Pentland Brands Ltd. - Product / Service
Pentland Brands Ltd. - Key news
Pentland Brands Ltd. - Key offerings
SWOT

15.17 Rapha Racing Ltd.

Rapha Racing Ltd. - Overview
Rapha Racing Ltd. - Product / Service
Rapha Racing Ltd. - Key offerings
SWOT

15.18 Recreational Equipment Inc.

Recreational Equipment Inc. - Overview
Recreational Equipment Inc. - Product / Service
Recreational Equipment Inc. - Key offerings
SWOT

16. Appendix

16.1 Scope of the report

Market definition
Objectives
Notes and caveats

16.2 Inclusions and exclusions checklist

Inclusions checklist
Exclusions checklist

16.3 Currency conversion rates for US$

16.4 Research methodology

16.5 Data procurement

Information sources

16.6 Data validation

16.7 Validation techniques employed for market sizing

16.8 Data synthesis

16.9 360 degree market analysis

16.10 List of abbreviations

Research Methodology

Technavio presents a detailed picture of the market by way of study, synthesis, and summation of data from multiple sources. The analysts have presented the various facets of the market with a particular focus on identifying the key industry influencers. The data thus presented is comprehensive, reliable, and the result of extensive research, both primary and secondary.

INFORMATION SOURCES

Primary sources

  • Manufacturers and suppliers
  • Channel partners
  • Industry experts
  • Strategic decision makers

Secondary sources

  • Industry journals and periodicals
  • Government data
  • Financial reports of key industry players
  • Historical data
  • Press releases

DATA ANALYSIS

Data Synthesis

  • Collation of data
  • Estimation of key figures
  • Analysis of derived insights

Data Validation

  • Triangulation with data models
  • Reference against proprietary databases
  • Corroboration with industry experts

REPORT WRITING

Qualitative

  • Market drivers
  • Market challenges
  • Market trends
  • Five forces analysis

Quantitative

  • Market size and forecast
  • Market segmentation
  • Geographical insights
  • Competitive landscape

Interested in this report?

Get your sample now to see our research methodology and insights!

Download Now

Frequently Asked Questions

Cycling Wear market growth will increase by USD 2203.7 million during 2026-2030.

The Cycling Wear market is expected to grow at a CAGR of 8.4% during 2026-2030.

Cycling Wear market is segmented by Distribution channel (Offline, Online) Product (Clothing, Footwear, Others) Price range (Moderate, Low, Premium)

Adidas AG, ASSOS of Switzerland GmbH, BLACK SHEEP CYCLING, CCN Sport, Cycle Clothing Ltd., Garmin Ltd., Giant Bicycle Inc., Jaggad Pty Ltd., Le Col, Manifattura Valcismon S.p.A., MYSENLAN, Nike Inc., PEARL iZUMi, Pentland Brands Ltd., Rapha Racing Ltd., Recreational Equipment Inc., Shimano Inc., Trek Bicycle Corp., Troy Lee Designs Inc., Velocio LLC are a few of the key vendors in the Cycling Wear market.

Europe will register the highest growth rate of 35.2% among the other regions. Therefore, the Cycling Wear market in Europe is expected to garner significant business opportunities for the vendors during the forecast period.

Germany, France, UK, Italy, Spain, The Netherlands, US, Canada, Mexico, China, India, Japan, South Korea, Australia, Singapore, Brazil, Argentina, Chile, Saudi Arabia, South Africa, UAE, Egypt, Nigeria

  • Strategic engineering and aerodynamic performance innovations is the driving factor this market.

The Cycling Wear market vendors should focus on grabbing business opportunities from the Distribution channel segment as it accounted for the largest market share in the base year.
RIA - Research AI Assistant
Ask RIA