
Data Exfiltration Market Size 2025-2029
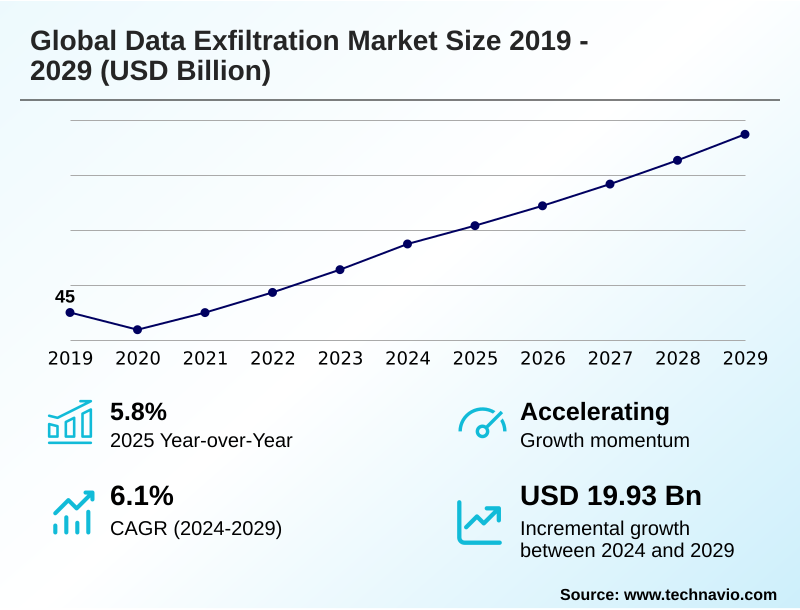
The data exfiltration market size is valued to increase by USD 19.93 billion, at a CAGR of 6.1% from 2024 to 2029. Increasing data security concerns will drive the data exfiltration market.
Major Market Trends & Insights
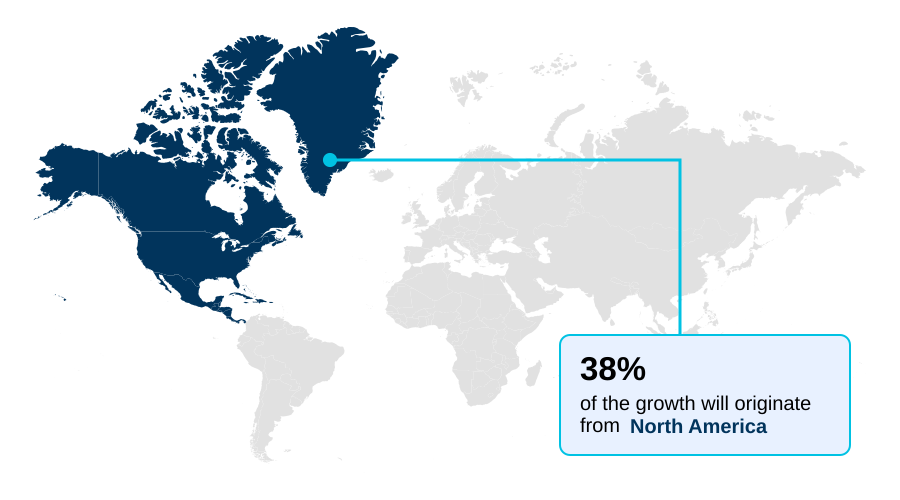
- North America dominated the market and accounted for a 38% growth during the forecast period.
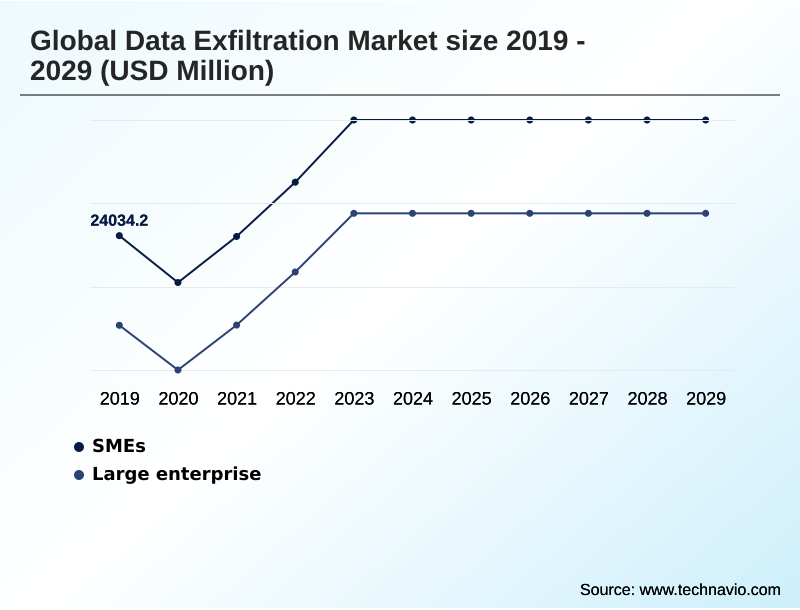
- By Type - SMEs segment was valued at USD 27.99 billion in 2023
- By Component - Solution segment accounted for the largest market revenue share in 2023
Market Size & Forecast
- Market Opportunities: USD 32.40 billion
- Market Future Opportunities: USD 19.93 billion
- CAGR from 2024 to 2029 : 6.1%
Market Summary
- The data exfiltration market is defined by the imperative to prevent the unauthorized transfer of sensitive information from within an organization to an external destination. Growth is fueled by an increasingly complex threat landscape characterized by sophisticated methods like fileless malware and the use of encrypted command and control channels.
- In response, the industry is advancing toward a unified security framework that integrates network monitoring, advanced analytics, and robust endpoint security. A significant trend is the application of artificial intelligence and machine learning for behavioral analytics, enabling more effective insider threat detection and automated policy enforcement.
- For instance, a global healthcare organization navigating stringent data privacy compliance regulations for patient records across a hybrid cloud infrastructure would deploy a zero trust data protection strategy. This approach uses tools providing granular visibility and strict access controls to continuously verify every data access request, thereby safeguarding against both external attacks and internal risks without disrupting critical operations.
- The market's evolution reflects a strategic shift from perimeter-based defense to a data-centric security posture.
What will be the Size of the Data Exfiltration Market during the forecast period?
Get Key Insights on Market Forecast (PDF) Get Free Sample
How is the Data Exfiltration Market Segmented?
The data exfiltration industry research report provides comprehensive data (region-wise segment analysis), with forecasts and estimates in "USD million" for the period 2025-2029, as well as historical data from 2019-2023 for the following segments.
- Type
- SMEs
- Large enterprise
- Component
- Solution
- Services
- End-user
- Finance
- Healthcare
- Manufacturing
- Retail
- Others
- Geography
- North America
- US
- Canada
- Mexico
- Europe
- UK
- Germany
- The Netherlands
- APAC
- China
- India
- South Korea
- South America
- Brazil
- Argentina
- Colombia
- Middle East and Africa
- Saudi Arabia
- UAE
- South Africa
- Rest of World (ROW)
- North America
By Type Insights
The smes segment is estimated to witness significant growth during the forecast period.
The market is segmented by organization size, with small and medium-sized enterprises (SMEs) representing a dynamic segment. These organizations are increasingly adopting cloud-based security models to combat threats like unauthorized data removal and corporate data leakage.
The shift is driven by the need for scalable and cost-effective solutions for insider threat mitigation and security incident response.
Following recent high-profile cybersecurity data breaches, where a single event impacted over 30% of a country's population, SMEs are prioritizing data encryption and data privacy compliance.
This involves implementing tools that provide granular visibility and strict access controls, strengthening their cloud security posture and user behavior analytics capabilities to prevent endpoint data loss and ensure robust protection against sophisticated attacks.
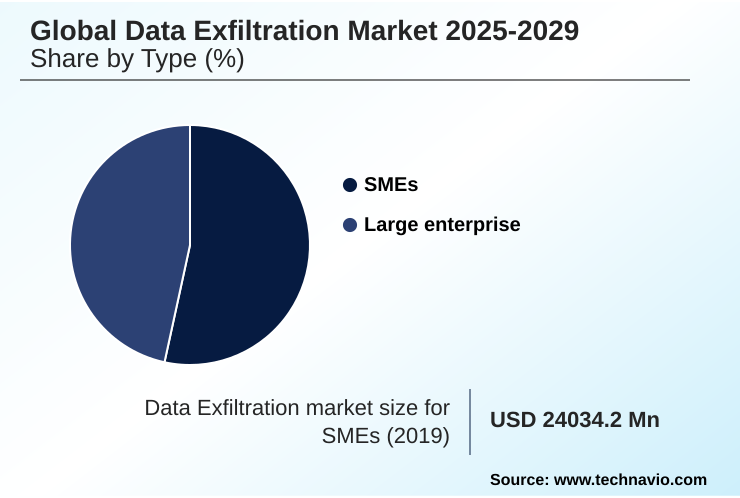
The SMEs segment was valued at USD 27.99 billion in 2023 and showed a gradual increase during the forecast period.
Regional Analysis
North America is estimated to contribute 38% to the growth of the global market during the forecast period.Technavio’s analysts have elaborately explained the regional trends and drivers that shape the market during the forecast period.
See How Data Exfiltration Market Demand is Rising in North America Get Free Sample
The geographic landscape of the market is led by North America, which accounts for approximately 38% of incremental growth, driven by early technology adoption and the presence of major security vendors.
This region sees significant investment in advanced analytics and user behavior analytics to enhance threat intelligence.
Europe follows, with its market heavily influenced by stringent data privacy compliance regulations that compel organizations to implement robust data loss prevention and network traffic inspection solutions.
In APAC, rapid digitalization is fueling demand for endpoint security and secure web gateway technologies.
Across these regions, the deployment of a cloud security gateway and a cloud access security broker has become standard for automated policy enforcement and effective data traffic monitoring to prevent unauthorized data transfer, with mature markets achieving over 90% adoption in regulated industries.
Market Dynamics
Our researchers analyzed the data with 2024 as the base year, along with the key drivers, trends, and challenges. A holistic analysis of drivers will help companies refine their marketing strategies to gain a competitive advantage.
- Modern cybersecurity strategies are evolving beyond conventional defenses, compelling organizations to understand nuanced concepts like data exfiltration versus data leakage differences to craft effective security policies. The escalating impact of ransomware on enterprise data security has accelerated this shift, forcing a move toward proactive threat mitigation.
- A key focus is on detecting insider threat data theft techniques, which often bypass traditional perimeter security. This requires sophisticated solutions capable of analyzing user behavior and data flows in real time. Consequently, enterprises are prioritizing the challenge of securing data in multi-cloud hybrid environments, where information is distributed and constantly in motion.
- A primary objective within this framework is preventing unauthorized data transfers from cloud platforms, which have become a major vector for data loss. Organizations that have adopted proactive threat hunting capabilities and integrated security platforms identify and contain breaches nearly twice as fast as those relying on reactive, alert-based systems, demonstrating a clear operational advantage in risk management.
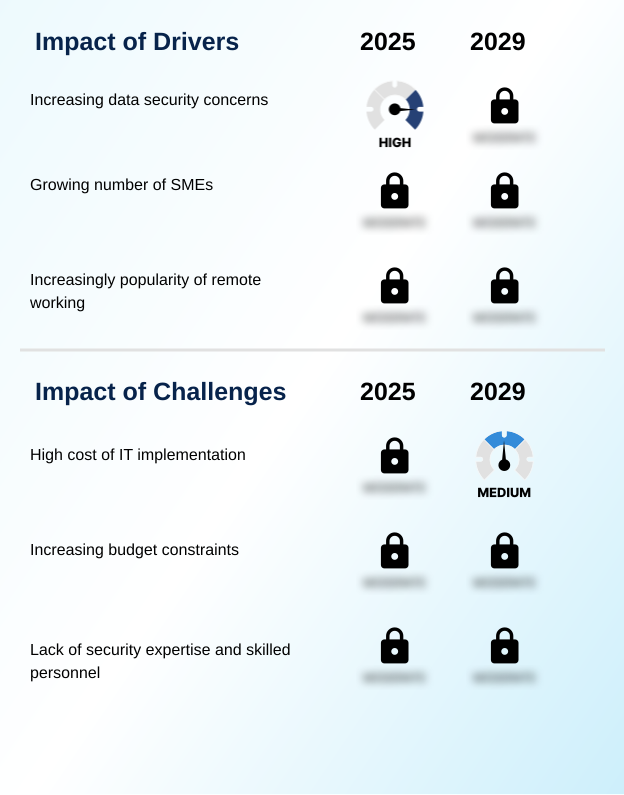
What are the key market drivers leading to the rise in the adoption of Data Exfiltration Industry?
- Heightened data security concerns, stemming from the increasing value of enterprise data and the rising threat of cyberattacks, are a key driver for market growth.
- Market growth is significantly propelled by stringent regulatory mandates and the rising financial and reputational costs of data breaches.
- Adherence to data privacy compliance frameworks is no longer optional, pushing organizations to invest in advanced tools for content-aware protection and to manage both structured and unstructured data.
- Industries handling sensitive information, such as finance and healthcare, are prime targets, making financial data security and preventing healthcare data breaches top priorities. Protecting intellectual property theft and customer data protection are now core business objectives.
- Organizations are learning from various data exfiltration techniques and implementing stronger policy-driven controls and incident response planning.
- Companies in regulated sectors allocate up to 20% more of their IT budget to security, as a single cybersecurity data breach can trigger substantial fines and erode customer trust.
What are the market trends shaping the Data Exfiltration Industry?
- The emergence of cloud security is a significant upcoming trend, driven by the need to protect data across online infrastructure, applications, and platforms.
- Key market trends are centered on the integration of intelligent and automated security architectures. The adoption of a secure access service edge (SASE) framework is accelerating, as it unifies networking and security to support distributed workforces, with early adopters reporting a 40% improvement in security posture.
- This trend is complemented by the rise of the cloud native application protection platform (CNAPP), which provides a holistic view of cloud risks. A zero trust security model is becoming foundational, mandating strict verification for every access request. This environment fosters advancements in email security solutions and behavioral analytics to counter sophisticated threats like fileless malware and zero-day vulnerabilities.
- AI-driven automated threat detection systems are now capable of identifying and neutralizing threats 60% faster than manual security operations, enhancing endpoint visibility and real-time data monitoring.
What challenges does the Data Exfiltration Industry face during its growth?
- The high implementation cost of advanced IT infrastructure and security solutions presents a key challenge, particularly for small and medium-sized enterprises.
- A primary market challenge is the high cost and complexity associated with implementing a comprehensive unified security framework. While critical for preventing sensitive data loss, the initial investment and ongoing operational expenses can be substantial.
- This is compounded by a persistent cybersecurity skills gap, with nearly 60% of organizations struggling to hire qualified personnel for advanced insider threat detection and management of a cyber intelligence platform. Securing against emerging threats like malicious api usage, api security vulnerabilities, and ransomware data theft requires specialized expertise.
- Furthermore, establishing effective data handling policies and deploying technologies for privileged access management and real-time anomaly detection add to the complexity. Organizations also face difficulties in managing encrypted command and control channels used by attackers, which can lead to significant endpoint data loss if not properly addressed.
Exclusive Technavio Analysis on Customer Landscape
The data exfiltration market forecasting report includes the adoption lifecycle of the market, covering from the innovator’s stage to the laggard’s stage. It focuses on adoption rates in different regions based on penetration. Furthermore, the data exfiltration market report also includes key purchase criteria and drivers of price sensitivity to help companies evaluate and develop their market growth analysis strategies.
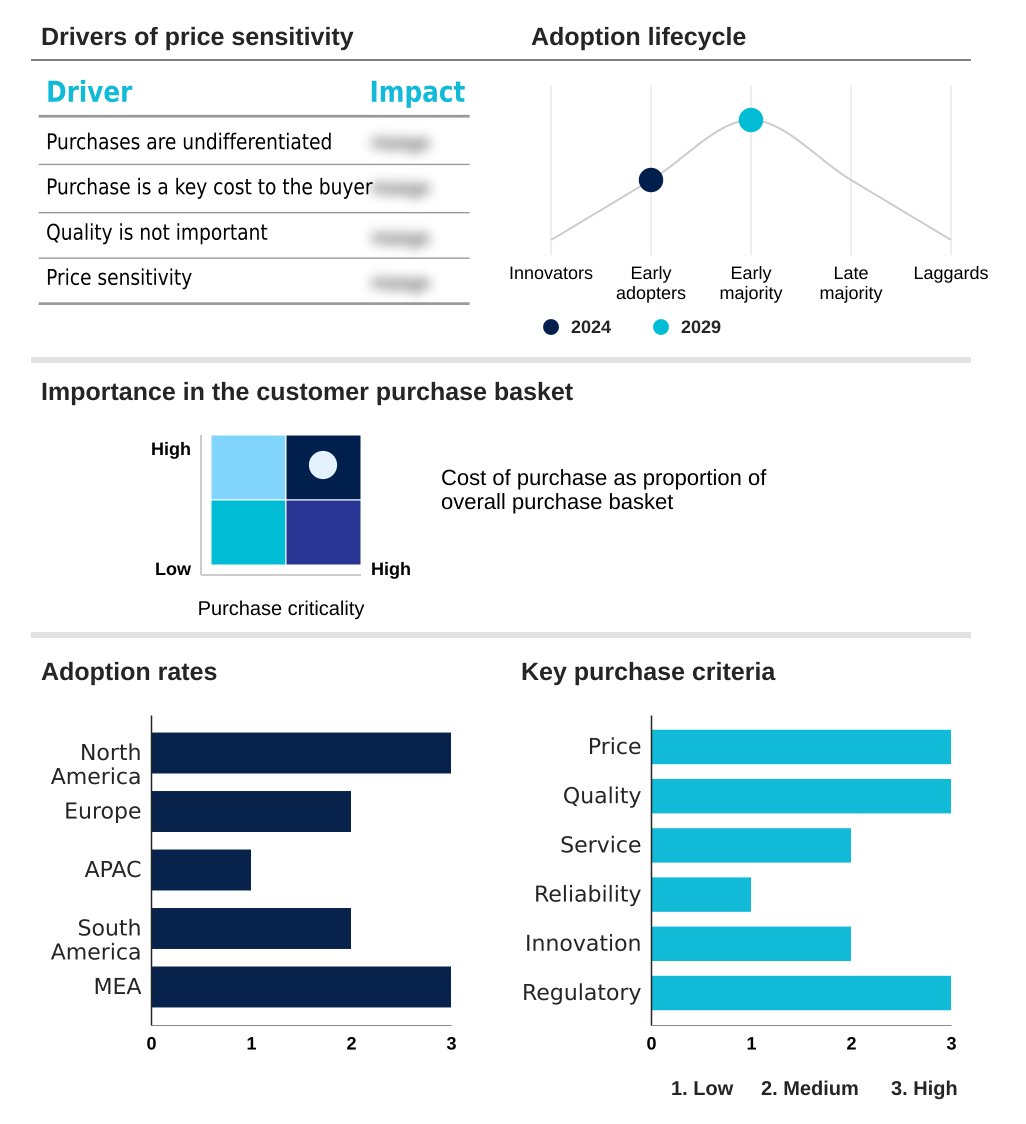
Customer Landscape of Data Exfiltration Industry
Competitive Landscape
Companies are implementing various strategies, such as strategic alliances, data exfiltration market forecast, partnerships, mergers and acquisitions, geographical expansion, and product/service launches, to enhance their presence in the industry.
A1Logic - Offers integrated solutions for data loss prevention and information rights management, addressing critical enterprise security and compliance requirements for sensitive information.
The industry research and growth report includes detailed analyses of the competitive landscape of the market and information about key companies, including:
- A1Logic
- Barracuda Networks Inc.
- Broadcom Inc.
- Check Point Software Tech Ltd.
- Cisco Systems Inc.
- CoSoSys SRL
- Dtex Systems Inc.
- Forcepoint LLC
- Fortinet Inc.
- Fortra LLC
- GTB Technologies Inc.
- Hillstone Networks Inc.
- iboss Inc.
- Juniper Networks Inc.
- Musarubra US LLC
- Netwrix Corp.
- Palo Alto Networks Inc.
Qualitative and quantitative analysis of companies has been conducted to help clients understand the wider business environment as well as the strengths and weaknesses of key industry players. Data is qualitatively analyzed to categorize companies as pure play, category-focused, industry-focused, and diversified; it is quantitatively analyzed to categorize companies as dominant, leading, strong, tentative, and weak.
Recent Development and News in Data exfiltration market
- In August 2024, Tata Consultancy Services was selected by the Government of India to upgrade the Government e-Marketplace (GeM), enhancing the public procurement platform with improved security and transparency.
- In September 2024, Wiz launched its AI security posture management, a new capability within its Cloud Native Application Protection Platform (CNAPP), designed to be the first of its kind.
- In November 2024, Arctic Wolf announced its acquisition of Cylance from Blackberry, a strategic move to enhance its endpoint security capabilities and broaden its threat detection portfolio.
- In May 2025, Zscaler announced several AI-powered innovations for its Data Protection Platform, designed to safeguard data in-motion and at-rest across all communication channels.
Dive into Technavio’s robust research methodology, blending expert interviews, extensive data synthesis, and validated models for unparalleled Data Exfiltration Market insights. See full methodology.
| Market Scope | |
|---|---|
| Page number | 286 |
| Base year | 2024 |
| Historic period | 2019-2023 |
| Forecast period | 2025-2029 |
| Growth momentum & CAGR | Accelerate at a CAGR of 6.1% |
| Market growth 2025-2029 | USD 19934.0 million |
| Market structure | Fragmented |
| YoY growth 2024-2025(%) | 5.8% |
| Key countries | US, Canada, Mexico, UK, Germany, The Netherlands, Italy, France, Spain, China, India, South Korea, Japan, Australia, Indonesia, Brazil, Argentina, Colombia, Saudi Arabia, UAE, South Africa, Israel and Turkey |
| Competitive landscape | Leading Companies, Market Positioning of Companies, Competitive Strategies, and Industry Risks |
Research Analyst Overview
- The data exfiltration market is fundamentally driven by the need to counter sophisticated threats targeting sensitive enterprise assets. Preventing unauthorized data transfer and monitoring sensitive data movement requires a multi-layered defense strategy. This involves deploying a unified security framework combining technologies like data loss prevention, a cloud security gateway, and a cloud access security broker for comprehensive oversight.
- Advanced capabilities such as network traffic inspection, user behavior analytics, and real-time anomaly detection are critical for identifying threats like a ransomware attack or a zero-day vulnerability. Boardroom decisions are increasingly focused on allocating resources toward robust incident response planning and integrated threat intelligence to manage risk effectively.
- Modern platforms use automated policy enforcement, which has been shown to reduce security configuration errors by over 50%. This strategy integrates endpoint security, data encryption, and privileged access management, providing granular visibility and strict access controls to protect both structured and unstructured data from malicious data transfers and fileless malware tactics.
What are the Key Data Covered in this Data Exfiltration Market Research and Growth Report?
-
What is the expected growth of the Data Exfiltration Market between 2025 and 2029?
-
USD 19.93 billion, at a CAGR of 6.1%
-
-
What segmentation does the market report cover?
-
The report is segmented by Type (SMEs, Large enterprise), Component (Solution, Services), End-user (Finance, Healthcare, Manufacturing, Retail, Others) and Geography (North America, Europe, APAC, South America, Middle East and Africa)
-
-
Which regions are analyzed in the report?
-
North America, Europe, APAC, South America and Middle East and Africa
-
-
What are the key growth drivers and market challenges?
-
Increasing data security concerns, High cost of IT implementation
-
-
Who are the major players in the Data Exfiltration Market?
-
A1Logic, Barracuda Networks Inc., Broadcom Inc., Check Point Software Tech Ltd., Cisco Systems Inc., CoSoSys SRL, Dtex Systems Inc., Forcepoint LLC, Fortinet Inc., Fortra LLC, GTB Technologies Inc., Hillstone Networks Inc., iboss Inc., Juniper Networks Inc., Musarubra US LLC, Netwrix Corp. and Palo Alto Networks Inc.
-
Market Research Insights
- The dynamics of the data exfiltration market are shaped by the pursuit of greater operational resilience and stricter compliance. Organizations leveraging an integrated approach to data exfiltration prevention and insider threat mitigation demonstrate a 30% greater effectiveness in detecting data theft compared to those with disparate systems.
- Proactive strategies focus on monitoring data transfers and securing cloud data to prevent intellectual property theft and protect customer data. Moreover, the adoption of a zero trust security model for corporate data leakage prevention has been shown to reduce API security vulnerabilities by over 50%.
- This focus on automated threat detection and robust data handling policies significantly strengthens an organization's overall cloud security posture and its ability to respond to a cybersecurity data breach.
We can help! Our analysts can customize this data exfiltration market research report to meet your requirements.
 RIA -
RIA - 
