Diagnostic Imaging Market - North America, Europe, EMEA, APAC : US, Canada, China, Germany, UK - Forecast 2023-2027

Diagnostic Imaging Market - North America, Europe, EMEA, APAC:
US, Canada, China, Germany, UK - Forecast 2023-2027

Published: Dec 2022 181 Pages SKU: IRTNTR71139

Market Overview at a Glance

$8.69 B
Market Opportunity
5.93%
CAGR
5.38
YoY growth 2022-2023(%)

Diagnostic Imaging Market Size 2023-2027

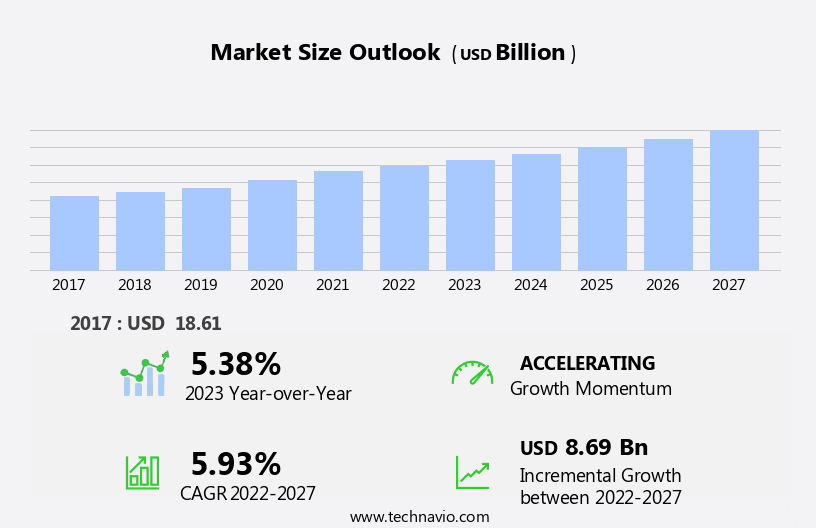
The diagnostic imaging market size is forecast to increase by USD 8.69 billion at a CAGR of 5.93% between 2022 and 2027. The market In the US is witnessing robust growth due to several key factors. The increasing prevalence of chronic conditions necessitates frequent imaging examinations, fueling market expansion. Technological advancements and continuous upgrades in diagnostic imaging modalities offer improved accuracy, efficiency, and patient comfort, making them increasingly popular. Furthermore, mergers and acquisitions (M&A) activities among industry players are on the rise, consolidating market presence and enhancing product portfolios. This growth trajectory is driven by the evolving needs of consumers and healthcare providers. There is a growing demand for innovative solutions that cater to the increasing complexity of medical conditions and the need for faster, more accurate diagnoses. The industry is responding by investing in research and development, focusing on creating more efficient systems, and prioritizing better accessibility. Moreover, there is a shift towards sustainability and operational efficiency as a means of maintaining a competitive edge.

What will be the size of the market during the forecast period?

Diagnostic Imaging Market Size

Request Free Sample

Diagnostic Imaging Market Segmentation

The diagnostic imaging market research report provides comprehensive data (region-wise segment analysis), with forecasts and estimates in "USD billion" for the period 2023-2027, as well as historical data from 2017 - 2021 for the following segments.
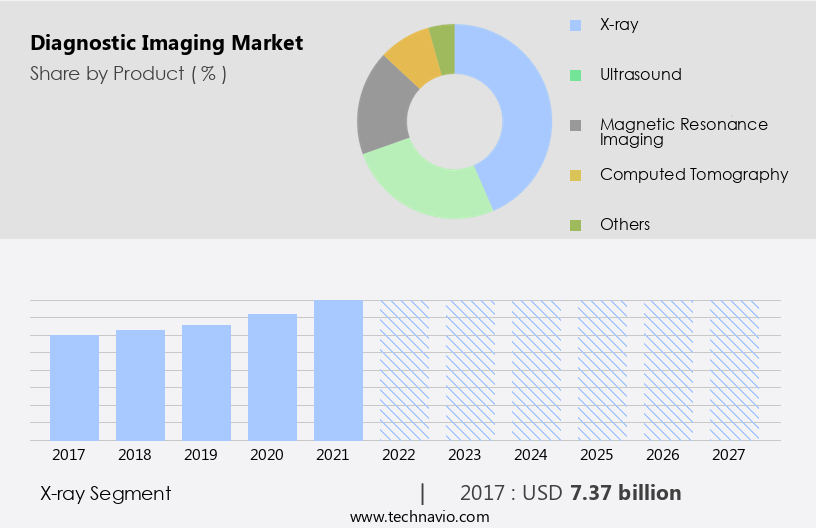
  • Product
    • X-ray
    • Ultrasound
    • Magnetic resonance imaging
    • Computed tomography
    • Others
  • End-user
    • Hospitals and clinics
    • Diagnostic centers
    • Research laboratories and institutes
    • Others
  • Geography
    • North America
      • US
    • Europe
      • Germany
      • UK
    • Asia
      • China
      • Japan
    • Rest of World (ROW)

Which is the largest segment driving market growth?

The x-ray segment is estimated to witness significant growth during the forecast period.

The market, encompassing X-ray, Magnetic Resonance (MRI), Computed Tomography (CT), Ultrasound, and Molecular Imaging, is witnessing significant growth, particularly In the digital X-ray systems segment. This expansion is driven by the adoption of advanced imaging modalities in developed regions, including North America and Europe. Early detection tools, such as AI-enabled diagnostic equipment and state-of-the-art imaging technologies from companies like Siemens Healthineers, are crucial in addressing chronic diseases, including cardiovascular disorders and neurology disorders. The Indian government's initiatives, like X-Ray Setu, aim to improve radiology operations and increase accessibility to diagnostic services. Turnaround time is another critical factor, with teleradiology services and AI platforms, such as Google's DeepMind, streamlining the diagnostic process.

The CT market, including ultrasound and advanced ultrasound transducers, portable ultrasound devices, and surgical suits, is also experiencing growth. Age-related macular degeneration and orthopedic disorders are among the conditions being diagnosed using computer vision and optical CT scanners. Despite the economic setback, the market is expected to continue its growth trajectory.

Diagnostic Imaging Market Size

Get a glance at the market share of various regions. Download the PDF Sample

The X-ray segment was valued at USD 7.37 billion in 2017 and showed a gradual increase during the forecast period.

Which region is leading the market?

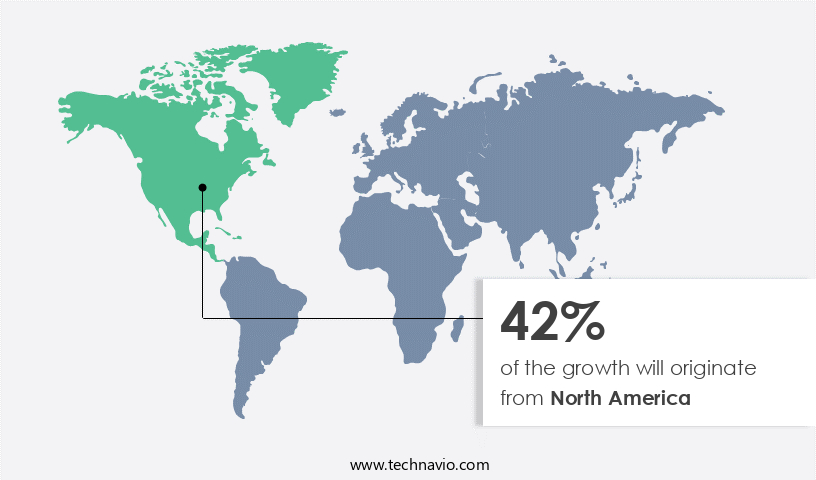
North America is estimated to contribute 42% to the growth of the global market during the forecast period.

Diagnostic Imaging Market Share by Geography

For more insights on the market share of various regions, Request Free Sample

Technavio's analysts have elaborately explained the regional trends and drivers that shape the market during the forecast period.The market in North America is projected to expand at a steady pace due to several factors. Chronic diseases, such as cardiovascular disorders and neurology disorders, are on the rise, necessitating frequent diagnostic imaging. Technological advancements, including AI-enabled diagnostic equipment and state-of-the-art imaging modalities like magnetic resonance imaging (MRI), computed tomography (CT), and X-ray, are enhancing clinical capabilities and driving market growth. Early detection tools, such as Google's DeepMind and Moorfields Eye Hospital's Optical CT scanner, are reducing turnaround times and improving diagnostic accuracy. Government initiatives, like X-Ray Setu in India, are increasing access to diagnostic imaging services. The Ultrasound segment, including advanced ultrasound transducers and portable ultrasound devices, is gaining popularity due to their affordability and mobility.

Hospitals, teaching institutions, and surgical suits are significant end-users of diagnostic imaging technologies. The Computed Tomography market is expected to grow, with product launches from industry leaders like Siemens Healthineers and their Cardiovascular ultrasound portfolio, including the Affiniti CVx. Despite the economic setback, the demand for diagnostic imaging services remains strong due to the importance of timely and accurate diagnosis. Teleradiology services are also gaining traction, allowing for remote diagnosis and reducing the need for physical presence at hospitals. Molecular imaging and orthopedic disorders are other emerging applications for diagnostic imaging technologies.

How do company ranking index and market positioning come to your aid?

Companies are implementing various strategies, such as strategic alliances, partnerships, mergers and acquisitions, geographical expansion, and product/service launches, to enhance their presence In the market.

Agfa Gevaert NV - The company specializes in diagnostic imaging technology, providing innovative solutions including mobile Digital Radiography (DR), Uarm DR, and floormounted DR systems. These advanced imaging tools enable healthcare professionals to obtain high-quality diagnostic images, enhancing patient care and improving clinical outcomes.

Technavio's diagnostic imaging market research and growth report provides the ranking index for the top 20 companies along with insights on the market positioning of: 

  • Agfa Gevaert NV
  • Allengers Medical Systems Ltd.
  • BCL XRay Canada Inc.
  • Carestream Health Inc.
  • CurveBeam AI Ltd.
  • Esaote Spa
  • Fujifilm Corp.
  • General Electric Co.
  • Hitachi Ltd.
  • Hologic Inc.
  • Konica Minolta Inc.
  • Mediso Ltd.
  • Neusoft Corp.
  • Northrop Grumman Corp.
  • Planmeca Oy
  • Shenzhen Mindray BioMedical Electronics
  • Shimadzu Corp.
  • Siemens AG
  • SternMed GmbH
  • Thales Group

Explore our company rankings and market positioning. Request Free Sample

What is the market structure and year-over-year growth of the Diagnostic Imaging Market?

Market structure

Fragmented

YoY growth 2022-2023

5.38

Diagnostic Imaging Market Dynamics

The market encompasses a range of technologies and modalities, including X-ray, ultrasound, computed tomography (CT), and magnetic resonance imaging (MRI), among others. This market is driven by the growing demand for early detection and accurate diagnosis of various medical conditions. Advanced imaging modalities, such as state-of-the-art CT scanners and MRI machines, are increasingly being adopted to improve diagnostic accuracy and turnaround time. Artificial intelligence (AI) and machine learning algorithms are also gaining traction in diagnostic imaging, enabling faster and more accurate analysis of medical images. The market is witnessing significant innovation, with companies investing in R&D to expand their product portfolios and enhance their market position.

The ultrasound segment is expected to dominate the market due to its affordability and versatility. However, economic setbacks and regulatory challenges may impact market growth. Teleradiology services and AI platforms are emerging trends, enabling remote diagnosis and analysis of medical images, respectively. Despite these challenges, the market is projected to grow steadily, driven by the increasing prevalence of chronic diseases and the need for early and accurate diagnosis.

Our researchers analyzed the data with 2022 as the base year, along with the key drivers, trends, and challenges. A holistic analysis of drivers will help companies refine their marketing strategies to gain a competitive advantage.

What are the primary factors driving the market growth?

Increasing prevalence of chronic conditions is the key driver of the market.

The market is driven by the rising prevalence of chronic conditions, including cancer and cardiovascular diseases. According to the International Agency for Research on Cancer, the age-adjusted rate of new cancer cases was 19.3 million in 2020. Additionally, the incidence of respiratory diseases, such as COPD, asthma, and lung cancer, is increasing globally. Early detection of these conditions is crucial, leading to a growing demand for advanced diagnostic tools. Turning to technology, state-of-the-art imaging modalities, such as X-ray, magnetic resonance imaging (MRI), computed tomography (CT), and ultrasound, are increasingly being adopted for their ability to provide accurate and timely diagnoses.

Market leaders, like Siemens Healthineers, are investing in AI-enabled diagnostic equipment, such as the Affiniti CVx cardiovascular ultrasound system, to enhance radiology operations and improve turnaround time. Google's Deepmind and Moorfields Eye Hospital have collaborated to develop an AI platform for the diagnosis of age-related macular degeneration using optical CT scanners. AI-enabled imaging technologies are also being used for the detection and diagnosis of neurological disorders, such as Alzheimer's disease and Parkinson's disease. The economic setback caused by the pandemic has led to an increased focus on cost-effective solutions, including refurbished equipment and teleradiology services. However, product recalls and concerns regarding the safety and efficacy of some imaging modalities, such as molecular imaging and orthopedic disorders, may pose challenges to the market.

In conclusion, the market is expected to grow significantly due to the increasing prevalence of chronic diseases and the adoption of advanced imaging technologies, such as AI-enabled diagnostic equipment and MRI. However, challenges, such as product recalls and safety concerns, may impact market growth.

What are the significant market trends being witnessed?

Integration of AI with diagnostic imaging is the upcoming market trend.

Diagnostic imaging is a critical component of healthcare, providing valuable insights into various health conditions through X-rays, CT scans, magnetic resonance imaging (MRI), and other modalities. The integration of artificial intelligence (AI) into diagnostic imaging is revolutionizing the industry by automating complex procedures, enhancing equipment features, and improving patient outcomes. AI-enabled diagnostic equipment, such as Siemens Healthineers' Cardiovascular ultrasound portfolio with the Affiniti CVx system, enables early detection and diagnosis of chronic diseases like cardiovascular disorders and neurology disorders. The analysis of diagnostic imaging data can be challenging, even for experienced professionals. AI platforms, like Google's Deepmind, and computer vision technologies, help increase productivity, improve accuracy, and reduce errors in diagnosis.

Moreover, AI-enabled imaging technologies on Google Cloud facilitate remote diagnosis through teleradiology services, enabling faster turnaround times and better access to care. The market for diagnostic imaging is driven by the increasing prevalence of chronic diseases and the need for state-of-the-art imaging modalities, such as optical CT scanners and advanced ultrasound transducers. The refurbished equipment market also plays a role in making diagnostic imaging more accessible and cost-effective. However, product recalls and concerns regarding data privacy and security may pose challenges to the market's growth. In summary, the integration of AI into diagnostic imaging is transforming the healthcare industry by improving diagnostic accuracy, reducing turnaround times, and enhancing patient outcomes.

The market for diagnostic imaging is expected to grow due to the increasing prevalence of chronic diseases and the need for advanced imaging technologies. However, challenges such as product recalls and data privacy concerns may impact market growth.

What are the major market challenges?

High costs associated with diagnostic imaging is a key challenge affecting the industry growth.

Diagnostic imaging is a critical sector in healthcare, offering early detection tools for various chronic diseases, including cardiovascular disorders and neurology disorders. However, the high cost of diagnostic imaging equipment and procedures is a significant challenge for market growth. For instance, an MRI machine can cost between USD150,000 and USD300,000, with additional expenses for remodeling, installation, and annual maintenance. These costs can burden hospitals, diagnostic centers, and clinics, potentially limiting access to state-of-the-art imaging modalities such as magnetic resonance imaging, computed tomography, and X-ray. The Indian market, represented by initiatives like X-Ray Setu, is exploring innovative solutions to address affordability concerns.

For example, the Government of India's collaboration with Siemens Healthineers and Moorfields Eye Hospital has led to the development of AI-enabled diagnostic equipment like the Affiniti CVx. This collaboration also includes the use of Google's Deepmind for computer vision applications in age-related macular degeneration diagnosis. Moreover, teleradiology services and advanced ultrasound transducers in portable ultrasound devices offer cost-effective alternatives for hospitals and clinics. The Computed Tomography market and Ultrasound segment are expected to grow due to the increasing demand for non-invasive diagnostic procedures. However, product recalls and the refurbished equipment market pose challenges to market growth. The integration of AI platforms in diagnostic imaging technologies from Google Cloud and other market players is expected to revolutionize the industry, offering faster turnaround times and improved accuracy.

In conclusion, the market faces challenges due to high equipment costs, but innovative solutions like AI-enabled imaging technologies and cost-effective alternatives are driving growth. The market dynamics are influenced by factors such as the increasing prevalence of chronic diseases, the need for early detection, and advancements in imaging technologies.

Exclusive Customer Landscape

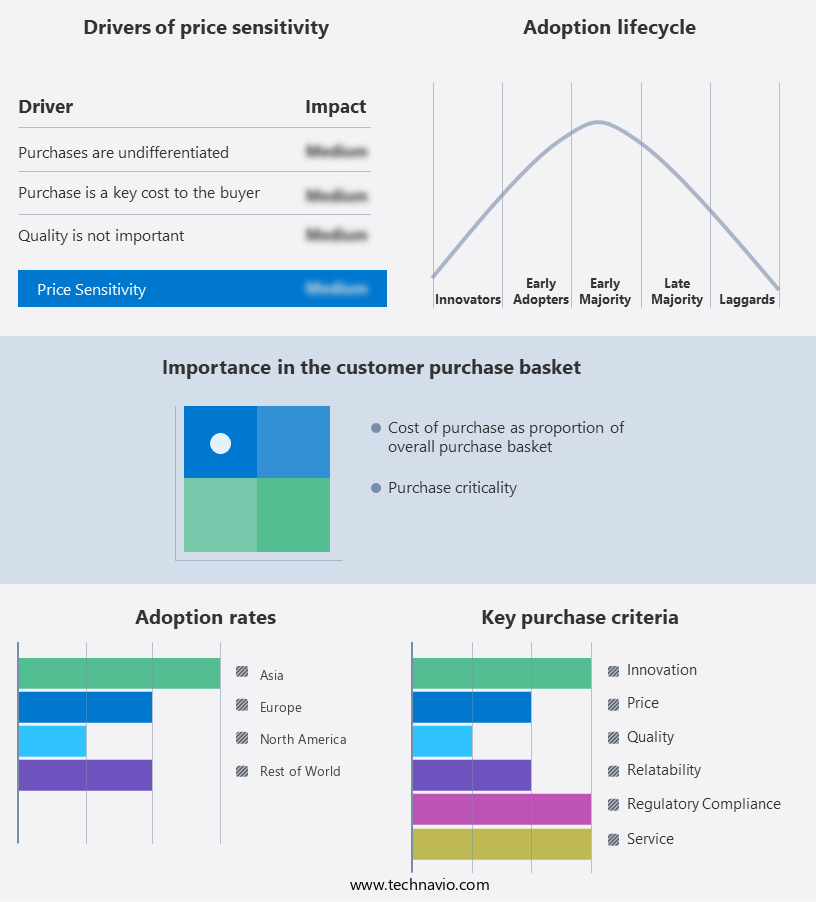
The diagnostic imaging market forecasting report includes the adoption lifecycle of the market, covering from the innovator's stage to the laggard's stage. It focuses on adoption rates in different regions based on penetration. Furthermore, the diagnostic imaging market report also includes key purchase criteria and drivers of price sensitivity to help companies evaluate and develop their market growth analysis strategies.

Diagnostic Imaging Market Share by Geography

 Customer Landscape

Market Analyst Overview

Diagnostic imaging plays a crucial role In the healthcare industry, enabling medical professionals to identify and treat various health conditions. The market for diagnostic imaging technologies continues to evolve, driven by advancements in technology and increasing demand for early detection and accurate diagnosis. One significant trend In the market is the emphasis on reducing turnaround times. Early detection tools are becoming increasingly important, as they allow for timely intervention and improved patient outcomes. State-of-the-art imaging modalities, such as magnetic resonance imaging (MRI), computed tomography (CT), and x-ray, are being utilized to provide clear and detailed images for accurate diagnosis.

Artificial intelligence (AI) is another key trend in diagnostic imaging, with various companies investing in AI platforms to enhance their product offerings. These AI-enabled diagnostic equipment are designed to improve efficiency, accuracy, and productivity in radiology operations. For instance, AI algorithms can be used to analyze medical images and identify patterns that may be indicative of certain conditions, such as cardiovascular disorders or neurology disorders. Google's DeepMind is one of the companies leading the way in AI-enabled imaging technologies. Their collaboration with Moorfields Eye Hospital in London has resulted in an optical CT scanner that uses AI to detect age-related macular degeneration.

This breakthrough has the potential to revolutionize the diagnosis and treatment of this condition, which affects millions of people worldwide. Another trend in diagnostic imaging is the adoption of teleradiology services, which allow radiologists to remotely review and interpret images from various locations. This is particularly useful in rural areas or developing regions, where access to specialized medical expertise may be limited. The market for diagnostic imaging technologies is diverse and includes various segments, such as MRI, CT, x-ray, ultrasound, molecular imaging, and orthopedic disorders. Each segment has its unique challenges and opportunities, with advanced ultrasound transducers and portable ultrasound devices being notable trends In the ultrasound segment.

The economic setback caused by the pandemic has led to increased focus on cost-effective solutions, such as refurbished equipment and product recalls. The refurbished equipment market is expected to grow significantly In the coming years, as hospitals and diagnostic centers look for affordable alternatives to new equipment. In conclusion, the market is dynamic and evolving, driven by various trends, including early detection, AI, and cost-effective solutions. The market is diverse, with various segments catering to different medical needs. As the demand for accurate and timely diagnosis continues to grow, diagnostic imaging technologies will remain a critical component of the healthcare industry.

Market Scope

Report Coverage

Details

Page number

181

Base year

2022

Historic period

2017 - 2021

Forecast period

2023-2027

Growth momentum & CAGR

Accelerate at a CAGR of 5.93%

Market growth 2023-2027

USD 8.69 billion

Regional analysis

North America, Europe, Asia, and Rest of World (ROW)

Performing market contribution

North America at 42%

Key countries

US, Germany, UK, China, and Japan

Competitive landscape

Leading Companies, Market Positioning of Companies, Competitive Strategies, and Industry Risks

Key companies profiled

Agfa Gevaert NV, Allengers Medical Systems Ltd., BCL XRay Canada Inc., Carestream Health Inc., CurveBeam AI Ltd., Esaote Spa, Fujifilm Corp., General Electric Co., Hitachi Ltd., Hologic Inc., Konica Minolta Inc., Mediso Ltd., Neusoft Corp., Northrop Grumman Corp., Planmeca Oy, Shenzhen Mindray BioMedical Electronics, Shimadzu Corp., Siemens AG, SternMed GmbH, and Thales Group

Market Segmentation

Product (X-ray, Ultrasound, Magnetic resonance imaging, Computed tomography, and Others), End-user (Hospitals and clinics, Diagnostic centers, Research laboratories and institutes, and Others), and Geography (North America, Europe, Asia, and Rest of World (ROW))

Customization purview

If our diagnostic imaging market forecast report has not included the data that you are looking for, you can reach out to our analysts and get segments customized.

Download PDF Sample

What are the Key Data Covered in this Diagnostic Imaging Market Research Report?

  • CAGR of the market during the forecast period
  • Detailed information on factors that will drive the market growth and forecasting between 2023 and 2027
  • Precise estimation of the size of the market  and its contribution of the market in focus to the parent market
  • Accurate predictions about upcoming market growth and trends and changes in consumer behavior
  • Growth of the market across North America, Europe, Asia, and Rest of World (ROW)
  • Thorough analysis of the market's competitive landscape and detailed information about companies
  • Comprehensive analysis of factors that will challenge the growth of market companies

1 Executive Summary

  • 1.1 Market overview
    • Exhibit 01: Executive Summary – Chart on Market Overview
    • Exhibit 02: Executive Summary – Data Table on Market Overview
    • Exhibit 03: Executive Summary – Chart on Global Market Characteristics
    • Exhibit 04: Executive Summary – Chart on Market by Geography
    • Exhibit 05: Executive Summary – Chart on Market Segmentation by Product
    • Exhibit 06: Executive Summary – Chart on Market Segmentation by End-user
    • Exhibit 07: Executive Summary – Chart on Incremental Growth
    • Exhibit 08: Executive Summary – Data Table on Incremental Growth
    • Exhibit 09: Executive Summary – Chart on Vendor Market Positioning

2 Market Landscape

  • 2.1 Market ecosystem
    • Exhibit 10: Parent market
    • Exhibit 11: Market Characteristics

3 Market Sizing

  • 3.1 Market definition
    • Exhibit 12: Offerings of vendors included in the market definition
  • 3.2 Market segment analysis
    • Exhibit 13: Market segments
  • 3.3 Market size 2022
    • 3.4 Market outlook: Forecast for 2022-2027
      • Exhibit 14: Chart on Global - Market size and forecast 2022-2027 ($ million)
      • Exhibit 15: Data Table on Global - Market size and forecast 2022-2027 ($ million)
      • Exhibit 16: Chart on Global Market: Year-over-year growth 2022-2027 (%)
      • Exhibit 17: Data Table on Global Market: Year-over-year growth 2022-2027 (%)

    4 Historic Market Size

    • 4.1 Global diagnostic imaging market 2017 - 2021
      • Exhibit 18: Historic Market Size – Data Table on Global diagnostic imaging market 2017 - 2021 ($ million)
    • 4.2 Product Segment Analysis 2017 - 2021
      • Exhibit 19: Historic Market Size – Product Segment 2017 - 2021 ($ million)
    • 4.3 End-user Segment Analysis 2017 - 2021
      • Exhibit 20: Historic Market Size – End-user Segment 2017 - 2021 ($ million)
    • 4.4 Geography Segment Analysis 2017 - 2021
      • Exhibit 21: Historic Market Size – Geography Segment 2017 - 2021 ($ million)
    • 4.5 Country Segment Analysis 2017 - 2021
      • Exhibit 22: Historic Market Size – Country Segment 2017 - 2021 ($ million)

    5 Five Forces Analysis

    • 5.1 Five forces summary
      • Exhibit 23: Five forces analysis - Comparison between 2022 and 2027
    • 5.2 Bargaining power of buyers
      • Exhibit 24: Chart on Bargaining power of buyers – Impact of key factors 2022 and 2027
    • 5.3 Bargaining power of suppliers
      • Exhibit 25: Bargaining power of suppliers – Impact of key factors in 2022 and 2027
    • 5.4 Threat of new entrants
      • Exhibit 26: Threat of new entrants – Impact of key factors in 2022 and 2027
    • 5.5 Threat of substitutes
      • Exhibit 27: Threat of substitutes – Impact of key factors in 2022 and 2027
    • 5.6 Threat of rivalry
      • Exhibit 28: Threat of rivalry – Impact of key factors in 2022 and 2027
    • 5.7 Market condition
      • Exhibit 29: Chart on Market condition - Five forces 2022 and 2027

    6 Market Segmentation by Product

    • 6.1 Market segments
      • Exhibit 30: Chart on Product - Market share 2022-2027 (%)
      • Exhibit 31: Data Table on Product - Market share 2022-2027 (%)
    • 6.2 Comparison by Product
      • Exhibit 32: Chart on Comparison by Product
      • Exhibit 33: Data Table on Comparison by Product
    • 6.3 X-ray - Market size and forecast 2022-2027
      • Exhibit 34: Chart on X-ray - Market size and forecast 2022-2027 ($ million)
      • Exhibit 35: Data Table on X-ray - Market size and forecast 2022-2027 ($ million)
      • Exhibit 36: Chart on X-ray - Year-over-year growth 2022-2027 (%)
      • Exhibit 37: Data Table on X-ray - Year-over-year growth 2022-2027 (%)
    • 6.4 Ultrasound - Market size and forecast 2022-2027
      • Exhibit 38: Chart on Ultrasound - Market size and forecast 2022-2027 ($ million)
      • Exhibit 39: Data Table on Ultrasound - Market size and forecast 2022-2027 ($ million)
      • Exhibit 40: Chart on Ultrasound - Year-over-year growth 2022-2027 (%)
      • Exhibit 41: Data Table on Ultrasound - Year-over-year growth 2022-2027 (%)
    • 6.5 Magnetic resonance imaging - Market size and forecast 2022-2027
      • Exhibit 42: Chart on Magnetic resonance imaging - Market size and forecast 2022-2027 ($ million)
      • Exhibit 43: Data Table on Magnetic resonance imaging - Market size and forecast 2022-2027 ($ million)
      • Exhibit 44: Chart on Magnetic resonance imaging - Year-over-year growth 2022-2027 (%)
      • Exhibit 45: Data Table on Magnetic resonance imaging - Year-over-year growth 2022-2027 (%)
    • 6.6 Computed tomography - Market size and forecast 2022-2027
      • Exhibit 46: Chart on Computed tomography - Market size and forecast 2022-2027 ($ million)
      • Exhibit 47: Data Table on Computed tomography - Market size and forecast 2022-2027 ($ million)
      • Exhibit 48: Chart on Computed tomography - Year-over-year growth 2022-2027 (%)
      • Exhibit 49: Data Table on Computed tomography - Year-over-year growth 2022-2027 (%)
    • 6.7 Others - Market size and forecast 2022-2027
      • Exhibit 50: Chart on Others - Market size and forecast 2022-2027 ($ million)
      • Exhibit 51: Data Table on Others - Market size and forecast 2022-2027 ($ million)
      • Exhibit 52: Chart on Others - Year-over-year growth 2022-2027 (%)
      • Exhibit 53: Data Table on Others - Year-over-year growth 2022-2027 (%)
    • 6.8 Market opportunity by Product
      • Exhibit 54: Market opportunity by Product ($ million)

    7 Market Segmentation by End-user

    • 7.1 Market segments
      • Exhibit 55: Chart on End-user - Market share 2022-2027 (%)
      • Exhibit 56: Data Table on End-user - Market share 2022-2027 (%)
    • 7.2 Comparison by End-user
      • Exhibit 57: Chart on Comparison by End-user
      • Exhibit 58: Data Table on Comparison by End-user
    • 7.3 Hospitals and clinics - Market size and forecast 2022-2027
      • Exhibit 59: Chart on Hospitals and clinics - Market size and forecast 2022-2027 ($ million)
      • Exhibit 60: Data Table on Hospitals and clinics - Market size and forecast 2022-2027 ($ million)
      • Exhibit 61: Chart on Hospitals and clinics - Year-over-year growth 2022-2027 (%)
      • Exhibit 62: Data Table on Hospitals and clinics - Year-over-year growth 2022-2027 (%)
    • 7.4 Diagnostic centers - Market size and forecast 2022-2027
      • Exhibit 63: Chart on Diagnostic centers - Market size and forecast 2022-2027 ($ million)
      • Exhibit 64: Data Table on Diagnostic centers - Market size and forecast 2022-2027 ($ million)
      • Exhibit 65: Chart on Diagnostic centers - Year-over-year growth 2022-2027 (%)
      • Exhibit 66: Data Table on Diagnostic centers - Year-over-year growth 2022-2027 (%)
    • 7.5 Research laboratories and institutes - Market size and forecast 2022-2027
      • Exhibit 67: Chart on Research laboratories and institutes - Market size and forecast 2022-2027 ($ million)
      • Exhibit 68: Data Table on Research laboratories and institutes - Market size and forecast 2022-2027 ($ million)
      • Exhibit 69: Chart on Research laboratories and institutes - Year-over-year growth 2022-2027 (%)
      • Exhibit 70: Data Table on Research laboratories and institutes - Year-over-year growth 2022-2027 (%)
    • 7.6 Others - Market size and forecast 2022-2027
      • Exhibit 71: Chart on Others - Market size and forecast 2022-2027 ($ million)
      • Exhibit 72: Data Table on Others - Market size and forecast 2022-2027 ($ million)
      • Exhibit 73: Chart on Others - Year-over-year growth 2022-2027 (%)
      • Exhibit 74: Data Table on Others - Year-over-year growth 2022-2027 (%)
    • 7.7 Market opportunity by End-user
      • Exhibit 75: Market opportunity by End-user ($ million)

    8 Customer Landscape

    • 8.1 Customer landscape overview
      • Exhibit 76: Analysis of price sensitivity, lifecycle, customer purchase basket, adoption rates, and purchase criteria

    9 Geographic Landscape

    • 9.1 Geographic segmentation
      • Exhibit 77: Chart on Market share by geography 2022-2027 (%)
      • Exhibit 78: Data Table on Market share by geography 2022-2027 (%)
    • 9.2 Geographic comparison
      • Exhibit 79: Chart on Geographic comparison
      • Exhibit 80: Data Table on Geographic comparison
    • 9.3 North America - Market size and forecast 2022-2027
      • Exhibit 81: Chart on North America - Market size and forecast 2022-2027 ($ million)
      • Exhibit 82: Data Table on North America - Market size and forecast 2022-2027 ($ million)
      • Exhibit 83: Chart on North America - Year-over-year growth 2022-2027 (%)
      • Exhibit 84: Data Table on North America - Year-over-year growth 2022-2027 (%)
    • 9.4 Europe - Market size and forecast 2022-2027
      • Exhibit 85: Chart on Europe - Market size and forecast 2022-2027 ($ million)
      • Exhibit 86: Data Table on Europe - Market size and forecast 2022-2027 ($ million)
      • Exhibit 87: Chart on Europe - Year-over-year growth 2022-2027 (%)
      • Exhibit 88: Data Table on Europe - Year-over-year growth 2022-2027 (%)
    • 9.5 Asia - Market size and forecast 2022-2027
      • Exhibit 89: Chart on Asia - Market size and forecast 2022-2027 ($ million)
      • Exhibit 90: Data Table on Asia - Market size and forecast 2022-2027 ($ million)
      • Exhibit 91: Chart on Asia - Year-over-year growth 2022-2027 (%)
      • Exhibit 92: Data Table on Asia - Year-over-year growth 2022-2027 (%)
    • 9.6 Rest of World (ROW) - Market size and forecast 2022-2027
      • Exhibit 93: Chart on Rest of World (ROW) - Market size and forecast 2022-2027 ($ million)
      • Exhibit 94: Data Table on Rest of World (ROW) - Market size and forecast 2022-2027 ($ million)
      • Exhibit 95: Chart on Rest of World (ROW) - Year-over-year growth 2022-2027 (%)
      • Exhibit 96: Data Table on Rest of World (ROW) - Year-over-year growth 2022-2027 (%)
    • 9.7 US - Market size and forecast 2022-2027
      • Exhibit 97: Chart on US - Market size and forecast 2022-2027 ($ million)
      • Exhibit 98: Data Table on US - Market size and forecast 2022-2027 ($ million)
      • Exhibit 99: Chart on US - Year-over-year growth 2022-2027 (%)
      • Exhibit 100: Data Table on US - Year-over-year growth 2022-2027 (%)
    • 9.8 China - Market size and forecast 2022-2027
      • Exhibit 101: Chart on China - Market size and forecast 2022-2027 ($ million)
      • Exhibit 102: Data Table on China - Market size and forecast 2022-2027 ($ million)
      • Exhibit 103: Chart on China - Year-over-year growth 2022-2027 (%)
      • Exhibit 104: Data Table on China - Year-over-year growth 2022-2027 (%)
    • 9.9 Japan - Market size and forecast 2022-2027
      • Exhibit 105: Chart on Japan - Market size and forecast 2022-2027 ($ million)
      • Exhibit 106: Data Table on Japan - Market size and forecast 2022-2027 ($ million)
      • Exhibit 107: Chart on Japan - Year-over-year growth 2022-2027 (%)
      • Exhibit 108: Data Table on Japan - Year-over-year growth 2022-2027 (%)
    • 9.10 Germany - Market size and forecast 2022-2027
      • Exhibit 109: Chart on Germany - Market size and forecast 2022-2027 ($ million)
      • Exhibit 110: Data Table on Germany - Market size and forecast 2022-2027 ($ million)
      • Exhibit 111: Chart on Germany - Year-over-year growth 2022-2027 (%)
      • Exhibit 112: Data Table on Germany - Year-over-year growth 2022-2027 (%)
    • 9.11 UK - Market size and forecast 2022-2027
      • Exhibit 113: Chart on UK - Market size and forecast 2022-2027 ($ million)
      • Exhibit 114: Data Table on UK - Market size and forecast 2022-2027 ($ million)
      • Exhibit 115: Chart on UK - Year-over-year growth 2022-2027 (%)
      • Exhibit 116: Data Table on UK - Year-over-year growth 2022-2027 (%)
    • 9.12 Market opportunity by geography
      • Exhibit 117: Market opportunity by geography ($ million)

    10 Drivers, Challenges, and Trends

    • 10.1 Market drivers
      • 10.2 Market challenges
        • 10.3 Impact of drivers and challenges
          • Exhibit 118: Impact of drivers and challenges in 2022 and 2027
        • 10.4 Market trends

          11 Vendor Landscape

          • 11.1 Overview
            • 11.2 Vendor landscape
              • Exhibit 119: Overview on Criticality of inputs and Factors of differentiation
            • 11.3 Landscape disruption
              • Exhibit 120: Overview on factors of disruption
            • 11.4 Industry risks
              • Exhibit 121: Impact of key risks on business

            12 Vendor Analysis

            • 12.1 Vendors covered
              • Exhibit 122: Vendors covered
            • 12.2 Market positioning of vendors
              • Exhibit 123: Matrix on vendor position and classification
            • 12.3 Agfa Gevaert NV
              • Exhibit 124: Agfa Gevaert NV - Overview
              • Exhibit 125: Agfa Gevaert NV - Business segments
              • Exhibit 126: Agfa Gevaert NV - Key offerings
              • Exhibit 127: Agfa Gevaert NV - Segment focus
            • 12.4 Allengers Medical Systems Ltd.
              • Exhibit 128: Allengers Medical Systems Ltd. - Overview
              • Exhibit 129: Allengers Medical Systems Ltd. - Product / Service
              • Exhibit 130: Allengers Medical Systems Ltd. - Key offerings
            • 12.5 Carestream Health Inc.
              • Exhibit 131: Carestream Health Inc. - Overview
              • Exhibit 132: Carestream Health Inc. - Product / Service
              • Exhibit 133: Carestream Health Inc. - Key offerings
            • 12.6 CurveBeam AI Ltd.
              • Exhibit 134: CurveBeam AI Ltd. - Overview
              • Exhibit 135: CurveBeam AI Ltd. - Product / Service
              • Exhibit 136: CurveBeam AI Ltd. - Key offerings
            • 12.7 Esaote Spa
              • Exhibit 137: Esaote Spa - Overview
              • Exhibit 138: Esaote Spa - Product / Service
              • Exhibit 139: Esaote Spa - Key offerings
            • 12.8 Fujifilm Corp.
              • Exhibit 140: Fujifilm Corp. - Overview
              • Exhibit 141: Fujifilm Corp. - Product / Service
              • Exhibit 142: Fujifilm Corp. - Key offerings
            • 12.9 General Electric Co.
              • Exhibit 143: General Electric Co. - Overview
              • Exhibit 144: General Electric Co. - Business segments
              • Exhibit 145: General Electric Co. - Key news
              • Exhibit 146: General Electric Co. - Key offerings
              • Exhibit 147: General Electric Co. - Segment focus
            • 12.10 Hitachi Ltd.
              • Exhibit 148: Hitachi Ltd. - Overview
              • Exhibit 149: Hitachi Ltd. - Business segments
              • Exhibit 150: Hitachi Ltd. - Key news
              • Exhibit 151: Hitachi Ltd. - Key offerings
              • Exhibit 152: Hitachi Ltd. - Segment focus
            • 12.11 Hologic Inc.
              • Exhibit 153: Hologic Inc. - Overview
              • Exhibit 154: Hologic Inc. - Business segments
              • Exhibit 155: Hologic Inc. - Key news
              • Exhibit 156: Hologic Inc. - Key offerings
              • Exhibit 157: Hologic Inc. - Segment focus
            • 12.12 Konica Minolta Inc.
              • Exhibit 158: Konica Minolta Inc. - Overview
              • Exhibit 159: Konica Minolta Inc. - Business segments
              • Exhibit 160: Konica Minolta Inc. - Key news
              • Exhibit 161: Konica Minolta Inc. - Key offerings
              • Exhibit 162: Konica Minolta Inc. - Segment focus
            • 12.13 Mediso Ltd.
              • Exhibit 163: Mediso Ltd. - Overview
              • Exhibit 164: Mediso Ltd. - Product / Service
              • Exhibit 165: Mediso Ltd. - Key offerings
            • 12.14 Northrop Grumman Corp.
              • Exhibit 166: Northrop Grumman Corp. - Overview
              • Exhibit 167: Northrop Grumman Corp. - Business segments
              • Exhibit 168: Northrop Grumman Corp. - Key news
              • Exhibit 169: Northrop Grumman Corp. - Key offerings
              • Exhibit 170: Northrop Grumman Corp. - Segment focus
            • 12.15 Shimadzu Corp.
              • Exhibit 171: Shimadzu Corp. - Overview
              • Exhibit 172: Shimadzu Corp. - Business segments
              • Exhibit 173: Shimadzu Corp. - Key news
              • Exhibit 174: Shimadzu Corp. - Key offerings
              • Exhibit 175: Shimadzu Corp. - Segment focus
            • 12.16 Siemens AG
              • Exhibit 176: Siemens AG - Overview
              • Exhibit 177: Siemens AG - Business segments
              • Exhibit 178: Siemens AG - Key news
              • Exhibit 179: Siemens AG - Key offerings
              • Exhibit 180: Siemens AG - Segment focus
            • 12.17 Thales Group
              • Exhibit 181: Thales Group - Overview
              • Exhibit 182: Thales Group - Business segments
              • Exhibit 183: Thales Group - Key offerings
              • Exhibit 184: Thales Group - Segment focus

            13 Appendix

            • 13.1 Scope of the report
              • 13.2 Inclusions and exclusions checklist
                • Exhibit 185: Inclusions checklist
                • Exhibit 186: Exclusions checklist
              • 13.3 Currency conversion rates for US$
                • Exhibit 187: Currency conversion rates for US$
              • 13.4 Research methodology
                • Exhibit 188: Research methodology
                • Exhibit 189: Validation techniques employed for market sizing
                • Exhibit 190: Information sources
              • 13.5 List of abbreviations
                • Exhibit 191: List of abbreviations

              Research Methodology

              Technavio presents a detailed picture of the market by way of study, synthesis, and summation of data from multiple sources. The analysts have presented the various facets of the market with a particular focus on identifying the key industry influencers. The data thus presented is comprehensive, reliable, and the result of extensive research, both primary and secondary.

              INFORMATION SOURCES

              Primary sources

              • Manufacturers and suppliers
              • Channel partners
              • Industry experts
              • Strategic decision makers

              Secondary sources

              • Industry journals and periodicals
              • Government data
              • Financial reports of key industry players
              • Historical data
              • Press releases

              DATA ANALYSIS

              Data Synthesis

              • Collation of data
              • Estimation of key figures
              • Analysis of derived insights

              Data Validation

              • Triangulation with data models
              • Reference against proprietary databases
              • Corroboration with industry experts

              REPORT WRITING

              Qualitative

              • Market drivers
              • Market challenges
              • Market trends
              • Five forces analysis

              Quantitative

              • Market size and forecast
              • Market segmentation
              • Geographical insights
              • Competitive landscape

              Interested in this report?

              Get your sample now to see our research methodology and insights!

              Download Now

              Frequently Asked Questions

              Diagnostic Imaging market growth will increase by $ 8.69 bn during 2023-2027.

              The Diagnostic Imaging market is expected to grow at a CAGR of 5.93% during 2023-2027.

              Diagnostic Imaging market is segmented by Product( X-ray, Ultrasound, Magnetic resonance imaging, Computed tomography, Others) End-user( Hospitals and clinics, Diagnostic centers, Research laboratories and institutes, Others)

              Agfa Gevaert NV, Allengers Medical Systems Ltd., BCL XRay Canada Inc., Carestream Health Inc., CurveBeam AI Ltd., Esaote Spa, Fujifilm Corp., General Electric Co., Hitachi Ltd., Hologic Inc., Konica Minolta Inc., Mediso Ltd., Neusoft Corp., Northrop Grumman Corp., Planmeca Oy, Shenzhen Mindray BioMedical Electronics, Shimadzu Corp., Siemens AG, SternMed GmbH, Thales Group are a few of the key vendors in the Diagnostic Imaging market.

              North America will register the highest growth rate of 41.98% among the other regions. Therefore, the Diagnostic Imaging market in North America is expected to garner significant business opportunities for the vendors during the forecast period.

              US, Germany, UK, China, Japan

              • Increasing prevalence of chronic conditionsDiagnostic imaging equipment is used for diagnosing severe and chronic conditions. In line with this is the driving factor this market.
              • the increasing prevalence of chronic conditions is the driving factor this market.
              • such as cancer is the driving factor this market.
              • cardiovascular diseases is the driving factor this market.
              • and neurological diseases is the driving factor this market.
              • is expected to trigger the demand for diagnostic products is the driving factor this market.
              • including medical imaging systems is the driving factor this market.
              • and subsequently drive the growth of the global diagnostic imaging market during the forecast period. The prevalence of cancer and cardiovascular diseases is growing across the world. For instance is the driving factor this market.
              • according to the International Agency for Research on Cancer is the driving factor this market.
              • in 2020 is the driving factor this market.
              • the age-adjusted rate of new cancer cases was 19.3 million. In addition is the driving factor this market.
              • globally is the driving factor this market.
              • the incidence of several respiratory diseases is the driving factor this market.
              • such as chronic obstructive pulmonary disease (COPD) is the driving factor this market.
              • asthma is the driving factor this market.
              • and lung cancer is the driving factor this market.
              • is increasing. In 2020 is the driving factor this market.
              • the global prevalence of COPD was approximately 3.4%. As of 2020 is the driving factor this market.
              • nearly 4.8% of the global population had asthma. The prevalence of asthma is increasing rapidly in low and middle-income countries is the driving factor this market.
              • especially those in Asia. As of 2019 is the driving factor this market.
              • 6% of children and 2% of adults in India were living with asthma. According to the CDC is the driving factor this market.
              • around 9 million adults in the US were diagnosed with chronic bronchitis in 2020. The CDC also reported that approximately 16 million people in the US were diagnosed with COPD is the driving factor this market.
              • which was the third-leading cause of death in the country in 2020. In 2020 is the driving factor this market.
              • the five commonly diagnosed cancer types were lung cancer is the driving factor this market.
              • breast cancer is the driving factor this market.
              • prostate cancer is the driving factor this market.
              • colorectal cancer is the driving factor this market.
              • and stomach cancer. These accounted for approximately 49% of all diagnosed cases of cancer. Among these cancers is the driving factor this market.
              • lung cancer and breast cancer accounted for the largest number of diagnosed cases. The prevalence of various types of cancers is increasing. Globally is the driving factor this market.
              • the number of diagnosed cancer cases is expected to increase from around 16.5 million to 21.3 million between 2017 and 2025. The high incidence of cancer is increasing the demand for cancer screening and diagnoses is the driving factor this market.
              • which is expected to drive the growth of the global diagnostic imaging market. Similarly is the driving factor this market.
              • the increasing prevalence of other chronic conditions is the driving factor this market.
              • such as cardiovascular diseases and neurological disorders is the driving factor this market.
              • will augment the demand for diagnostic imaging systems during the forecast period. is the driving factor this market.

              The Diagnostic Imaging market vendors should focus on grabbing business opportunities from the X-ray segment as it accounted for the largest market share in the base year.