
Digital Content Market Size 2026-2030
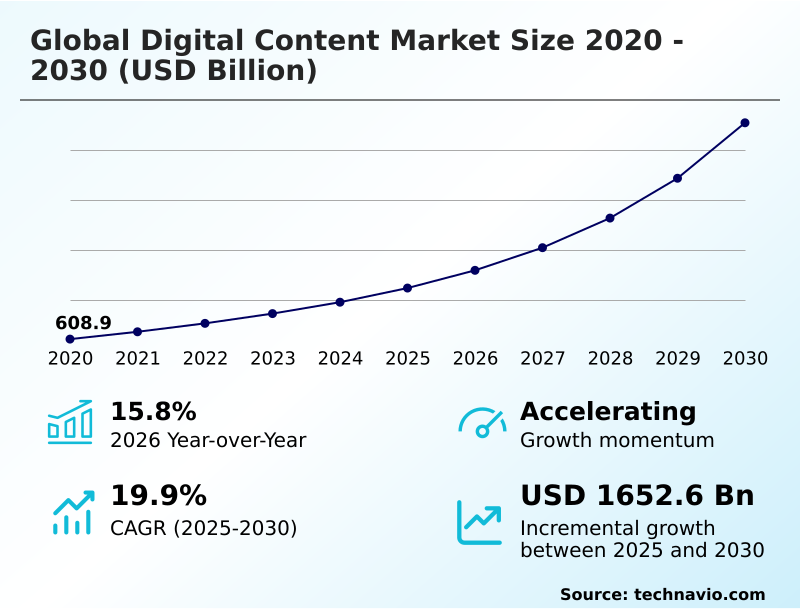
The digital content market size is valued to increase by USD 1652.6 billion, at a CAGR of 19.9% from 2025 to 2030. Rising digital transformation across sectors will drive the digital content market.
Major Market Trends & Insights
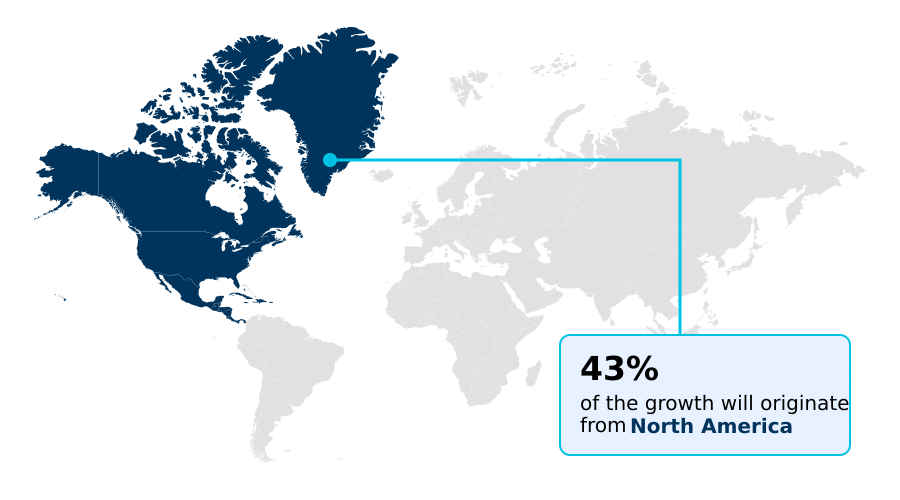
- North America dominated the market and accounted for a 43.4% growth during the forecast period.
- By Content Type - Digital video content segment was valued at USD 534.7 billion in 2024
- By Application - Smartphones segment accounted for the largest market revenue share in 2024
Market Size & Forecast
- Market Opportunities: USD 2163.2 billion
- Market Future Opportunities: USD 1652.6 billion
- CAGR from 2025 to 2030 : 19.9%
Market Summary
- The digital content market is defined by the rapid shift from traditional media to on-demand, interactive experiences accessible across a multitude of devices. This evolution is propelled by advancements in high-speed connectivity and the ubiquity of smartphones, which have become the primary gateway for consuming streaming media, digital publications, and user-generated content.
- A key dynamic is the increasing sophistication of content personalization, where AI-powered algorithms analyze user behavior to deliver tailored recommendations, enhancing engagement. For instance, an e-learning platform can leverage these systems to dynamically adjust curriculum delivery based on a student's performance, improving learning outcomes without direct instructor intervention.
- However, the industry grapples with challenges related to digital rights management and the high costs of producing premium, original content. The ongoing expansion of cloud gaming and augmented reality applications continues to create new revenue streams, pushing the boundaries of interactive entertainment and professional training.
- As the creator economy matures, monetization strategies are becoming more diverse, moving beyond simple advertising to include subscriptions and direct fan support, fostering a more sustainable ecosystem for both large studios and independent creators.
What will be the Size of the Digital Content Market during the forecast period?
Get Key Insights on Market Forecast (PDF) Get Free Sample
How is the Digital Content Market Segmented?
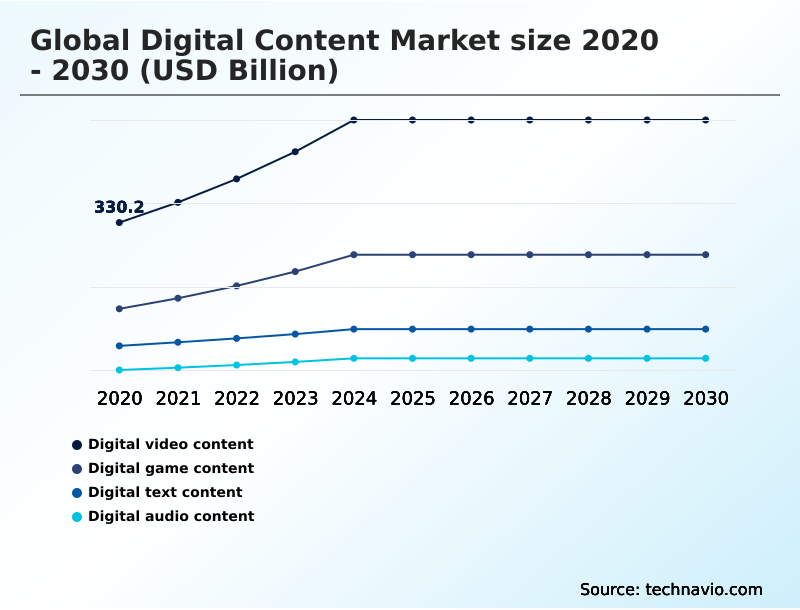
The digital content industry research report provides comprehensive data (region-wise segment analysis), with forecasts and estimates in "USD billion" for the period 2026-2030, as well as historical data from 2020-2024 for the following segments.
- Content type
- Digital video content
- Digital game content
- Digital text content
- Digital audio content
- Application
- Smartphones
- Computers
- Smart TV
- Others
- Deployment
- Cloud
- On-premises
- Geography
- North America
- US
- Canada
- Mexico
- Europe
- Germany
- UK
- France
- APAC
- China
- Japan
- India
- South America
- Brazil
- Argentina
- Colombia
- Middle East and Africa
- Saudi Arabia
- UAE
- South Africa
- Rest of World (ROW)
- North America
By Content Type Insights
The digital video content segment is estimated to witness significant growth during the forecast period.
The digital video content market is driven by the proliferation of streaming services and the rising popularity of user-generated content, especially short-form video.
The widespread availability of high-speed internet and high-resolution screens on mobile devices fuels demand for on-demand movies, original series, and interactive entertainment.
A major shift in consumption patterns is evident, with the ad-supported tier of one leading platform reaching over seventy million monthly active users, highlighting audience price sensitivity. Advanced post-production tools, AI-powered content curation, and content personalization are now standard.
This dynamic environment is further shaped by cloud deployment models and the ongoing integration of social commerce, pushing creators toward more engaging and visually compelling storytelling.
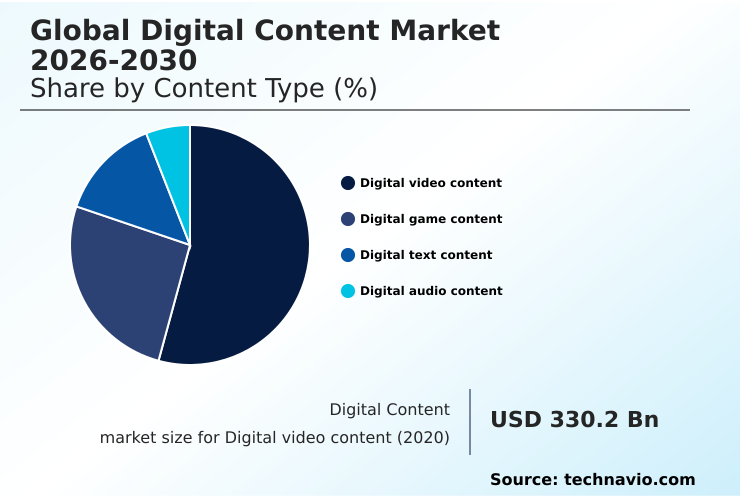
The Digital video content segment was valued at USD 534.7 billion in 2024 and showed a gradual increase during the forecast period.
Regional Analysis
North America is estimated to contribute 43.4% to the growth of the global market during the forecast period.Technavio’s analysts have elaborately explained the regional trends and drivers that shape the market during the forecast period.
See How Digital Content Market Demand is Rising in North America Get Free Sample
The geographic landscape of the digital content market is characterized by varied growth dynamics and mobile-first adoption trends.
The APAC region is a significant growth engine, expanding at a rate of 21.8%, driven by massive user bases and advancements in mobile payments.
This region is a leader in social commerce integration and has a high propensity for buyers to adopt new digital formats.
In contrast, North America, which accounts for over 43% of the market's incremental growth, is a mature market where subscription-based services and high-quality original content are paramount.
Europe emphasizes localized content and stringent data privacy, with platforms investing heavily to meet diverse cultural and regulatory demands.
Across all regions, the shift toward mobile content consumption is universal, with platform providers focusing on optimizing experiences for smaller screens and on-the-go viewing habits.
Market Dynamics
Our researchers analyzed the data with 2025 as the base year, along with the key drivers, trends, and challenges. A holistic analysis of drivers will help companies refine their marketing strategies to gain a competitive advantage.
- Navigating the complexities of the digital content market requires a deep understanding of evolving consumption patterns and monetization strategies. A critical consideration is the impact of 5G on digital content streaming, as it drastically reduces latency and enables high-fidelity experiences like cloud gaming and augmented reality.
- Simultaneously, trends in short-form video content are reshaping audience engagement, forcing platforms to prioritize mobile-first, visually compelling narratives. The role of AI in personalized content recommendations has become a cornerstone of user retention, with algorithms now capable of sophisticated behavioral analysis.
- This intersects with the ongoing challenges in digital content piracy, which necessitates robust digital rights management systems to protect intellectual property. As platforms explore new digital content monetization strategies, they must balance subscription models with advertising and microtransactions.
- The future of digital content creation is increasingly tied to immersive technologies, where the development of interactive VR and AR content offers new frontiers for storytelling. This is particularly relevant in educational and training sectors, where the use of AR in digital learning is demonstrating significant gains in knowledge retention.
- Furthermore, understanding the effective use of user-generated content in marketing is essential for brands seeking authentic connections with consumers. Analyzing the adoption of cloud gaming services reveals a shift from hardware dependency to access-based models, while the rise of podcasting and audio content offers alternative engagement channels that fit seamlessly into multitasking lifestyles.
- The market is also seeing digital video content adoption outpacing text-based formats by a factor of nearly four, influencing content strategy budgets significantly.
What are the key market drivers leading to the rise in the adoption of Digital Content Industry?
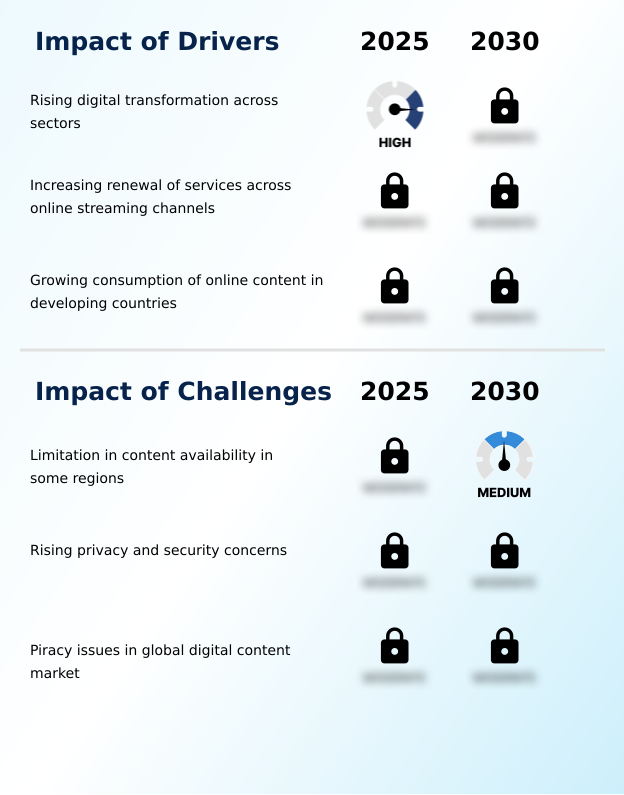
- The rising digital transformation across various sectors is a key driver fueling the growth of the digital content market.
- Digital transformation across industries is the primary engine for the market, as sectors from education to healthcare replace physical processes with digital solutions, boosting demand for electronic media.
- This is coupled with the growing consumption of online content, facilitated by widespread high-speed internet and the proliferation of affordable smartphones. Organizations that adopt digital training modules report a 30% improvement in employee skill retention.
- The continuous renewal of services on online streaming channels, including interface updates and the introduction of ad-supported tiers, is also crucial.
- These ad-supported models have been shown to expand the potential user base by up to 20% by attracting price-sensitive consumers. This relentless demand for new and engaging media, supported by enabling technologies like 5G, ensures a sustained growth trajectory.
What are the market trends shaping the Digital Content Industry?
- The increased utilization of social media platforms is a dominant trend. It is fundamentally reshaping how digital content is produced, discovered, and shared globally.
- The market is witnessing a profound shift driven by the increased utilization of social media and the expansion in content variety. The rise of the creator economy on platforms has democratized content production, where user-generated content often commands higher engagement than traditional media.
- This trend has led to a 25% increase in brands shifting advertising budgets toward influencer marketing for more authentic audience connections. Furthermore, the proliferation of mobile applications serves as the primary gateway for digital consumption, with app-based interactions showing 40% higher retention rates than mobile web.
- AI is also playing a crucial role in content discovery, with recommendation engines driving a significant portion of user engagement. This dynamic is fostering a hyper-personalized media environment where niche content thrives alongside mainstream productions.
What challenges does the Digital Content Industry face during its growth?
- The limited availability of content in certain regions, often due to complex licensing and geographic restrictions, poses a key challenge to the industry's growth.
- Key challenges shaping the market include rising privacy and security concerns, content availability limitations, and persistent piracy issues. The increasing volume of personal data collected by platforms has made them prime targets for cyberattacks, with compliance with diverse regulations like GDPR adding up to 15% to operational overhead for global platforms.
- Furthermore, complex licensing agreements create content fragmentation, a significant source of user frustration. Piracy continues to cause substantial revenue loss, devaluing creative work and making it difficult for independent artists to sustain their careers.
- These issues necessitate a unified approach to cybersecurity, innovative licensing models, and robust digital rights management (DRM) to ensure the long-term health and safety of the digital ecosystem.
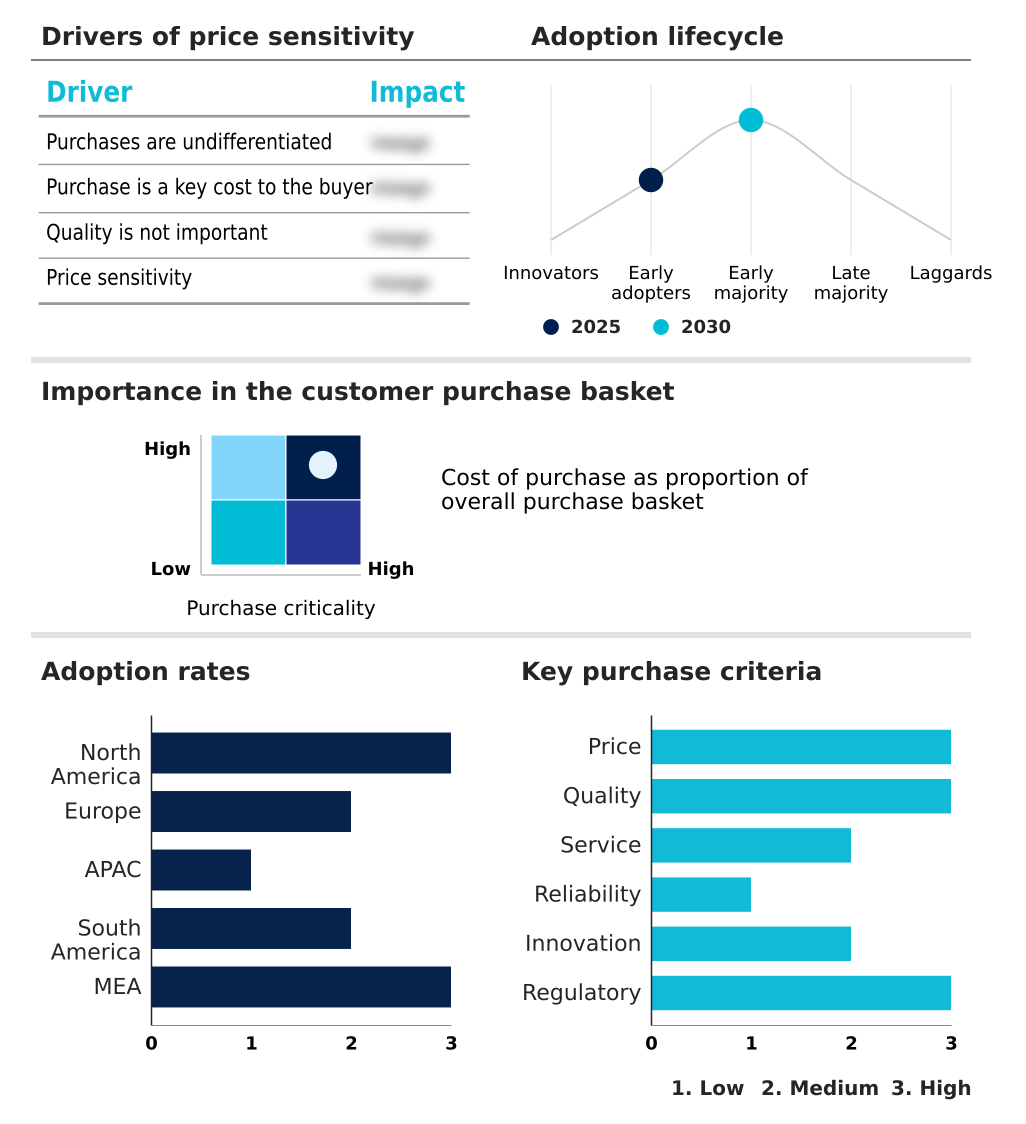
Exclusive Technavio Analysis on Customer Landscape
The digital content market forecasting report includes the adoption lifecycle of the market, covering from the innovator’s stage to the laggard’s stage. It focuses on adoption rates in different regions based on penetration. Furthermore, the digital content market report also includes key purchase criteria and drivers of price sensitivity to help companies evaluate and develop their market growth analysis strategies.
Customer Landscape of Digital Content Industry
Competitive Landscape
Companies are implementing various strategies, such as strategic alliances, digital content market forecast, partnerships, mergers and acquisitions, geographical expansion, and product/service launches, to enhance their presence in the industry.
Accenture Plc - Vendors offer integrated digital content solutions, focusing on customer experience automation and AI-powered analytics to optimize marketing spend and enhance audience engagement across platforms.
The industry research and growth report includes detailed analyses of the competitive landscape of the market and information about key companies, including:
- Accenture Plc
- Acquia Inc.
- Act On Software Inc.
- ActiveCampaign LLC
- Adobe Inc.
- Alibaba Group Holding Ltd.
- Amazon.com Inc.
- ByteDance Ltd.
- Dentsu Group Inc.
- Disruptive Advertising Inc.
- Google LLC
- HubSpot Inc.
- IBM Corp.
- Intuit Inc.
- Meta Platforms Inc.
- Microsoft Corp.
- Oracle Corp.
- Salesforce Inc.
- SAP SE
Qualitative and quantitative analysis of companies has been conducted to help clients understand the wider business environment as well as the strengths and weaknesses of key industry players. Data is qualitatively analyzed to categorize companies as pure play, category-focused, industry-focused, and diversified; it is quantitatively analyzed to categorize companies as dominant, leading, strong, tentative, and weak.
Recent Development and News in Digital content market
- In January 2025, Spotify introduced a new feature that uses artificial intelligence to automatically translate and dub podcasts into multiple languages while preserving the original speakers voice.
- In January 2025, Samsung launched its latest smartphone series with advanced AI capabilities designed to optimize mobile gaming and high-resolution video playback.
- In February 2025, a major Hollywood production studio announced a massive investment in a state-of-the-art on-premises server farm to handle the secure rendering of upcoming high-budget feature films.
- In December 2025, Meta announced a major partnership with several large media companies to bring exclusive immersive sports content to their latest spatial computing headsets.
Dive into Technavio’s robust research methodology, blending expert interviews, extensive data synthesis, and validated models for unparalleled Digital Content Market insights. See full methodology.
| Market Scope | |
|---|---|
| Page number | 305 |
| Base year | 2025 |
| Historic period | 2020-2024 |
| Forecast period | 2026-2030 |
| Growth momentum & CAGR | Accelerate at a CAGR of 19.9% |
| Market growth 2026-2030 | USD 1652.6 billion |
| Market structure | Fragmented |
| YoY growth 2025-2026(%) | 15.8% |
| Key countries | US, Canada, Mexico, Germany, UK, France, Italy, Spain, The Netherlands, China, Japan, India, South Korea, Australia, Indonesia, Brazil, Argentina, Colombia, Saudi Arabia, UAE, South Africa, Israel and Turkey |
| Competitive landscape | Leading Companies, Market Positioning of Companies, Competitive Strategies, and Industry Risks |
Research Analyst Overview
- The digital content market is in a state of perpetual evolution, driven by technological advancements and shifting consumer behaviors. Its foundational strength lies in the seamless distribution of streaming media and digital publications across an ever-expanding ecosystem of connected devices.
- The integration of AI-powered content curation has become a critical competitive differentiator, enabling platforms to deliver highly personalized experiences that drive user engagement and retention. With a year-over-year growth rate of 15.8%, the industry's expansion is not just about volume but also about sophistication, with interactive entertainment and augmented reality applications gaining significant traction.
- A key trend influencing boardroom strategy is the maturation of the creator economy, which is compelling established media companies to rethink talent acquisition and content partnerships. The market is also defined by the increasing importance of digital rights management (DRM) to protect high-value assets.
- This dynamic environment necessitates that businesses remain agile, continuously innovating their content delivery networks and monetization models to capitalize on emerging opportunities in cloud gaming and immersive media, while navigating the complexities of a globalized, always-on consumer base.
What are the Key Data Covered in this Digital Content Market Research and Growth Report?
-
What is the expected growth of the Digital Content Market between 2026 and 2030?
-
USD 1652.6 billion, at a CAGR of 19.9%
-
-
What segmentation does the market report cover?
-
The report is segmented by Content Type (Digital video content, Digital game content, Digital text content, and Digital audio content), Application (Smartphones, Computers, Smart TV, and Others), Deployment (Cloud, and On-premises) and Geography (North America, Europe, APAC, South America, Middle East and Africa)
-
-
Which regions are analyzed in the report?
-
North America, Europe, APAC, South America and Middle East and Africa
-
-
What are the key growth drivers and market challenges?
-
Rising digital transformation across sectors, Limitation in content availability in some regions
-
-
Who are the major players in the Digital Content Market?
-
Accenture Plc, Acquia Inc., Act On Software Inc., ActiveCampaign LLC, Adobe Inc., Alibaba Group Holding Ltd., Amazon.com Inc., ByteDance Ltd., Dentsu Group Inc., Disruptive Advertising Inc., Google LLC, HubSpot Inc., IBM Corp., Intuit Inc., Meta Platforms Inc., Microsoft Corp., Oracle Corp., Salesforce Inc. and SAP SE
-
Market Research Insights
- The digital content market's momentum is accelerating, with a year-over-year growth of 15.8%, driven by innovations in over-the-top (OTT) services and mobile content consumption. Subscription video on-demand (SVOD) and advertising-based video on-demand (AVOD) models are becoming increasingly sophisticated, leveraging data to enhance user retention.
- Geographically, North America represents a significant opportunity, accounting for over 43% of incremental growth, underscoring its mature infrastructure and high adoption rates. The integration of social commerce is creating a seamless link between content discovery and online purchasing, while the growth of the creator economy diversifies the media landscape.
- The rise of esports continues to be a powerful engagement driver, transforming gaming into a major spectator sport and opening new avenues for digital advertising and sponsorships.
We can help! Our analysts can customize this digital content market research report to meet your requirements.
 RIA -
RIA - 
