Digital OOH Market Size 2025-2029
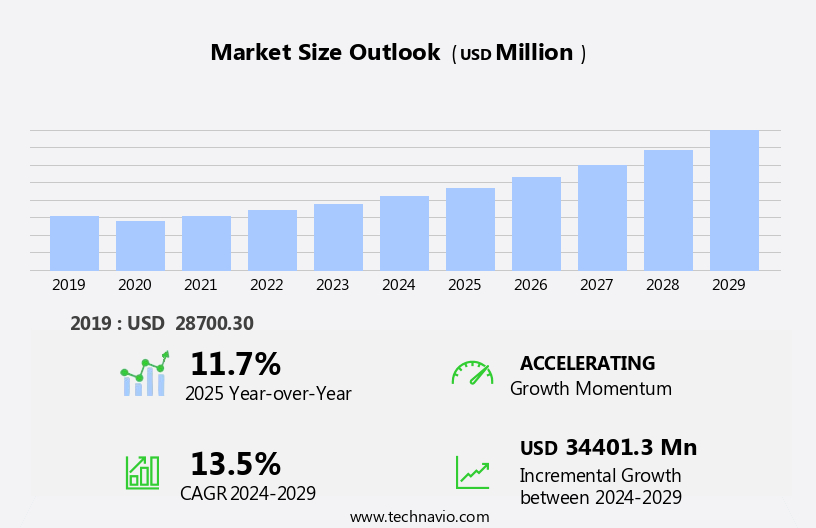
The digital ooh market size is forecast to increase by USD 34.4 billion, at a CAGR of 13.5% between 2024 and 2029.
- The Digital Out-of-Home (OOH) market is experiencing significant shifts, driven by the decreasing adoption of traditional print advertising and the integration of Artificial Intelligence (AI) in OOH advertising. The shift from print to digital is a key trend, as businesses seek more interactive and targeted advertising solutions. AI's role in OOH advertising is also transformative, enabling real-time audience analysis and personalized content delivery, enhancing the overall advertising experience. However, the high cost of implementing digital OOH infrastructure remains a significant challenge for market entrants.
- This financial barrier can hinder the growth of smaller businesses and limit their ability to compete with larger players. To capitalize on market opportunities, companies must explore cost-effective digital OOH solutions and collaborative partnerships to share resources and expertise. Navigating this challenge requires strategic planning and a deep understanding of the evolving OOH landscape.
What will be the Size of the Digital OOH Market during the forecast period?
Explore in-depth regional segment analysis with market size data - historical 2019-2023 and forecasts 2025-2029 - in the full report.
Request Free Sample
The digital out-of-home (OOH) market continues to evolve, with dynamic applications across various sectors including retail environments, public transportation, healthcare facilities, corporate offices, and hospitality venues. Network infrastructure plays a crucial role in facilitating seamless connectivity solutions for digital signage, media buying, and programmatic advertising. Screen sizes and resolution vary, with high-resolution displays and video walls offering enhanced viewing experiences. LED displays, with their energy efficiency and brightness levels, are increasingly popular for outdoor applications. Outdoor enclosures ensure durability, while motion and proximity sensors optimize content based on audience presence. Power supplies and control systems ensure reliable operation, while compliance standards ensure regulatory adherence.
Sunlight readability and heat dissipation are essential considerations for outdoor installations. Content management systems enable dynamic content and targeted advertising, while creative services and media planning maximize ROI. Power consumption and audience measurement tools provide valuable data for optimization and performance reporting. Maintenance costs and energy efficiency are ongoing concerns, with ongoing advancements in technology addressing these challenges. Environmental impact is also a growing consideration, with sustainable solutions gaining traction. LCD screens and software platforms continue to advance, offering improved functionality and interactivity. Ambient light sensors and interactive maps enhance user engagement, while customer support and performance reporting ensure optimal campaign execution.
The OOH market's continuous dynamism is reflected in the evolving patterns of this ever-growing industry.
How is this Digital OOH Industry segmented?
The digital ooh industry research report provides comprehensive data (region-wise segment analysis), with forecasts and estimates in "USD million" for the period 2025-2029, as well as historical data from 2019-2023 for the following segments.
- Type
- In-store advertising
- Outdoor advertising
- Product
- Billboards
- Shelter
- Transit
- Street furniture
- Application
- Retail
- Recreation
- Banking
- Transportation
- Others
- Geography
- North America
- US
- Canada
- Europe
- France
- Germany
- UK
- APAC
- Australia
- China
- India
- Japan
- South Korea
- Rest of World (ROW)
- North America
By Type Insights
The in-store advertising segment is estimated to witness significant growth during the forecast period.
The digital out-of-home (OOH) market in the US is witnessing notable advancements, with in-store advertising emerging as a key growth driver. This segment utilizes digital screens and interactive displays to captivate consumers at the point of purchase in retail environments. The integration of real-time data analytics and artificial intelligence enables tailored, contextually relevant advertising, enhancing consumer engagement and boosting sales. Network infrastructure, including facial recognition technology and remote monitoring, ensures seamless connectivity and content delivery across various platforms. Public transportation and corporate offices serve as additional avenues for digital OOH advertising, catering to diverse audiences and offering opportunities for targeted campaigns.
Screen sizes and resolutions, such as high-definition LCD screens and LED displays, provide enhanced visual experiences for viewers. Compliance standards and control systems ensure the delivery of appropriate content, while power consumption and connectivity solutions address operational efficiency concerns. Media planning, creative services, and content management systems facilitate the development and execution of dynamic, data-driven campaigns. Programmatic advertising and ad serving optimize ad placement and audience targeting, while campaign optimization and performance reporting enable continuous improvement. Environmental factors, including sunlight readability, heat dissipation, and maintenance costs, are addressed through advanced technologies and strategies. Interactive kiosks and information displays offer engaging experiences and valuable information to consumers in various settings, from healthcare facilities to hospitality venues.
Data analytics and audience measurement tools provide valuable insights into consumer behavior and campaign performance, enabling informed decision-making and improved ROI tracking. Overall, the market in the US is evolving to deliver more immersive, interactive, and personalized advertising experiences.
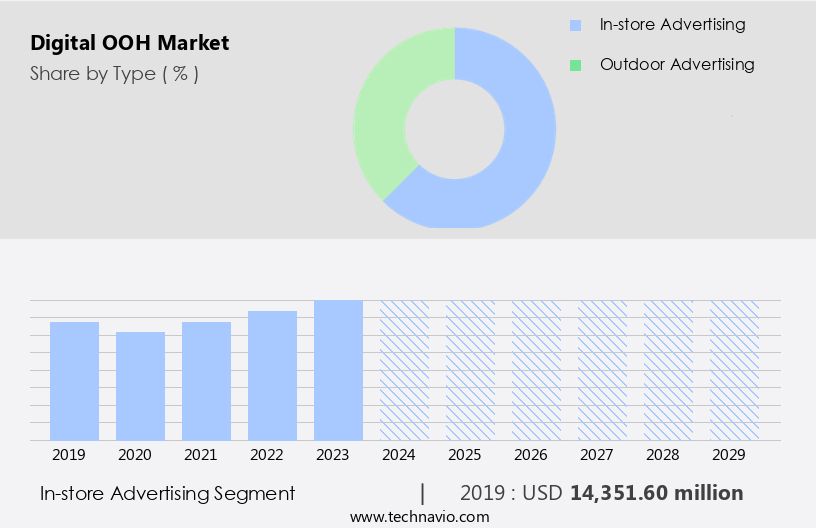
The In-store advertising segment was valued at USD 14.35 billion in 2019 and showed a gradual increase during the forecast period.
Regional Analysis
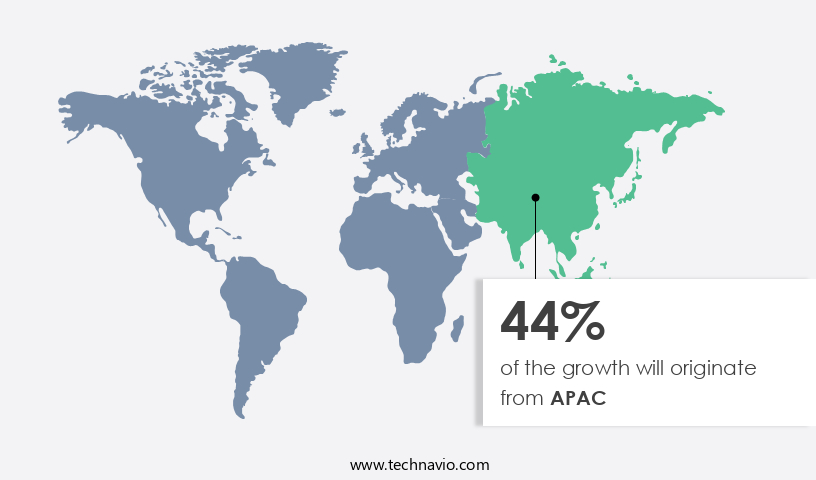
APAC is estimated to contribute 44% to the growth of the global market during the forecast period.Technavio’s analysts have elaborately explained the regional trends and drivers that shape the market during the forecast period.
The digital out-of-home (OOH) market in Asia Pacific (APAC) is experiencing significant growth due to increasing investments from global companies seeking to expand their presence in the region. This expansion includes acquisitions of local firms to broaden customer bases. New technologies, such as augmented reality and virtual reality, are being adopted for OOH advertising in China, driving market growth. Countries like the Philippines, Singapore, and Thailand are witnessing increasing spending on digital OOH advertising. Japan, China, and India present substantial opportunities due to rising advertiser investments in digital OOH advertising within their borders. Retail environments, public transportation, and corporate offices are major sectors embracing digital OOH advertising.
Network infrastructure, remote monitoring, control systems, and compliance standards ensure seamless implementation. Screen sizes, sunlight readability, and heat dissipation are crucial considerations for high-quality digital displays. Content management systems enable targeted advertising and dynamic content, while media planning and media buying optimize campaigns. Power consumption, audience measurement, and connectivity solutions are essential for efficient and effective digital OOH advertising. Quality control, LCD screens, software platforms, and measurement tools ensure accuracy and precision. Programmatic advertising, healthcare facilities, and interactive kiosks are emerging trends. Campaign optimization, advertising networks, installation services, and maintenance costs are key factors in the market's evolution. Energy efficiency, brightness levels, and environmental impact are crucial concerns for sustainable digital signage solutions.
Market Dynamics
Our researchers analyzed the data with 2024 as the base year, along with the key drivers, trends, and challenges. A holistic analysis of drivers will help companies refine their marketing strategies to gain a competitive advantage.
The digital out-of-home (DOOH) market is a dynamic and innovative industry that leverages digital technology to deliver targeted advertisements and engaging content in public spaces. This market encompasses various formats, including digital billboards, transit advertising, and interactive kiosks. Advertisers utilize real-time data and analytics to optimize campaigns, ensuring relevance and effectiveness. Programmatic buying streamlines the process, enabling automated, data-driven ad placements. Location-based targeting and geofencing further enhance campaign reach. Digital signage software facilitates content management and scheduling. The DOOH market continues to evolve, integrating technologies like augmented reality, artificial intelligence, and the Internet of Things, offering advertisers unprecedented opportunities for audience engagement and measurable ROI.
What are the key market drivers leading to the rise in the adoption of Digital OOH Industry?
- The decline in the use of print advertising is the primary factor influencing the market's current trends.
- In the realm of out-of-home (OOH) advertising, digital screens have emerged as a dynamic and engaging medium for businesses to connect with audiences. The market is characterized by its use of creative services, media planning, and media buying, all facilitated by software platforms and connectivity solutions. Dynamic content, powered by these technologies, enables businesses to target specific demographics and adjust messaging in real-time. Power consumption is a crucial factor in the market, with LCD screens being a popular choice due to their energy efficiency. Quality control is ensured through rigorous testing and measurement tools, including those for sunlight readability and heat dissipation.
- Programmatic advertising further streamlines the buying process, allowing for more efficient media planning and audience measurement. Software platforms play a pivotal role in the Digital OOH ecosystem, providing features such as content management, scheduling, and reporting. As the market continues to evolve, advancements in technology will undoubtedly bring about new opportunities and challenges. Regardless, the focus on delivering high-quality, engaging experiences for audiences will remain a constant priority.
What are the market trends shaping the Digital OOH Industry?
- The use of artificial intelligence (AI) in out-of-home (OOH) advertising is an emerging market trend. This innovative approach leverages AI technologies to enhance the effectiveness and interactivity of traditional OOH campaigns.
- Digital out-of-home (DOOH) advertising is undergoing a transformation with the integration of advanced technologies. Advertising agencies and marketing companies are leveraging data analytics to optimize their campaigns and enhance audience engagement. Artificial intelligence (AI) is a key technology driving this evolution. It enables real-time monitoring of viewer demographics, preferences, and behavior through the use of motion and proximity sensors, high-resolution displays, and LED screens in outdoor enclosures. This data is then utilized to customize advertisements and deploy them more effectively.
- For instance, Netflix utilized AI for a virtual OOH activation of its series "Griselda" in February 2024. The market is witnessing significant investment in software and analytical tools to improve campaign efficiency and effectiveness. Key components of DOOH infrastructure include power supplies, pixel pitch, refresh rate, and ad serving systems. As the industry continues to innovate, we can expect continued growth and development in this space.
What challenges does the Digital OOH Industry face during its growth?
- The high cost of implementing digital out-of-home (OOH) advertising solutions represents a significant challenge to the industry's growth, as businesses must invest heavily in technology and infrastructure to remain competitive in the digital age.
- Digital out-of-home (DOOH) advertising, which includes digital signage, video walls, interactive maps, and kiosks, offers businesses unique opportunities for engaging customers and boosting brand awareness. However, the cost of implementing DOOH solutions can be significant, influencing the return on investment (ROI) for advertisers. Factors such as campaign length, exposure time, and location impact the cost, which can range from a few hundred to several thousand dollars. Moreover, advertisers must navigate regulatory requirements to secure permission to display ads in public spaces. To optimize ROI, DOOH solutions offer features like ambient light sensors, performance reporting, and customer support. These features enable real-time monitoring of ad performance, energy efficiency, and maintenance costs.
- Additionally, interactive elements like video walls and kiosks can enhance the customer experience. Data analytics and environmental impact are crucial considerations for businesses adopting DOOH. Energy efficiency and brightness levels are essential for minimizing environmental impact, while data analytics can provide valuable insights into customer behavior and preferences. Interactive kiosks can also offer a more personalized experience for customers. Despite the initial investment, DOOH advertising offers significant benefits for businesses, including increased engagement, improved targeting, and real-time data analytics. With the advancement of technology, the cost of implementing DOOH solutions is expected to decrease, making it an attractive option for businesses seeking to reach customers in new and innovative ways.
Exclusive Customer Landscape
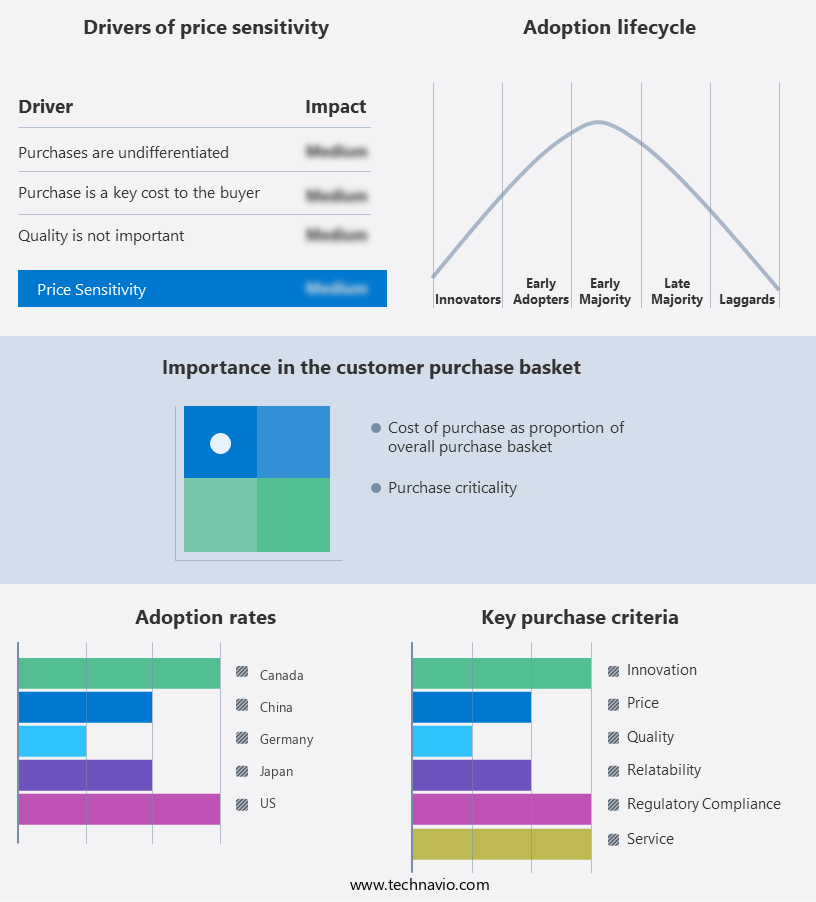
The digital ooh market forecasting report includes the adoption lifecycle of the market, covering from the innovator’s stage to the laggard’s stage. It focuses on adoption rates in different regions based on penetration. Furthermore, the digital ooh market report also includes key purchase criteria and drivers of price sensitivity to help companies evaluate and develop their market growth analysis strategies.
Customer Landscape
Key Companies & Market Insights
Companies are implementing various strategies, such as strategic alliances, digital ooh market forecast, partnerships, mergers and acquisitions, geographical expansion, and product/service launches, to enhance their presence in the industry.
Adonmo Pvt Ltd. - Digital out-of-home advertising innovations encompass video walls and expansive networks of screens. This forward-thinking approach enhances brand visibility and consumer engagement, leveraging advanced technology to captivate audiences in dynamic, interactive ways.
The industry research and growth report includes detailed analyses of the competitive landscape of the market and information about key companies, including:
- Adonmo Pvt Ltd.
- Advision Media
- AllOver Media LLC
- Blue Outdoor
- Broadsign
- Capitol Outdoor LLC.
- Captivate LLC
- Clear Channel Outdoor Holdings Inc.
- Euro Media Group
- Excellent Global Endeavors LLP
- Focus Media UK Ltd.
- JCDecaux SE
- Lamar Advertising Co.
- Lightbox OOH Video Network
- OUTFRONT Media Inc.
- Perion Network Ltd.
- Primedia Proprietary Ltd.
- Stroer SE and Co. KGaA
- Vistar Media Inc.
Qualitative and quantitative analysis of companies has been conducted to help clients understand the wider business environment as well as the strengths and weaknesses of key industry players. Data is qualitatively analyzed to categorize companies as pure play, category-focused, industry-focused, and diversified; it is quantitatively analyzed to categorize companies as dominant, leading, strong, tentative, and weak.
Recent Development and News in Digital OOH Market
- In January 2024, Out-of-Home (OOH) media company, JCDecaux, announced the launch of its new digital OOH advertising platform, "SmartCity," in New York City. The platform integrates advanced technologies such as facial recognition and real-time traffic data to deliver targeted ads to specific demographics and optimize ad placements based on real-time traffic conditions (JCDecaux press release).
- In March 2024, Clear Channel Outdoor Americas and Google signed a strategic partnership to integrate Google's programmatic advertising platform into Clear Channel's digital OOH network. This collaboration aimed to enable real-time buying and targeting of digital OOH ads, making the medium more accessible to small and medium-sized businesses (Clear Channel press release).
- In May 2024, Lamar Advertising Company completed the acquisition of Adams Outdoor Advertising, significantly expanding its presence in the US the market. The acquisition added over 3,000 digital billboards and screens to Lamar's existing network, increasing its market share and strengthening its competitive position (Lamar Advertising SEC filing).
- In February 2025, the European Union approved new regulations for digital OOH advertising, allowing for more flexible and targeted advertising while maintaining privacy protections. The regulations are expected to boost the growth of the European the market by enabling more innovative and effective ad campaigns (European Commission press release).
Research Analyst Overview
- In the dynamic digital out-of-home (DOOH) market, click-through rates and customer experience are key performance indicators. Leveraging omnichannel marketing strategies, DOOH networks integrate NFC technology and QR codes for seamless customer engagement. Ad networks employ location-based targeting and social media integration to deliver personalized content. Customer loyalty is fostered through interactive games, augmented reality, and virtual reality experiences. Technical support and place-based advertising ensure brand awareness, while data privacy and security protocols maintain trust. Screen sharing and data visualization enhance the user experience, and smart signage offers real-time analytics for effective audience segmentation.
- Content scheduling and software updates ensure compliance with regulations and sustainability initiatives. Mobile payments and mobile integration facilitate seamless transactions, while hardware upgrades and playlist management optimize network performance. Interactive games and virtual reality create immersive experiences, driving user engagement and conversion rates. DOOH networks continue to evolve, offering brands innovative solutions for place-based advertising, brand awareness, and customer loyalty.
Dive into Technavio’s robust research methodology, blending expert interviews, extensive data synthesis, and validated models for unparalleled Digital OOH Market insights. See full methodology.
|
Market Scope |
|
|
Report Coverage |
Details |
|
Page number |
222 |
|
Base year |
2024 |
|
Historic period |
2019-2023 |
|
Forecast period |
2025-2029 |
|
Growth momentum & CAGR |
Accelerate at a CAGR of 13.5% |
|
Market growth 2025-2029 |
USD 34401.3 million |
|
Market structure |
Fragmented |
|
YoY growth 2024-2025(%) |
11.7 |
|
Key countries |
US, China, Japan, India, Canada, Germany, South Korea, UK, France, and Australia |
|
Competitive landscape |
Leading Companies, Market Positioning of Companies, Competitive Strategies, and Industry Risks |
What are the Key Data Covered in this Digital OOH Market Research and Growth Report?
- CAGR of the Digital OOH industry during the forecast period
- Detailed information on factors that will drive the growth and forecasting between 2025 and 2029
- Precise estimation of the size of the market and its contribution of the industry in focus to the parent market
- Accurate predictions about upcoming growth and trends and changes in consumer behaviour
- Growth of the market across APAC, North America, Europe, Middle East and Africa, and South America
- Thorough analysis of the market’s competitive landscape and detailed information about companies
- Comprehensive analysis of factors that will challenge the digital ooh market growth of industry companies
We can help! Our analysts can customize this digital ooh market research report to meet your requirements.
 RIA -
RIA - 
