Digital Packaging And Labeling Market Analysis North America, Europe, APAC, Middle East and Africa, South America - US, China, UK, Germany, Japan - Size and Forecast 2024-2028

Digital Packaging And Labeling Market Analysis North America, Europe, APAC, Middle East and Africa, South America - US, China, UK, Germany, Japan - Size and Forecast 2024-2028

Published: Aug 2024 181 Pages SKU: IRTNTR72433

Market Overview at a Glance

$22.2 B
Market Opportunity
13.64%
CAGR
11.69
YoY growth 2023-2024(%)

Digital Packaging And Labeling Market Size 2024-2028

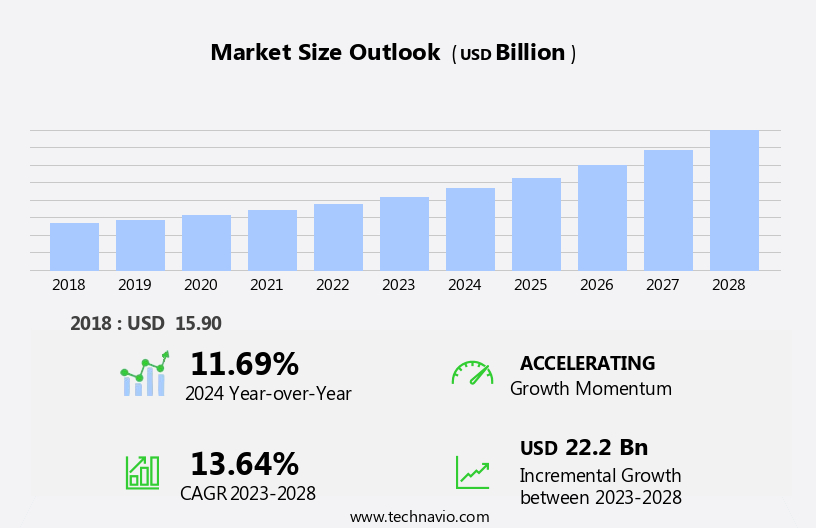
The digital packaging and labeling market size is forecast to increase by USD 22.2 billion, at a CAGR of 13.64% between 2023 and 2028.

  • The market is experiencing significant growth due to the increasing consumption of packaged beverages worldwide and the rising demand from consumer goods manufacturers. This trend is driven by the advantages offered by digital technologies, such as personalization, customization, and improved product differentiation. However, the high per-unit cost for high-volume printing remains a notable challenge for market participants. To capitalize on opportunities and navigate this obstacle, companies must focus on optimizing production processes, investing in cost-effective technologies, and collaborating with suppliers to achieve economies of scale.
  • Additionally, the integration of advanced technologies like augmented reality (AR) and Internet of Things (IoT) in packaging and labeling solutions is expected to create new revenue streams and enhance consumer engagement. Overall, the market presents significant opportunities for growth, with companies that can effectively address the challenges and leverage emerging technologies poised to gain a competitive edge.

What will be the Size of the Digital Packaging And Labeling Market during the forecast period?

Digital Packaging And Labeling Market Size

Explore in-depth regional segment analysis with market size data - historical 2018-2022 and forecasts 2024-2028 - in the full report.  
Request Free Sample

The market continues to evolve, driven by advancements in technology and shifting consumer preferences. Regulatory compliance labels, once a niche application, are now a standard requirement in numerous sectors, including pharmaceuticals and food and beverage. NFC tag applications offer new opportunities for interactive consumer engagement, while flexible packaging solutions enable product differentiation and sustainability. Product information management systems streamline the process of updating and maintaining accurate and up-to-date labeling information. Digital label proofing ensures error-free label production, reducing waste and rework costs. Prepress workflow automation and packaging design software facilitate efficient design and production processes.

Serialization technologies, such as data matrix codes, enable supply chain visibility and traceability, with RFID tagging systems and e-pedigree systems providing additional layers of security and anti-counterfeiting measures. Smart packaging sensors and tamper-evident seals offer enhanced product protection and consumer confidence. Digital printing inks and high-resolution imaging enable vibrant and detailed label designs, while label printing equipment and label substrate materials cater to various industry-specific requirements. Packaging artwork management systems ensure brand consistency and regulatory compliance. Industry growth is expected to reach double-digit percentages, driven by the adoption of cloud-based packaging management systems, QR code generation, color management systems, and blockchain technology implementation.

For instance, a leading food and beverage company reported a 15% increase in sales due to the implementation of augmented reality packaging. Continuous innovation and integration of technology into the packaging value chain will shape the future of the market.

How is this Digital Packaging And Labeling Industry segmented?

The digital packaging and labeling industry research report provides comprehensive data (region-wise segment analysis), with forecasts and estimates in "USD billion" for the period 2024-2028, as well as historical data from 2018-2022 for the following segments.

  • End-user
    • Food and beverages
    • Personal care
    • Healthcare
    • Electronics
    • Others
  • Technology
    • Inkjet
    • Electrophotography
  • Geography
    • North America
      • US
    • Europe
      • Germany
      • UK
    • APAC
      • China
      • Japan
    • Rest of World (ROW)

By End-user Insights

The food and beverages segment is estimated to witness significant growth during the forecast period.

The packaging and labeling market has experienced a notable transformation in the last decade, with digital printing playing a pivotal role in catering to various industries. Among them, the food and beverage sector holds significant potential due to the high demand for packaging and labeling solutions. According to recent industry reports, the food industry generates a substantial volume of packaging and labeling requirements. In response, label and package manufacturers are increasingly adopting digital printing technologies. Digital printing enables on-demand production of labels and packaging, offering benefits such as shorter lead times, reduced inventory costs, and improved product customization. Moreover, it facilitates the integration of advanced technologies like NFC tags, QR codes, RFID, and serialization, enhancing the consumer experience and ensuring regulatory compliance.

Innovations in digital printing inks, prepress workflow automation, and packaging design software have streamlined the production process, making it more harmonious and efficient. Additionally, the implementation of cloud-based packaging management systems and blockchain technology has improved supply chain visibility and security. For instance, a leading food manufacturer reported a 30% increase in sales after implementing a digital printing solution for its labeling needs. Furthermore, the global packaging market is expected to grow at a steady pace, reaching a value of USD1 trillion by 2025. This growth is driven by factors such as the increasing demand for sustainable packaging materials, the integration of smart technologies, and the rise of e-commerce.

Digital Packaging And Labeling Market Size

Request Free Sample

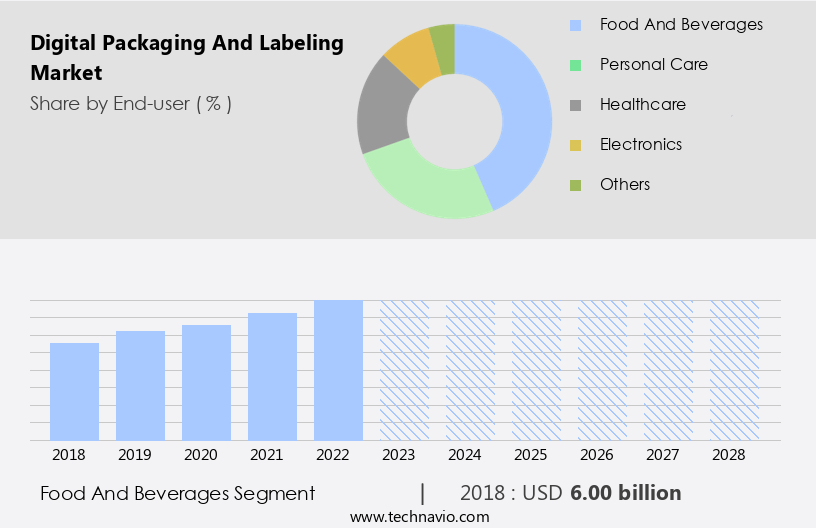
The Food and beverages segment was valued at USD 6.00 billion in 2018 and showed a gradual increase during the forecast period.
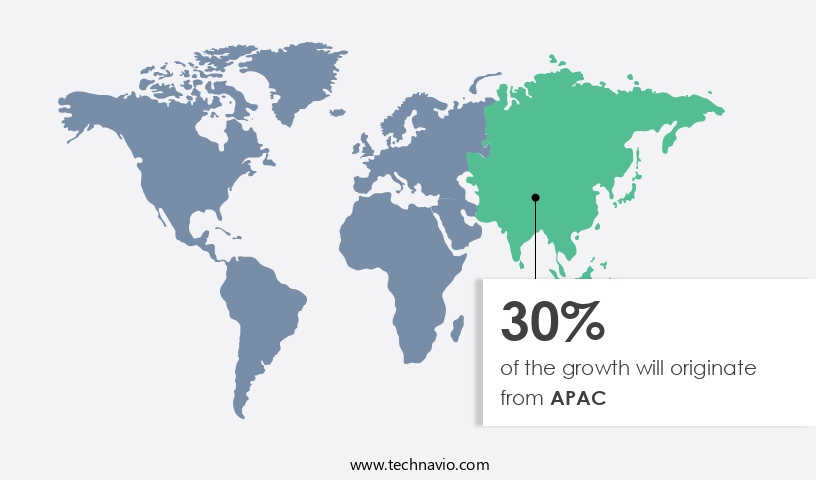
Regional Analysis

APAC is estimated to contribute 30% to the growth of the global market during the forecast period. Technavio's analysts have elaborately explained the regional trends and drivers that shape the market during the forecast period.

Digital Packaging And Labeling Market Share by Geography

 Request Free Sample

The market in North America is experiencing significant growth, particularly in sectors like e-commerce and pharmaceuticals. In the US, the e-commerce industry is thriving due to increasing Internet penetration and purchasing power parity, leading to a surge in demand for efficient packaging solutions. E-commerce players utilize flexible packaging, such as plastic bags and corrugated boxes, for shipment. To print brand names and essential information on these packages, they adopt digital packaging and labeling techniques. Furthermore, regulatory compliance labels, NFC tag applications, and secure packaging solutions are becoming increasingly important in various industries. Product information management, digital label proofing, prepress workflow automation, and packaging design software enable companies to streamline their labeling processes and ensure accuracy.

Serialization technologies, such as data matrix codes and QR codes, facilitate supply chain visibility and reduce packaging waste. High-resolution imaging and augmented reality packaging offer immersive consumer experiences, while sustainable packaging materials and e-commerce packaging cater to the growing environmental consciousness and convenience demands. Smart packaging sensors, tamper-evident seals, and RFID tagging systems enhance product safety and security. According to recent studies, the market in North America is projected to grow by over 10% annually, driven by the increasing adoption of advanced technologies like digital printing inks, color management systems, and blockchain technology implementation. For instance, variable data printing enables personalized product labels, increasing sales by up to 15% for some companies.

These trends highlight the harmonious blend of innovation and functionality in the market.

Market Dynamics

Our researchers analyzed the data with 2023 as the base year, along with the key drivers, trends, and challenges. A holistic analysis of drivers will help companies refine their marketing strategies to gain a competitive advantage.

What are the key market drivers leading to the rise in the adoption of Digital Packaging and Labeling Industry?

  • The global market is primarily driven by the increasing consumption of packaged beverages on a worldwide scale. 
  • The market is experiencing significant growth due to the increasing consumption of packaged beverages worldwide. This trend is driven by the growing health consciousness among consumers, leading to a decrease in carbonated soft drink consumption and an increase in demand for packaged water and fruit juices. Additionally, the consumption of packaged milk and dairy beverages is on the rise. Digital packaging and labeling offer several advantages over traditional methods, including the ability to deliver unlimited product information. Digital or smart labels enable end-users to access information about beverage products using web and mobile applications.
  • For instance, a study revealed that online product information significantly influences purchasing decisions, with 90% of consumers checking online reviews before buying a product. The market is expected to grow at an average annual rate of around 2.8% during the forecast period. This growth is attributed to the increasing demand for personalized and interactive packaging, as well as the need for real-time product information. The integration of QR codes, RFID tags, and NFC technology in packaging further enhances the consumer experience and provides valuable data to manufacturers.

What are the market trends shaping the Digital Packaging and Labeling Industry?

  • Consumer goods manufacturers are experiencing an increasing demand for their products, representing a significant market trend in the upcoming period.
  • The consumer goods industry is witnessing a trend towards offering products in various weights and packaging arrays, such as 100 grams, 250 grams, and 500 grams. This proliferation of stock-keeping units (SKUs) necessitates customization in printing with a quick turnaround time. The need for swift market entry to mitigate inventory risks at both the manufacturer and retailer levels is driving the demand for digital packaging and labeling.
  • This technology offers individualized printing at high efficiency within a short time frame. The market is expected to grow significantly due to this increasing demand for customized and quick-to-market solutions.

What challenges does the Digital Packaging and Labeling Industry face during its growth?

  • The high per-unit cost associated with high-volume printing represents a significant challenge that can hinder industry growth. 
  • Digital packaging and labeling present a compelling advantage with swift turnaround times due to minimal setup requirements. This enables same-day and next-day printing, offering higher efficiency and lower costs for low-volume productions. However, economies of scale are only achievable through analog printing for larger volume orders, despite its higher initial setup costs. Digital packaging and labeling's production process incorporates minute printing molecules and advanced software, contributing to a 40% higher per-unit printing cost compared to analog methods. Despite this, the industry is expected to grow robustly, with digital packaging and labeling accounting for approximately 25% of the global label market by 2025.
  • This growth is driven by factors such as increasing consumer demand for personalized and customized packaging, as well as the ongoing digital transformation in various industries. For instance, a leading food and beverage company successfully implemented digital labeling, reducing their time-to-market by 50% and saving up to 20% on labeling costs. This exemplifies the potential of digital packaging and labeling to streamline production processes and deliver cost savings, even for mid-sized businesses.

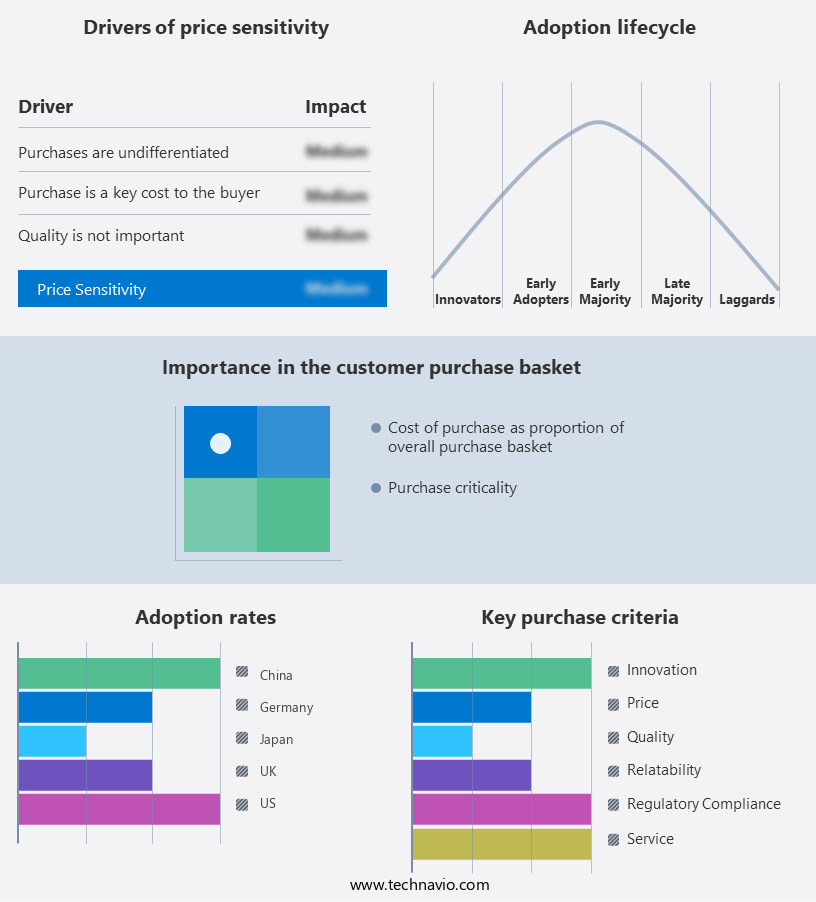
Exclusive Customer Landscape

The digital packaging and labeling market forecasting report includes the adoption lifecycle of the market, covering from the innovator's stage to the laggard's stage. It focuses on adoption rates in different regions based on penetration. Furthermore, the digital packaging and labeling market report also includes key purchase criteria and drivers of price sensitivity to help companies evaluate and develop their market growth analysis strategies.

Digital Packaging And Labeling Market Share by Geography

 Customer Landscape

Key Companies & Market Insights

Companies are implementing various strategies, such as strategic alliances, digital packaging and labeling market forecast, partnerships, mergers and acquisitions, geographical expansion, and product/service launches, to enhance their presence in the industry.

CCL Industries Inc. - The company specializes in advanced digital packaging and labeling solutions, providing customers with robust and efficient digital laser-coding technology. 

The industry research and growth report includes detailed analyses of the competitive landscape of the market and information about key companies, including:

  • CCL Industries Inc.
  • Cenveo Worldwide Ltd.
  • Consolidated Label Co.
  • DS Smith Plc
  • DuPont de Nemours Inc.
  • Eastman Kodak Co.
  • Essentra Plc
  • Flint Group
  • Hewlett Packard Enterprise Co.
  • Lofton Label and Packaging Inc.
  • Mondi Plc
  • Printpack Inc.
  • Quad Graphics Inc.
  • Quantum Print and Packaging Ltd.
  • RR Donnelley and Sons Co.
  • SAKATA INX CORP.
  • Smurfit Kappa Group
  • THIMM Group GmbH plus Co. KG
  • Traco Manufacturing
  • Xeikon
  • Xerox Holdings Corp.

Qualitative and quantitative analysis of companies has been conducted to help clients understand the wider business environment as well as the strengths and weaknesses of key industry players. Data is qualitatively analyzed to categorize companies as pure play, category-focused, industry-focused, and diversified; it is quantitatively analyzed to categorize companies as dominant, leading, strong, tentative, and weak.

Recent Development and News in Digital Packaging And Labeling Market

  • In January 2024, global packaging leader Amcor announced the launch of its new "Amcor Flexibles Digital" business unit, focusing on digital printing and packaging solutions (Amcor press release). This strategic move aimed to cater to the growing demand for shorter runs, personalized packaging, and faster time-to-market.
  • In March 2024, technology giant IBM and digital labeling solutions provider Loftware entered into a partnership to integrate Loftware's Digital Labeling Solutions with IBM's Watson Marketing platform (IBM press release). This collaboration aimed to offer brands advanced labeling capabilities, enabling real-time compliance and improved supply chain efficiency.
  • In April 2025, global packaging company Uflex Limited secured a strategic investment of INR 200 crores (approximately USD 26.5 million) from private equity firm Blackstone Group to expand its digital printing capacity and capabilities (Business Standard). This investment will help Uflex strengthen its position in the market.
  • In May 2025, the European Union's European Parliament and Council adopted Regulation (EU) 2025, mandating the use of digital or electronic alternative to traditional paper and plastic labels for certain products from January 2027 (European Parliament press release). This regulatory development is expected to significantly boost the market in Europe.

Research Analyst Overview

  • The market continues to evolve, driven by advancements in technology and shifting consumer preferences. Custom label design and packaging artwork creation are increasingly important, with label durability testing ensuring product authenticity and consumer trust. Supply chain security and data integrity validation are essential for brand protection, while packaging ergonomics and product authentication methods enhance the consumer experience. Packaging cost reduction through on-demand printing solutions and packaging line efficiency are key priorities for businesses. Label finishing techniques, such as embossing and holographic effects, add value to products. Sustainable label production and interactive packaging features are gaining traction, with industry growth expected to reach 10% annually.
  • For instance, a leading consumer goods company reported a 15% increase in sales after implementing color accuracy control and print quality standards. Packaging waste recycling, digital proofing software, and printing process optimization are crucial for reducing environmental impact and improving efficiency. Label inspection systems and brand protection strategies ensure compliance with print quality assessment and printing process optimization. Label material selection, label inspection systems, and digital asset management are integral to supply chain traceability. The market's continuous dynamism underpins its ongoing relevance and importance across various sectors.

Dive into Technavio's robust research methodology, blending expert interviews, extensive data synthesis, and validated models for unparalleled Digital Packaging And Labeling Market insights. See full methodology.

Market Scope

Report Coverage

Details

Page number

181

Base year

2023

Historic period

2018-2022

Forecast period

2024-2028

Growth momentum & CAGR

Accelerate at a CAGR of 13.64%

Market growth 2024-2028

USD 22.2 billion

Market structure

Fragmented

YoY growth 2023-2024(%)

11.69

Key countries

US, China, UK, Germany, and Japan

Competitive landscape

Leading Companies, Market Positioning of Companies, Competitive Strategies, and Industry Risks

Request Free Sample

What are the Key Data Covered in this Digital Packaging And Labeling Market Research and Growth Report?

  • CAGR of the Digital Packaging And Labeling industry during the forecast period
  • Detailed information on factors that will drive the growth and forecasting between 2024 and 2028
  • Precise estimation of the size of the market and its contribution of the industry in focus to the parent market
  • Accurate predictions about upcoming growth and trends and changes in consumer behaviour
  • Growth of the market across North America, Europe, APAC, Middle East and Africa, and South America
  • Thorough analysis of the market's competitive landscape and detailed information about companies
  • Comprehensive analysis of factors that will challenge the digital packaging and labeling market growth of industry companies

We can help! Our analysts can customize this digital packaging and labeling market research report to meet your requirements.

Get in touch

1 Executive Summary

  • 1.1 Market overview
    • Executive Summary - Chart on Market Overview
    • Executive Summary - Data Table on Market Overview
    • Executive Summary - Chart on Global Market Characteristics
    • Executive Summary - Chart on Market by Geography
    • Executive Summary - Chart on Market Segmentation by End-user
    • Executive Summary - Chart on Market Segmentation by Technology
    • Executive Summary - Chart on Incremental Growth
    • Executive Summary - Data Table on Incremental Growth
    • Executive Summary - Chart on Company Market Positioning

2 Market Landscape

  • 2.1 Market ecosystem
    • Parent Market
    • Data Table on - Parent Market
  • 2.2 Market characteristics
    • Market characteristics analysis
  • 2.3 Value chain analysis
    • Value Chain Analysis

3 Market Sizing

  • 3.1 Market definition
    • Offerings of companies included in the market definition
  • 3.2 Market segment analysis
    • Market segments
  • 3.3 Market size 2023
    • 3.4 Market outlook: Forecast for 2023-2028
      • Chart on Global - Market size and forecast 2023-2028 ($ billion)
      • Data Table on Global - Market size and forecast 2023-2028 ($ billion)
      • Chart on Global Market: Year-over-year growth 2023-2028 (%)
      • Data Table on Global Market: Year-over-year growth 2023-2028 (%)

    4 Historic Market Size

    • 4.1 Global Digital Packaging And Labeling Market 2018 - 2022
      • Historic Market Size - Data Table on Global Digital Packaging And Labeling Market 2018 - 2022 ($ billion)
    • 4.2 End-user segment analysis 2018 - 2022
      • Historic Market Size - End-user Segment 2018 - 2022 ($ billion)
    • 4.3 Technology segment analysis 2018 - 2022
      • Historic Market Size - Technology Segment 2018 - 2022 ($ billion)
    • 4.4 Geography segment analysis 2018 - 2022
      • Historic Market Size - Geography Segment 2018 - 2022 ($ billion)
    • 4.5 Country segment analysis 2018 - 2022
      • Historic Market Size - Country Segment 2018 - 2022 ($ billion)

    5 Five Forces Analysis

    • 5.1 Five forces summary
      • Five forces analysis - Comparison between 2023 and 2028
    • 5.2 Bargaining power of buyers
      • Bargaining power of buyers - Impact of key factors 2023 and 2028
    • 5.3 Bargaining power of suppliers
      • Bargaining power of suppliers - Impact of key factors in 2023 and 2028
    • 5.4 Threat of new entrants
      • Threat of new entrants - Impact of key factors in 2023 and 2028
    • 5.5 Threat of substitutes
      • Threat of substitutes - Impact of key factors in 2023 and 2028
    • 5.6 Threat of rivalry
      • Threat of rivalry - Impact of key factors in 2023 and 2028
    • 5.7 Market condition
      • Chart on Market condition - Five forces 2023 and 2028

    6 Market Segmentation by End-user

    • 6.1 Market segments
      • Chart on End-user - Market share 2023-2028 (%)
      • Data Table on End-user - Market share 2023-2028 (%)
    • 6.2 Comparison by End-user
      • Chart on Comparison by End-user
      • Data Table on Comparison by End-user
    • 6.3 Food and beverages - Market size and forecast 2023-2028
      • Chart on Food and beverages - Market size and forecast 2023-2028 ($ billion)
      • Data Table on Food and beverages - Market size and forecast 2023-2028 ($ billion)
      • Chart on Food and beverages - Year-over-year growth 2023-2028 (%)
      • Data Table on Food and beverages - Year-over-year growth 2023-2028 (%)
    • 6.4 Personal care - Market size and forecast 2023-2028
      • Chart on Personal care - Market size and forecast 2023-2028 ($ billion)
      • Data Table on Personal care - Market size and forecast 2023-2028 ($ billion)
      • Chart on Personal care - Year-over-year growth 2023-2028 (%)
      • Data Table on Personal care - Year-over-year growth 2023-2028 (%)
    • 6.5 Healthcare - Market size and forecast 2023-2028
      • Chart on Healthcare - Market size and forecast 2023-2028 ($ billion)
      • Data Table on Healthcare - Market size and forecast 2023-2028 ($ billion)
      • Chart on Healthcare - Year-over-year growth 2023-2028 (%)
      • Data Table on Healthcare - Year-over-year growth 2023-2028 (%)
    • 6.6 Electronics - Market size and forecast 2023-2028
      • Chart on Electronics - Market size and forecast 2023-2028 ($ billion)
      • Data Table on Electronics - Market size and forecast 2023-2028 ($ billion)
      • Chart on Electronics - Year-over-year growth 2023-2028 (%)
      • Data Table on Electronics - Year-over-year growth 2023-2028 (%)
    • 6.7 Others - Market size and forecast 2023-2028
      • Chart on Others - Market size and forecast 2023-2028 ($ billion)
      • Data Table on Others - Market size and forecast 2023-2028 ($ billion)
      • Chart on Others - Year-over-year growth 2023-2028 (%)
      • Data Table on Others - Year-over-year growth 2023-2028 (%)
    • 6.8 Market opportunity by End-user
      • Market opportunity by End-user ($ billion)
      • Data Table on Market opportunity by End-user ($ billion)

    7 Market Segmentation by Technology

    • 7.1 Market segments
      • Chart on Technology - Market share 2023-2028 (%)
      • Data Table on Technology - Market share 2023-2028 (%)
    • 7.2 Comparison by Technology
      • Chart on Comparison by Technology
      • Data Table on Comparison by Technology
    • 7.3 Inkjet - Market size and forecast 2023-2028
      • Chart on Inkjet - Market size and forecast 2023-2028 ($ billion)
      • Data Table on Inkjet - Market size and forecast 2023-2028 ($ billion)
      • Chart on Inkjet - Year-over-year growth 2023-2028 (%)
      • Data Table on Inkjet - Year-over-year growth 2023-2028 (%)
    • 7.4 Electrophotography - Market size and forecast 2023-2028
      • Chart on Electrophotography - Market size and forecast 2023-2028 ($ billion)
      • Data Table on Electrophotography - Market size and forecast 2023-2028 ($ billion)
      • Chart on Electrophotography - Year-over-year growth 2023-2028 (%)
      • Data Table on Electrophotography - Year-over-year growth 2023-2028 (%)
    • 7.5 Market opportunity by Technology
      • Market opportunity by Technology ($ billion)
      • Data Table on Market opportunity by Technology ($ billion)

    8 Customer Landscape

    • 8.1 Customer landscape overview
      • Analysis of price sensitivity, lifecycle, customer purchase basket, adoption rates, and purchase criteria

    9 Geographic Landscape

    • 9.1 Geographic segmentation
      • Chart on Market share by geography 2023-2028 (%)
      • Data Table on Market share by geography 2023-2028 (%)
    • 9.2 Geographic comparison
      • Chart on Geographic comparison
      • Data Table on Geographic comparison
    • 9.3 North America - Market size and forecast 2023-2028
      • Chart on North America - Market size and forecast 2023-2028 ($ billion)
      • Data Table on North America - Market size and forecast 2023-2028 ($ billion)
      • Chart on North America - Year-over-year growth 2023-2028 (%)
      • Data Table on North America - Year-over-year growth 2023-2028 (%)
    • 9.4 Europe - Market size and forecast 2023-2028
      • Chart on Europe - Market size and forecast 2023-2028 ($ billion)
      • Data Table on Europe - Market size and forecast 2023-2028 ($ billion)
      • Chart on Europe - Year-over-year growth 2023-2028 (%)
      • Data Table on Europe - Year-over-year growth 2023-2028 (%)
    • 9.5 APAC - Market size and forecast 2023-2028
      • Chart on APAC - Market size and forecast 2023-2028 ($ billion)
      • Data Table on APAC - Market size and forecast 2023-2028 ($ billion)
      • Chart on APAC - Year-over-year growth 2023-2028 (%)
      • Data Table on APAC - Year-over-year growth 2023-2028 (%)
    • 9.6 Middle East and Africa - Market size and forecast 2023-2028
      • Chart on Middle East and Africa - Market size and forecast 2023-2028 ($ billion)
      • Data Table on Middle East and Africa - Market size and forecast 2023-2028 ($ billion)
      • Chart on Middle East and Africa - Year-over-year growth 2023-2028 (%)
      • Data Table on Middle East and Africa - Year-over-year growth 2023-2028 (%)
    • 9.7 South America - Market size and forecast 2023-2028
      • Chart on South America - Market size and forecast 2023-2028 ($ billion)
      • Data Table on South America - Market size and forecast 2023-2028 ($ billion)
      • Chart on South America - Year-over-year growth 2023-2028 (%)
      • Data Table on South America - Year-over-year growth 2023-2028 (%)
    • 9.8 US - Market size and forecast 2023-2028
      • Chart on US - Market size and forecast 2023-2028 ($ billion)
      • Data Table on US - Market size and forecast 2023-2028 ($ billion)
      • Chart on US - Year-over-year growth 2023-2028 (%)
      • Data Table on US - Year-over-year growth 2023-2028 (%)
    • 9.9 China - Market size and forecast 2023-2028
      • Chart on China - Market size and forecast 2023-2028 ($ billion)
      • Data Table on China - Market size and forecast 2023-2028 ($ billion)
      • Chart on China - Year-over-year growth 2023-2028 (%)
      • Data Table on China - Year-over-year growth 2023-2028 (%)
    • 9.10 UK - Market size and forecast 2023-2028
      • Chart on UK - Market size and forecast 2023-2028 ($ billion)
      • Data Table on UK - Market size and forecast 2023-2028 ($ billion)
      • Chart on UK - Year-over-year growth 2023-2028 (%)
      • Data Table on UK - Year-over-year growth 2023-2028 (%)
    • 9.11 Germany - Market size and forecast 2023-2028
      • Chart on Germany - Market size and forecast 2023-2028 ($ billion)
      • Data Table on Germany - Market size and forecast 2023-2028 ($ billion)
      • Chart on Germany - Year-over-year growth 2023-2028 (%)
      • Data Table on Germany - Year-over-year growth 2023-2028 (%)
    • 9.12 Japan - Market size and forecast 2023-2028
      • Chart on Japan - Market size and forecast 2023-2028 ($ billion)
      • Data Table on Japan - Market size and forecast 2023-2028 ($ billion)
      • Chart on Japan - Year-over-year growth 2023-2028 (%)
      • Data Table on Japan - Year-over-year growth 2023-2028 (%)
    • 9.13 Market opportunity by geography
      • Market opportunity by geography ($ billion)
      • Data Tables on Market opportunity by geography ($ billion)

    10 Drivers, Challenges, and Opportunity/Restraints

    • 10.1 Market drivers
      • 10.2 Market challenges
        • 10.3 Impact of drivers and challenges
          • Impact of drivers and challenges in 2023 and 2028
        • 10.4 Market opportunities/restraints

          11 Competitive Landscape

          • 11.1 Overview
            • 11.2 Competitive Landscape
              • Overview on criticality of inputs and factors of differentiation
            • 11.3 Landscape disruption
              • Overview on factors of disruption
            • 11.4 Industry risks
              • Impact of key risks on business

            12 Competitive Analysis

            • 12.1 Companies profiled
              • Companies covered
            • 12.2 Market positioning of companies
              • Matrix on companies position and classification
            • 12.3 CCL Industries Inc.
              • CCL Industries Inc. - Overview
              • CCL Industries Inc. - Business segments
              • CCL Industries Inc. - Key news
              • CCL Industries Inc. - Key offerings
              • CCL Industries Inc. - Segment focus
            • 12.4 Cenveo Worldwide Ltd.
              • Cenveo Worldwide Ltd. - Overview
              • Cenveo Worldwide Ltd. - Product / Service
              • Cenveo Worldwide Ltd. - Key offerings
            • 12.5 DS Smith Plc
              • DS Smith Plc - Overview
              • DS Smith Plc - Business segments
              • DS Smith Plc - Key news
              • DS Smith Plc - Key offerings
              • DS Smith Plc - Segment focus
            • 12.6 DuPont de Nemours Inc.
              • DuPont de Nemours Inc. - Overview
              • DuPont de Nemours Inc. - Business segments
              • DuPont de Nemours Inc. - Key news
              • DuPont de Nemours Inc. - Key offerings
              • DuPont de Nemours Inc. - Segment focus
            • 12.7 Eastman Kodak Co.
              • Eastman Kodak Co. - Overview
              • Eastman Kodak Co. - Business segments
              • Eastman Kodak Co. - Key news
              • Eastman Kodak Co. - Key offerings
              • Eastman Kodak Co. - Segment focus
            • 12.8 Hewlett Packard Enterprise Co.
              • Hewlett Packard Enterprise Co. - Overview
              • Hewlett Packard Enterprise Co. - Business segments
              • Hewlett Packard Enterprise Co. - Key news
              • Hewlett Packard Enterprise Co. - Key offerings
              • Hewlett Packard Enterprise Co. - Segment focus
            • 12.9 Mondi Plc
              • Mondi Plc - Overview
              • Mondi Plc - Business segments
              • Mondi Plc - Key news
              • Mondi Plc - Key offerings
              • Mondi Plc - Segment focus
            • 12.10 Printpack Inc.
              • Printpack Inc. - Overview
              • Printpack Inc. - Product / Service
              • Printpack Inc. - Key offerings
            • 12.11 Quad Graphics Inc.
              • Quad Graphics Inc. - Overview
              • Quad Graphics Inc. - Business segments
              • Quad Graphics Inc. - Key offerings
              • Quad Graphics Inc. - Segment focus
            • 12.12 Quantum Print and Packaging Ltd.
              • Quantum Print and Packaging Ltd. - Overview
              • Quantum Print and Packaging Ltd. - Product / Service
              • Quantum Print and Packaging Ltd. - Key offerings
            • 12.13 SAKATA INX CORP.
              • SAKATA INX CORP. - Overview
              • SAKATA INX CORP. - Product / Service
              • SAKATA INX CORP. - Key offerings
            • 12.14 Smurfit Kappa Group
              • Smurfit Kappa Group - Overview
              • Smurfit Kappa Group - Business segments
              • Smurfit Kappa Group - Key news
              • Smurfit Kappa Group - Key offerings
              • Smurfit Kappa Group - Segment focus
            • 12.15 Traco Manufacturing
              • Traco Manufacturing - Overview
              • Traco Manufacturing - Product / Service
              • Traco Manufacturing - Key offerings
            • 12.16 Xeikon
              • Xeikon - Overview
              • Xeikon - Product / Service
              • Xeikon - Key offerings
            • 12.17 Xerox Holdings Corp.
              • Xerox Holdings Corp. - Overview
              • Xerox Holdings Corp. - Business segments
              • Xerox Holdings Corp. - Key news
              • Xerox Holdings Corp. - Key offerings
              • Xerox Holdings Corp. - Segment focus

            13 Appendix

            • 13.1 Scope of the report
              • 13.2 Inclusions and exclusions checklist
                • Inclusions checklist
                • Exclusions checklist
              • 13.3 Currency conversion rates for US$
                • Currency conversion rates for US$
              • 13.4 Research methodology
                • Research methodology
              • 13.5 Data procurement
                • Information sources
              • 13.6 Data validation
                • Data validation
              • 13.7 Validation techniques employed for market sizing
                • Validation techniques employed for market sizing
              • 13.8 Data synthesis
                • Data synthesis
              • 13.9 360 degree market analysis
                • 360 degree market analysis
              • 13.10 List of abbreviations
                • List of abbreviations

              Research Methodology

              Technavio presents a detailed picture of the market by way of study, synthesis, and summation of data from multiple sources. The analysts have presented the various facets of the market with a particular focus on identifying the key industry influencers. The data thus presented is comprehensive, reliable, and the result of extensive research, both primary and secondary.

              INFORMATION SOURCES

              Primary sources

              • Manufacturers and suppliers
              • Channel partners
              • Industry experts
              • Strategic decision makers

              Secondary sources

              • Industry journals and periodicals
              • Government data
              • Financial reports of key industry players
              • Historical data
              • Press releases

              DATA ANALYSIS

              Data Synthesis

              • Collation of data
              • Estimation of key figures
              • Analysis of derived insights

              Data Validation

              • Triangulation with data models
              • Reference against proprietary databases
              • Corroboration with industry experts

              REPORT WRITING

              Qualitative

              • Market drivers
              • Market challenges
              • Market trends
              • Five forces analysis

              Quantitative

              • Market size and forecast
              • Market segmentation
              • Geographical insights
              • Competitive landscape

              Interested in this report?

              Get your sample now to see our research methodology and insights!

              Download Now

              Frequently Asked Questions

              Digital Packaging And Labeling market growth will increase by $ 22.2 bn during 2024-2028 .

              The Digital Packaging And Labeling market is expected to grow at a CAGR of 13.64% during 2024-2028 .

              Digital Packaging And Labeling market is segmented by End-user( Food and beverages, Personal care, Healthcare, Electronics, Others) Technology( Inkjet, Electrophotography, APAC, Middle East and Africa, South America)

              CCL Industries Inc., Cenveo Worldwide Ltd., Consolidated Label Co., DS Smith Plc, DuPont de Nemours Inc., Eastman Kodak Co., Essentra Plc, Flint Group, Hewlett Packard Enterprise Co., Lofton Label and Packaging Inc., Mondi Plc, Printpack Inc., Quad Graphics Inc., Quantum Print and Packaging Ltd., RR Donnelley and Sons Co., SAKATA INX CORP., Smurfit Kappa Group, THIMM Group GmbH plus Co. KG, Traco Manufacturing, Xeikon, Xerox Holdings Corp. are a few of the key vendors in the Digital Packaging And Labeling market.

              APAC will register the highest growth rate of 30% among the other regions. Therefore, the Digital Packaging And Labeling market in APAC is expected to garner significant business opportunities for the vendors during the forecast period.

              US, China, UK, Germany, Japan

              • Growing consumption of packaged beverages globallyThe consumption is further expected to record an average annual growth rate of around 2.8% during the forecast period.  The growing health consciousness among people is expected to decrease the consumption of carbonated soft drinks and increase the consumption of packaged water and fruit juices. The consumption of packaged milk and dairy beverages is also increasing across the world.The growing consumption of packed beverages globally is expected to increase the demand for digital packaging and labeling. Compared with analog printing is the driving factor this market.
              • digital packaging and printing can deliver unlimited product information. Digital or smart labels on products help end-users in accessing information about beverage products using the web and mobile applications. Many beverage manufacturers have been rigorously adopting digital packaging and labeling to efficiently communicate details about their products to consumers. Thus is the driving factor this market.
              • the growing consumption of packaged beverages globally is one of the major drivers is the driving factor this market.
              • which is expected to boost the growth of the global digital packaging and labeling market during the forecast period. is the driving factor this market.

              The Digital Packaging And Labeling market vendors should focus on grabbing business opportunities from the Food and beverages segment as it accounted for the largest market share in the base year.