
Digital Video Advertising Market Size 2025-2029
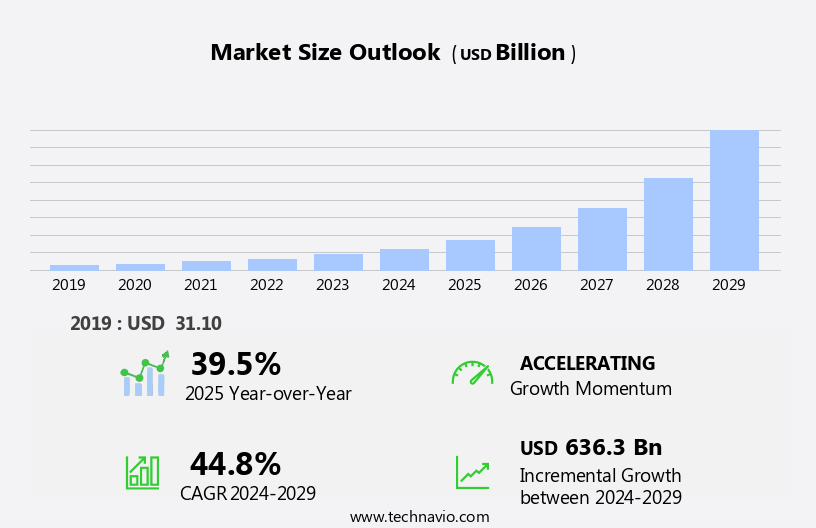
The digital video advertising market size is forecast to increase by USD 636.3 billion at a CAGR of 44.8% between 2024 and 2029.
- The market is experiencing significant growth, fueled by the increasing popularity of in-app advertising and the rising spending on online video and Connected Television (CTV) advertising. However, this market faces challenges as well. The growing use of advertisement blocking solutions poses a significant obstacle, with consumers increasingly adopting ad-blockers to avoid intrusive ads. GDPR and CCPA compliance safeguard consumer privacy, while conversion rate and mid-roll ads drive sales.
- Advertisers must navigate this challenge by implementing non-intrusive ad formats and focusing on delivering value to consumers. To capitalize on the market's opportunities, companies must stay abreast of the latest trends and consumer preferences, while also addressing the challenges to effectively engage audiences and maximize ROI. This trend is driven by the increasing consumption of digital content on mobile devices and smart TVs, providing advertisers with a vast audience base.
What will be the Size of the Digital Video Advertising Market during the forecast period?
Explore in-depth regional segment analysis with market size data - historical 2019-2023 and forecasts 2025-2029 - in the full report.
Request Free Sample
The market continues to evolve, with private marketplaces (PMPs) gaining traction as brands seek more control over their video content strategy and improved user experience (UX). Brand safety and ad quality scores are paramount, driving the demand for advanced competitive analysis tools. Influencer marketing and call-to-actions (CTAs) are essential components of effective video ad campaigns, with landing page optimization and programmatic guaranteed deals further enhancing campaign performance.
Video content production and viewability measurement are crucial aspects of video analytics dashboards, enabling businesses to optimize their social video advertising efforts in the open auction environment. Video ad spend is projected to increase significantly, fueled by the growing popularity of video content distribution across various platforms. New technologies, such as smart radio and voice over IP, are enabling seamless communication between terrestrial users and mobile radios, leading to increased interoperability and range accessibility.
How is this Digital Video Advertising Industry segmented?
The digital video advertising industry research report provides comprehensive data (region-wise segment analysis), with forecasts and estimates in "USD billion" for the period 2025-2029, as well as historical data from 2019-2023 for the following segments.
- End-user
- Retail
- Consumer goods and electronics
- Media and entertainment
- Automotive
- Others
- Type
- Desktop
- Mobile
- Service Type
- In-Stream video ads
- Out-Stream video ads
- Linear video ads
- Nonlinear video ads
- Others
- Geography
- North America
- US
- Canada
- Mexico
- Europe
- France
- Germany
- Italy
- UK
- APAC
- China
- India
- Japan
- Rest of World (ROW)
- North America
By End-user Insights
The Retail segment is estimated to witness significant growth during the forecast period. In the dynamic the market, various entities play pivotal roles in delivering effective and engaging campaigns for businesses. Marketers and brands leverage video ad serving to deliver skippable ads, ensuring a better user experience. Demand-side platforms (DSPs) facilitate real-time bidding (RTB) and frequency capping, optimizing ad delivery and preventing ad overexposure. Dynamic ad insertion and out-stream video ads expand reach, while ad fraud detection and verification maintain transparency and trust. Native video ads blend seamlessly with content, and programmatic advertising streamlines the buying process. Completion rate and click-through rate (CTR) are essential metrics, with over-the-top (OTT) ads and in-stream video ads catering to diverse audience preferences.
Brands invest in ad creative production and A/B testing for optimal campaign performance. Behavioral targeting, contextual targeting, and demographic targeting refine audience reach. Inventory management, creative optimization, and cross-device tracking ensure efficient ad delivery across platforms. Ad exchanges and header bidding enable competition among multiple buyers, driving up yields. Unskippable ads and interactive video ads capture user attention, while personalized video ads build stronger connections. Technological advancements, such as video player technology and attribution modeling, enhance the overall effectiveness of digital video advertising. Battery life concerns on smartphones have led consumers to seek out radio apps and music streaming platforms, which offer uninterrupted access to their favorite content.
The retail sector, driven by AI, data explosion, and the emergence of SMEs, is a significant market for digital video content, enabling businesses to understand consumer needs and optimize in-store experiences.
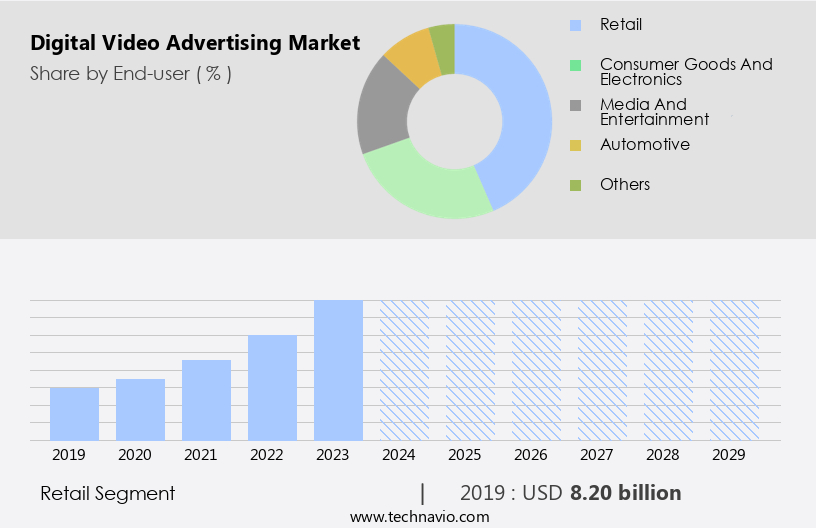
The Retail segment was valued at USD 8.20 billion in 2019 and showed a gradual increase during the forecast period.
The Digital Video Advertising Market is accelerating with the rise of mobile video ads, capturing audiences on-the-go with short, engaging content. Advertisers are increasingly using demand-side platform (DSP) to automate and optimize their ad buys, while publishers utilize supply-side platform (SSP) to maximize inventory value. These technologies converge within an ad exchange, enabling real-time bidding and improved targeting. Alongside this, traditional ad network still play a role in aggregating inventory and offering curated placements. The Digital Video Advertising Market is undergoing a strategic transformation fueled by innovations like private marketplace (PMP) deals. The market dynamics are influenced by the breakthrough of digital technology, which offers longer battery life, enhanced voice capabilities, and group chats.
Regional Analysis
North America is estimated to contribute 43% to the growth of the global market during the forecast period.Technavio's analysts have elaborately explained the regional trends and drivers that shape the market during the forecast period.
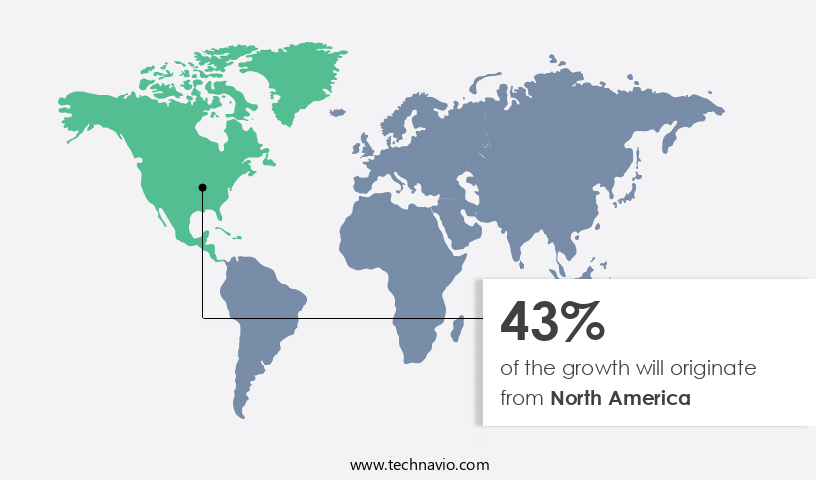
The market in North America is experiencing significant growth, driven by the increasing use of mobile devices and robust broadband infrastructure. In the US and Canada, the market's expansion is fueled by the saturation of traditional print and radio advertising, leading companies to invest more in digital video ads. Mobile ad spending is a major driver, as consumers spend more time on their devices for daily activities and content consumption. Skippable ads, a popular video ad format, are prevalent in the market, with demand-side platforms (DSPs) facilitating real-time bidding (RTB) and frequency capping to optimize ad delivery.
Dynamic ad insertion allows for customized content, while over-the-top (OTT) ads and native video ads cater to diverse viewer preferences. Ad fraud detection and verification ensure transparency and trust, while inventory management and creative optimization enhance campaign performance. Behavioral targeting and demographic targeting enable personalized ad delivery, increasing engagement and conversion rates. The market also incorporates various video ad formats, including pre-roll, mid-roll, and post-roll ads, as well as interactive and companion ads. Programmatic advertising and yield optimization streamline the buying and selling process, while gdpr and ccpap compliance maintain data privacy regulations. Video ad analytics provide valuable insights into viewer behavior and campaign effectiveness, allowing for continuous improvement and optimization.
The market's growth is further supported by video player technology, ad creative production, and a/b testing, ensuring a balance between engaging content and effective targeting.
Market Dynamics
Our researchers analyzed the data with 2024 as the base year, along with the key drivers, trends, and challenges. A holistic analysis of drivers will help companies refine their marketing strategies to gain a competitive advantage.
What are the Digital Video Advertising market drivers leading to the rise in the adoption of Industry?
- In-app advertising represents a significant and growing revenue source, serving as the primary market driver. The market is experiencing significant growth due to the increasing popularity of in-app advertisements. With mobile phone users spending over 80% of their time on apps compared to 20% on browsers, advertisers are increasingly focusing on this platform to reach their audience. In-app advertisements offer cost-effective solutions for both advertisers and app developers. Advertisers can target specific audiences based on data collected through the apps and cache files, while app developers generate revenue without charging users. Branded content plays a crucial role in digital video advertising, with ad networks providing creative production and campaign management services.
- A/B testing and behavioral targeting are essential tools for optimizing ad performance and reaching the right audience. Video ad analytics and GDPR compliance are essential considerations for advertisers, ensuring accurate measurement and adherence to privacy regulations. Video player technology and attribution modeling help advertisers understand the impact of their campaigns and optimize their ad spend accordingly. Pre-roll ads remain a popular format, emphasizing the importance of creating engaging and non-intrusive content to capture viewers' attention.
What are the Digital Video Advertising market trends shaping the Industry?
- The trend in advertising is shifting towards increased investments in online video and connected TV (CTV) advertising. This emerging market trend reflects the growing consumer preference for digital media consumption. Digital video advertising refers to promotional content that plays before, during, or after streaming media on various devices. Online video is a highly effective channel for reaching digital audiences, with spending on digital video ads projected to grow from USD62 billion in 2021 to USD91 billion in 2024. One of the fastest-growing formats of digital video ads is Connected TV (CTV), which delivers video content to multiple screens through partnerships with providers. Advertisers can leverage this medium to expand their reach and optimize costs. Advertisers can utilize various video ad formats, including overlay ads and in-stream video ads, and employ targeting strategies such as demographic and contextual targeting.
- Creative optimization and cross-device tracking are also essential components of successful digital video advertising campaigns. Ad exchanges facilitate the buying and selling of digital video ad inventory, while header bidding ensures advertisers have access to the most valuable inventory. Moreover, adhering to regulations such as CCPA compliance is crucial to maintaining consumer trust and avoiding potential legal issues. Interactive video ads offer opportunities for audience engagement and can enhance the overall advertising experience. Overall, digital video advertising offers a dynamic and engaging way for businesses to connect with their audiences across multiple devices.
How does Digital Video Advertising market faces challenges during its growth?
- The increasing adoption of advertisement blocking technologies poses a significant challenge to the expansion of the industry, as more users seek to avoid unwanted advertisements. Digital video advertising has become a significant marketing channel, allowing businesses to reach consumers through engaging content. However, the increasing use of ad-blockers by consumers has raised concerns about the relevance and value of online video ads. These extensions enable web browsers to consume content in an ad-free environment, blocking unwanted interruptions. To address this challenge, advanced video ad targeting techniques have emerged, such as personalized video ads and programmatic advertising. Programmatic advertising uses data-driven algorithms to deliver ads to specific audiences based on their interests and online behavior. Personalized video ads tailor content to individual viewers, increasing the likelihood of engagement and higher conversion rates.
- Video ad measurement is crucial in assessing the effectiveness of these campaigns. Key performance indicators (KPIs) like click-through rate (CTR) and conversion rate are essential metrics for evaluating ad performance. Supply-side platforms (SSPs) help publishers maximize their revenue by optimizing ad yield through real-time bidding and ad stitching. Marketers can also employ various video ad formats, including unskippable ads, mid-roll ads, and post-roll ads. Unskippable ads ensure that viewers engage with the content before continuing with the video, while mid-roll ads appear during natural breaks in the video and post-roll ads play after the video ends. Ad stitching is a technique that seamlessly integrates ads into the video content, creating a more engaging viewing experience. Digital video advertising continues to evolve, with advanced targeting techniques, measurement tools, and ad formats helping businesses reach and engage their audiences effectively.
Exclusive Customer Landscape
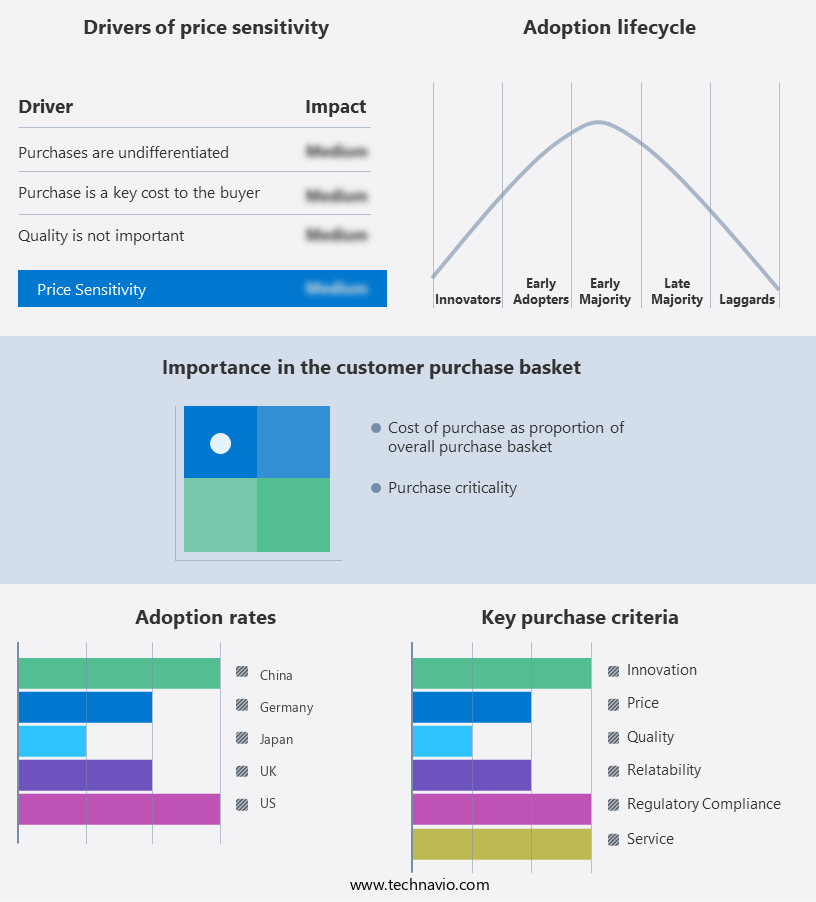
The digital video advertising market forecasting report includes the adoption lifecycle of the market, covering from the innovator's stage to the laggard's stage. It focuses on adoption rates in different regions based on penetration. Furthermore, the digital video advertising market report also includes key purchase criteria and drivers of price sensitivity to help companies evaluate and develop their market growth analysis strategies.
Customer Landscape
Key Companies & Market Insights
Companies are implementing various strategies, such as strategic alliances, digital video advertising market forecast, partnerships, mergers and acquisitions, geographical expansion, and product/service launches, to enhance their presence in the industry.
Advertise.com Inc. - This company specializes in digital video advertising, providing programmatic solutions for targeted placements on premium publisher networks.
The industry research and growth report includes detailed analyses of the competitive landscape of the market and information about key companies, including:
- Advertise.com Inc.
- Digital Turbine Inc.
- Kargo Global Inc.
- LinkedIn Corp.
- Longtail Ad Solutions Inc.
- MediaMath Inc.
- Meta Platforms Inc.
- Pinterest Inc.
- PubMatic Inc.
- Snap Inc.
- SpotX
- Tencent Holdings Ltd.
- Tik Tok
- Tremor International Ltd.
- Vdopia Inc.
- Verizon Communications Inc.
- Viant Technology LLC
- Vireo Video Inc.
- X Corp.
- YouTube
Qualitative and quantitative analysis of companies has been conducted to help clients understand the wider business environment as well as the strengths and weaknesses of key industry players. Data is qualitatively analyzed to categorize companies as pure play, category-focused, industry-focused, and diversified; it is quantitatively analyzed to categorize companies as dominant, leading, strong, tentative, and weak.
Recent Development and News in Digital Video Advertising Market
- In January 2024, Google announced the global expansion of its video advertising platform, YouTube Select, to 30 new markets. YouTube Select offers advertisers the ability to reach audiences across YouTube and Google Video Partner sites, allowing for more targeted and efficient digital video advertising (Google Press Release, 2024).
- In March 2024, Amazon and Roku entered into a strategic partnership, enabling Amazon's Fire TV devices to offer access to Amazon's free, ad-supported streaming service, IMDb TV. This collaboration expanded Amazon's reach in the market and provided Roku users with additional content options (Amazon Press Release, 2024).
- In May 2024, The Trade Desk, a leading independent demand-side platform, raised USD1.2 billion in a public offering. The funds will be used to fuel product innovation, expand their global footprint, and enhance their technology to better serve advertisers in the market (The Trade Desk Press Release, 2024).
- In February 2025, Disney and Comcast reached a significant agreement, allowing Disney to sell its ads on Comcast's streaming service, Peacock. This partnership granted Disney access to Comcast's vast audience, bolstering its digital video advertising capabilities (Disney Press Release, 2025).
Research Analyst Overview
The market continues to evolve, with dynamic market activities shaping its landscape. Video ad serving and targeting have become increasingly sophisticated, enabling advertisers to reach their audiences more effectively through various formats. Unskippable ads and programmatic advertising have gained popularity, driving up completion rates and conversion. Meanwhile, supply-side platforms (SSPs) have emerged as essential players, optimizing inventory management and yield. Real-time bidding (RTB) and contextual targeting have revolutionized the way ads are bought and sold, allowing for more precise and efficient campaigns. Frequency capping and ad fraud detection ensure brand safety and prevent overexposure, while dynamic ad insertion and creative optimization enable personalized messaging and increased engagement.
Over-the-top (OTT) ads and native video ads offer new opportunities for reaching consumers across various devices. Branded content and ad creative production have become essential components of successful video campaigns, with A/B testing and attribution modeling allowing for continuous optimization. GDPR and CCPA compliance, ad verification, and video player technology ensure regulatory compliance and high-quality user experiences. Pre-roll, mid-roll, and post-roll ads continue to dominate the video ad formats, with interactive and overlay ads offering additional engagement opportunities. Inventory management, header bidding, and cross-device tracking enable seamless campaign management and improved performance. The ongoing evolution of video advertising is driven by the continuous integration of advanced technologies and evolving consumer behaviors, making it an exciting and dynamic market to watch.
Dive into Technavio's robust research methodology, blending expert interviews, extensive data synthesis, and validated models for unparalleled Digital Video Advertising Market insights. See full methodology.
|
Market Scope |
|
|
Report Coverage |
Details |
|
Page number |
230 |
|
Base year |
2024 |
|
Historic period |
2019-2023 |
|
Forecast period |
2025-2029 |
|
Growth momentum & CAGR |
Accelerate at a CAGR of 44.8% |
|
Market growth 2025-2029 |
USD 636.3 billion |
|
Market structure |
Fragmented |
|
YoY growth 2024-2025(%) |
39.5 |
|
Key countries |
US, China, Canada, UK, Germany, Japan, France, Mexico, India, and Italy |
|
Competitive landscape |
Leading Companies, Market Positioning of Companies, Competitive Strategies, and Industry Risks |
What are the Key Data Covered in this Digital Video Advertising Market Research and Growth Report?
- CAGR of the Digital Video Advertising industry during the forecast period
- Detailed information on factors that will drive the growth and forecasting between 2025 and 2029
- Precise estimation of the size of the market and its contribution of the industry in focus to the parent market
- Accurate predictions about upcoming growth and trends and changes in consumer behaviour
- Growth of the market across North America, APAC, Europe, South America, and Middle East and Africa
- Thorough analysis of the market's competitive landscape and detailed information about companies
- Comprehensive analysis of factors that will challenge the digital video advertising market growth of industry companies
We can help! Our analysts can customize this digital video advertising market research report to meet your requirements.
 RIA -
RIA - 
