Dips and Spreads Market Analysis APAC, North America, Europe, South America, Middle East and Africa - US, Canada, Australia, UK, France - Size and Forecast 2024-2028

Dips and Spreads Market Analysis APAC, North America, Europe, South America, Middle East and Africa - US, Canada, Australia, UK, France - Size and Forecast 2024-2028

Published: Jan 2024 152 Pages SKU: IRTNTR77189

Market Overview at a Glance

$29.85 B
Market Opportunity
5.82%
CAGR
4.81
YoY growth 2023-2024(%)

Dips and Spreads Market Size 2024-2028 

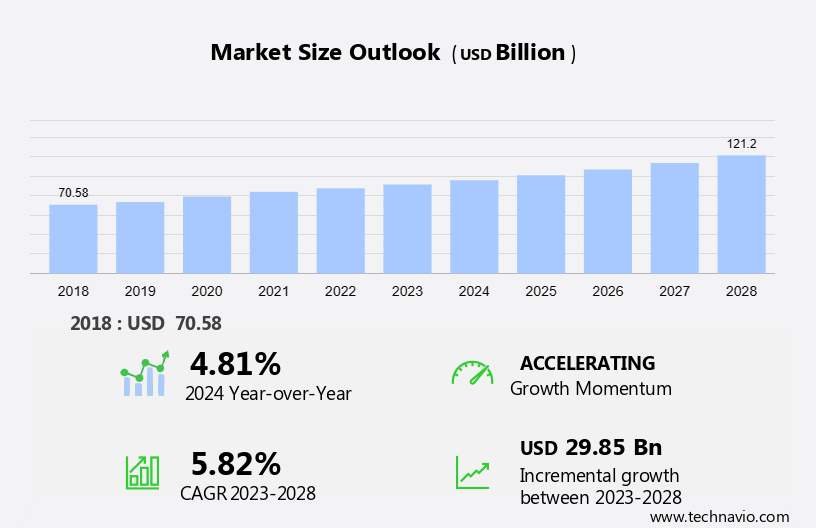
The dips and spreads market size is forecast to increase by USD 29.85 billion at a CAGR of 5.82% between 2023 and 2028.

  • The market is witnessing significant growth due to the increasing popularity of appetizers and finger food in the US. Ethnic and international cuisines, such as dumplings, pita bread, and seafood dips, are gaining traction among consumers, driving market expansion. Additionally, there is a growing emphasis on clean-label food products, with consumers preferring dips and spreads made from natural ingredients and free from artificial additives.
  • Rise in allergens and dietary restrictions is driving the creation of alternative options, such as dips made from raw vegetables, meat, and plant-based proteins. Common pairings like crackers, fruits, tortilla chips, and potato chips are further contributing to the market's growth.

What will be the Dips and Spreads Market Size During the Forecast Period?

Dips and Spreads Market Size

 Request Free Sample

  • The market has witnessed significant growth in recent years, with established brands continually expanding their product lines to capture consumer attention. The market encompasses a diverse range of offerings, including thick sauces for Mexican food, natural spreads, and plant-based alternatives catering to the vegan movements. Consumer preferences for dips and spreads are driven by factors such as taste, product quality, and food safety. Brands focus on delivering authentic flavors and textures to meet the evolving demands of consumers. Incorporating high-quality raw materials and ensuring food safety throughout the supply chain is essential for maintaining consumer trust and loyalty. Appetizers, finger foods, and snack foods are popular categories for dips and spreads. Consumers enjoy pairing these items with pita bread, dumplings, seafood, and nachos, or simply using them as a spread on crackers. The versatility of dips and spreads makes them a staple in various culinary applications, from casual gatherings to fine dining experiences. Mexican food, with its vibrant flavors and rich textures, has a substantial presence in the market. Guacamole, salsa, and queso dips are among the most popular choices for consumers.
  • Moreover, the market also offers a wide array of nut-based spreads, providing plant-based alternatives for those following vegan diets or seeking healthier options. Restaurants and foodservice establishments are significant contributors to the market. They offer a diverse range of dips and spreads to cater to various tastes and dietary preferences. The convenience and versatility of these products make them an essential component of many restaurant menus, enhancing the overall dining experience for customers. In conclusion, the market continues to grow as consumers seek out authentic, high-quality, and diverse offerings. Brands that prioritize consumer preferences, food safety, and supply chain transparency are well-positioned to succeed in this competitive landscape. The market's continued expansion is driven by trends such as the increasing popularity of plant-based alternatives, the vegan movements, and the versatility of dips and spreads in various culinary applications.

How is this market segmented and which is the largest segment?

The market research report provides comprehensive data (region-wise segment analysis), with forecasts and estimates in "USD billion" for the period 2024-2028, as well as historical data from 2018-2022 for the following segments.

  • Distribution Channel
    • Offline
    • Online
  • End-user
    • Foodservice industry
    • Household
  • Geography
    • APAC
    • North America
      • Canada
      • US
    • Europe
      • UK
      • France
    • South America
    • Middle East and Africa

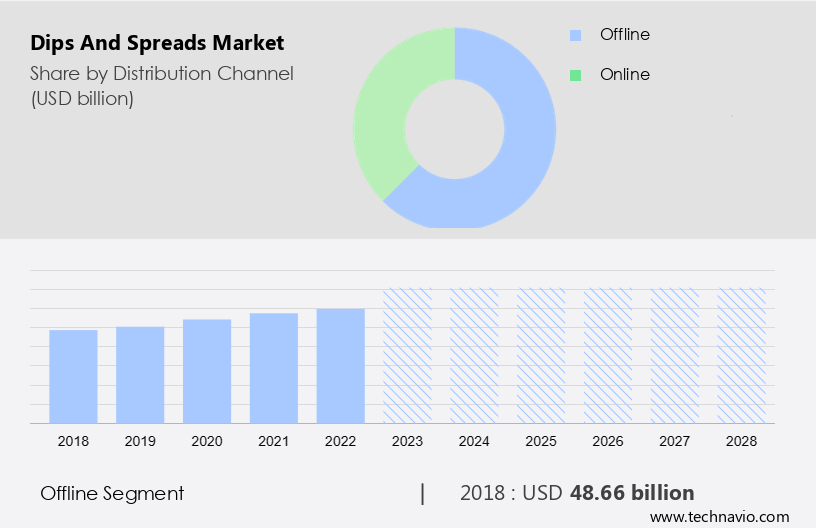
By Distribution Channel Insights

  • The offline segment is estimated to witness significant growth during the forecast period.

In the United States, offline distribution channels play a crucial role in the expansion of the market. A multitude of retail outlets contribute substantially to the sales and distribution of these products, addressing the diverse demands of various consumer segments. Supermarkets, hypermarkets, and grocery stores are primary channels, providing a vast selection of brands, flavors, and packaging sizes for consumers' convenience. Specialty food stores specialize in gourmet or health-conscious options, stocking a curated range of high-end and unique dips and spreads, catering to consumers seeking premium or specialized products. Popular spreads in the US market include plant-derived options such as jellies, jams, and honey, as well as meat-based spreads like pate and marmite equivalents such as vegemite.

Additionally, flavor-driven spreads like gochujang, chimichurri, and peri peri continue to gain traction. While some spreads offer nutritional benefits, others may contribute to unhealthy snacking habits. Margarine, a common spread, has faced competition from healthier alternatives like olive oil spreads and nut butters. Overall, the US market is characterized by a wide array of offerings, catering to various consumer preferences and dietary needs.

Dips and Spreads Market Size

Get a glance at the market report of share of various segments Request Free Sample

The Offline segment was valued at USD 48.66 billion in 2018 and showed a gradual increase during the forecast period.

Regional Analysis

  • APAC is estimated to contribute 42% to the growth of the global market during the forecast period.

Technavio's analysts have elaborately explained the regional trends and drivers that shape the market during the forecast period.

Dips and Spreads Market Share by Geography

For more insights on the market share of various regions, Request Free Sample

The Asia Pacific (APAC) region is witnessing a notable expansion in the market for dips and spreads, driven by several factors. Consumer preferences are evolving, leading to a growing demand for convenient and flavorful options. Urbanization and rising disposable incomes are contributing to the increasing popularity of ready-to-eat foods, with dips and spreads serving as ideal accompaniments. The food service industry is also expanding, providing more opportunities for dips and spreads in various settings. In the APAC region, countries like China, India, Japan, South Korea, and Southeast Asian nations are experiencing a significant increase in the consumption of convenience foods and snacks.

This trend is particularly prominent in urban areas, where busy lifestyles and changing demographics are driving demand. Dips and spreads, including thick sauces, Mexican food staples like nachos and salsa, natural spreads, plant-based and vegan options, and nut-based spreads, are gaining popularity. PepsiCo, a leading player in the global food and beverage industry, has recognized this trend and is expanding its offerings in the market. The company's D2C (Direct-to-Consumer) initiatives and partnerships with restaurants and food service providers are aimed at capitalizing on this growth. The cheese segment, a significant contributor to the dips market, is expected to continue its dominance, while vegetable dips and sauces are also gaining traction due to health-conscious consumer preferences.

Market Dynamics

Our researchers analyzed the data with 2023 as the base year, along with the key drivers, trends, and challenges. A holistic analysis of drivers will help companies refine their marketing strategies to gain a competitive advantage.

What are the key market drivers leading to the rise in adoption of Dips and Spreads Market?

Increasing influence of ethnic and international cuisines on dips and spreads is the key driver of the market.

  • The market is witnessing significant growth due to the increasing consumer interest in ethnic and international cuisines. As globalization broadens cultural connections, consumers in the United States are increasingly seeking authentic and exotic flavors, leading to a heightened demand for dips and spreads inspired by diverse culinary traditions. Brands are responding to this trend by expanding their product offerings to cater to specific regional tastes, such as Mediterranean, Middle Eastern, Latin American, Asian, and African-inspired varieties. Established brands and artisanal producers are focusing on taste, product quality, and food safety to capture consumer attention. The hummus segment, in particular, has gained popularity due to its nutritional value and plant-based protein content.
  • However, consumers are also mindful of saturated fat content and are looking for healthier alternatives. The jars segment of the market is growing, with glass jars becoming a preferred packaging material due to their premium look and appeal. Supply chain and raw material sourcing are crucial considerations for brands, ensuring a steady supply of high-quality ingredients and maintaining transparency in their production processes. Mediterranean cuisine, with its rich and diverse flavors, continues to dominate the market. Consumers are drawn to the authentic taste and health benefits of these products, making them a staple in many households. As the market evolves, brands are focusing on innovation and product development to meet the changing needs and preferences of consumers.

What are the market trends shaping the Dips and Spreads Market?

Increasing emphasis on clean-label food products is the upcoming trend in the market.

  • The preference for clean label foods continues to gain traction in the market in the United States, as consumers increasingly prioritize natural and transparent ingredients. This trend is fueled by a heightened awareness and concern regarding the components in the food we consume. As a result, there is a burgeoning demand for dips and spreads with clear labels, devoid of artificial flavors, colors, preservatives, and additives. Consumers are drawn to products featuring recognizable and natural ingredients, such as herbs, spices, vegetables, and whole foods. In response, manufacturers are modifying their formulations to include shorter ingredient lists and eschewing artificial additives.
  • Dips and spreads made with seafood, raw vegetables, meat, fruits, tortilla chips, potato chips, pita bread, and dumplings are popular choices among consumers. Spreads like hummus, guacamole, and falafel are favored for their rich textures and flavors, often served with a knife and bread or dishes like pita or tortilla chips.

What challenges does Dips and Spreads Market face during the growth?

Increase in prevalence of allergens and dietary restrictions is a key challenge affecting the market growth.

  • The market in the United States is witnessing significant growth due to the increasing demand for gourmet products and natural, nutritious ingredients. Product offerings in this market include hummus, guacamole, salsa, cheese spreads, and vegetable dip, available in various forms such as jars, tubs/tubes, and single-serve packets. However, catering to the diverse dietary needs and restrictions of consumers, including allergies to common ingredients like nuts, dairy, gluten, and soy, as well as veganism and paleo diets, poses a challenge for manufacturers.
  • Creating allergen-free or hypoallergenic dips and spreads necessitates careful ingredient sourcing, production processes, and cross-contamination prevention. Proper labeling practices are essential to accurately communicate potential allergens and adhere to regulatory standards, ensuring consumer trust and food safety. The online retail segment, including foodservice and retail stores, plays a crucial role in the distribution of these products. Key players in the market include Hummus Bowl, Sabra, and Newman's Own, among others.

Exclusive Customer Landscape

The market forecasting report includes the adoption lifecycle of the market, covering from the innovator's stage to the laggard's stage. It focuses on adoption rates in different regions based on penetration. Furthermore, the market report also includes key purchase criteria and drivers of price sensitivity to help companies evaluate and develop their market growth analysis strategies.
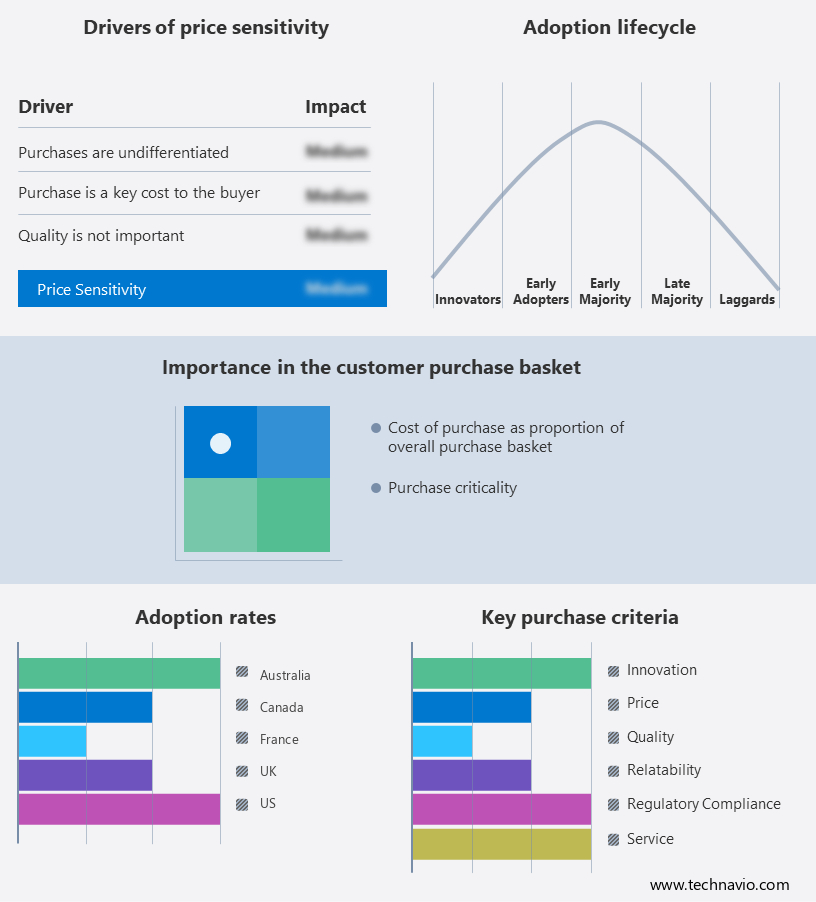
Dips and Spreads Market Share by Geography

 Customer Landscape

Key Companies & Market Insights

Companies are implementing various strategies, such as strategic alliances, market forecast , partnerships, mergers and acquisitions, geographical expansion, and product/service launches, to enhance their presence in the market.

The market research and growth report includes detailed analyses of the competitive landscape of the market and information about key companies, including:

  • Andros Group
  • Arizona Spice Company LLC
  • AVT Gavia Foods Pvt. Ltd
  • Campbell Soup Co.
  • Conagra Brands Inc.
  • Cornitos
  • Del Monte Pacific Ltd.
  • Dr. August Oetker KG
  • Euro American Brands LLC
  • Ferrero International S.A.
  • Hormel Foods Corp.
  • McCormick and Co. Inc.
  • PepsiCo Inc.
  • Renfro Foods
  • Sandridge Crafted Foods
  • The Hershey Co.
  • The Kraft Heinz Co.
  • VRB CONSUMER PRODUCTS Pvt. Ltd.
  • Wingreens Farms Pvt. Ltd.
  • Yihai International Holding Ltd

Qualitative and quantitative analysis of companies has been conducted to help clients understand the wider business environment as well as the strengths and weaknesses of key market players. Data is qualitatively analyzed to categorize companies as pure play, category-focused, industry-focused, and diversified; it is quantitatively analyzed to categorize companies as dominant, leading, strong, tentative, and weak.

Research Analyst Overview

Dips and spreads have become a popular choice for consumers seeking delicious and nutritious additions to their appetizers, snacks, and meals. Established brands dominate the market with diverse product offerings, catering to various consumer preferences. Taste and product quality are key factors driving consumer attention, with an emphasis on food safety and ethical supply chains. The hummus segment, a staple in Mediterranean cuisine, leads the market due to its nutritious value and plant-based protein content. Consumers prefer jars over tubs/tubes, tubs, or single-serve packets for a premium look and artisanal feel. Packaging materials, such as glass jars, also contribute to the premium image of these products. The online retail segment has seen significant growth due to the convenience it offers. Natural and nutritious ingredients are in high demand, with a focus on reducing unhealthy ingredients like saturated fat, salt, sugar, and unhealthy fats. New product types, such as plant-derived spreads, jellies, jams, and honey, are gaining popularity. Flavor-driven spreads, like gochujang, chimichurri, and peri peri, are influencing consumer buying decisions.

Moreover, the market demand for unrivaled flavors continues to rise, with rapid urbanization and altered eating habits driving sales. Refrigeration and storage are crucial factors in the market, ensuring product freshness and shelf life. Market trends include the influence of vegan movements and the rise of nut-based spreads. The food service industry, including restaurants and foodservice segments, also contributes significantly to the market growth. Thick sauces, like mayonnaise and cheese spreads, and vegetable dips remain popular choices. The cheese segment continues to dominate, with Mexican food and sauces gaining traction. The market also caters to various sectors, including B2B and B2C, and the direct-to-consumer (D2C) channel. The market research report on dips and spreads covers various aspects, including product types, market trends, and consumer preferences. It provides insights into the market's future growth potential and key challenges.

Market Scope

Report Coverage

Details

Page number

152

Base year

2023

Historic period

2018-2022

Forecast period

2024-2028

Growth momentum & CAGR

Accelerate at a CAGR of 5.82%

Market growth 2024-2028

USD 29.85 billion

Market structure

Fragmented

YoY growth 2023-2024(%)

4.81

Key countries

US, Canada, Australia, UK, and France

Competitive landscape

Leading Companies, Market Positioning of Companies, Competitive Strategies, and Industry Risks

Request Free Sample

What are the Key Data Covered in this Market Research and Growth Report?

  • CAGR of the market during the forecast period
  • Detailed information on factors that will drive the market growth and forecasting between 2024 and 2028
  • Precise estimation of the size of the market  and its contribution of the market in focus to the parent market
  • Accurate predictions about upcoming market growth and trends and changes in consumer behaviour
  • Growth of the market across APAC, North America, Europe, South America, and Middle East and Africa
  • Thorough analysis of the market's competitive landscape and detailed information about companies
  • Comprehensive analysis of factors that will challenge the growth of market companies

We can help! Our analysts can customize this market research report to meet your requirements. Get in touch

1 Executive Summary

  • 1.1 Market overview
    • Exhibit 01: Executive Summary – Chart on Market Overview
    • Exhibit 02: Executive Summary – Data Table on Market Overview
    • Exhibit 03: Executive Summary – Chart on Global Market Characteristics
    • Exhibit 04: Executive Summary – Chart on Market by Geography
    • Exhibit 05: Executive Summary – Chart on Market Segmentation by Distribution Channel
    • Exhibit 06: Executive Summary – Chart on Market Segmentation by End-user
    • Exhibit 07: Executive Summary – Chart on Incremental Growth
    • Exhibit 08: Executive Summary – Data Table on Incremental Growth
    • Exhibit 09: Executive Summary – Chart on Vendor Market Positioning

2 Market Landscape

  • 2.1 Market ecosystem
    • Exhibit 10: Parent market
    • Exhibit 11: Market Characteristics

3 Market Sizing

  • 3.1 Market definition
    • Exhibit 12: Offerings of vendors included in the market definition
  • 3.2 Market segment analysis
    • Exhibit 13: Market segments
  • 3.3 Market size 2023
    • 3.4 Market outlook: Forecast for 2023-2028
      • Exhibit 14: Chart on Global - Market size and forecast 2023-2028 ($ billion)
      • Exhibit 15: Data Table on Global - Market size and forecast 2023-2028 ($ billion)
      • Exhibit 16: Chart on Global Market: Year-over-year growth 2023-2028 (%)
      • Exhibit 17: Data Table on Global Market: Year-over-year growth 2023-2028 (%)

    4 Historic Market Size

    • 4.1 Global dips and spreads market 2018 - 2022
      • Exhibit 18: Historic Market Size – Data Table on global dips and spreads market 2018 - 2022 ($ billion)
    • 4.2 Distribution Channel Segment Analysis 2018 - 2022
      • Exhibit 19: Historic Market Size – Distribution Channel Segment 2018 - 2022 ($ billion)
    • 4.3 End-user Segment Analysis 2018 - 2022
      • Exhibit 20: Historic Market Size – End-user Segment 2018 - 2022 ($ billion)
    • 4.4 Geography Segment Analysis 2018 - 2022
      • Exhibit 21: Historic Market Size – Geography Segment 2018 - 2022 ($ billion)
    • 4.5 Country Segment Analysis 2018 - 2022
      • Exhibit 22: Historic Market Size – Country Segment 2018 - 2022 ($ billion)

    5 Five Forces Analysis

    • 5.1 Five forces summary
      • Exhibit 23: Five forces analysis - Comparison between 2023 and 2028
    • 5.2 Bargaining power of buyers
      • Exhibit 24: Chart on Bargaining power of buyers – Impact of key factors 2023 and 2028
    • 5.3 Bargaining power of suppliers
      • Exhibit 25: Bargaining power of suppliers – Impact of key factors in 2023 and 2028
    • 5.4 Threat of new entrants
      • Exhibit 26: Threat of new entrants – Impact of key factors in 2023 and 2028
    • 5.5 Threat of substitutes
      • Exhibit 27: Threat of substitutes – Impact of key factors in 2023 and 2028
    • 5.6 Threat of rivalry
      • Exhibit 28: Threat of rivalry – Impact of key factors in 2023 and 2028
    • 5.7 Market condition
      • Exhibit 29: Chart on Market condition - Five forces 2023 and 2028

    6 Market Segmentation by Distribution Channel

    • 6.1 Market segments
      • Exhibit 30: Chart on Distribution Channel - Market share 2023-2028 (%)
      • Exhibit 31: Data Table on Distribution Channel - Market share 2023-2028 (%)
    • 6.2 Comparison by Distribution Channel
      • Exhibit 32: Chart on Comparison by Distribution Channel
      • Exhibit 33: Data Table on Comparison by Distribution Channel
    • 6.3 Offline - Market size and forecast 2023-2028
      • Exhibit 34: Chart on Offline - Market size and forecast 2023-2028 ($ billion)
      • Exhibit 35: Data Table on Offline - Market size and forecast 2023-2028 ($ billion)
      • Exhibit 36: Chart on Offline - Year-over-year growth 2023-2028 (%)
      • Exhibit 37: Data Table on Offline - Year-over-year growth 2023-2028 (%)
    • 6.4 Online - Market size and forecast 2023-2028
      • Exhibit 38: Chart on Online - Market size and forecast 2023-2028 ($ billion)
      • Exhibit 39: Data Table on Online - Market size and forecast 2023-2028 ($ billion)
      • Exhibit 40: Chart on Online - Year-over-year growth 2023-2028 (%)
      • Exhibit 41: Data Table on Online - Year-over-year growth 2023-2028 (%)
    • 6.5 Market opportunity by Distribution Channel
      • Exhibit 42: Market opportunity by Distribution Channel ($ billion)
      • Exhibit 43: Data Table on Market opportunity by Distribution Channel ($ billion)

    7 Market Segmentation by End-user

    • 7.1 Market segments
      • Exhibit 44: Chart on End-user - Market share 2023-2028 (%)
      • Exhibit 45: Data Table on End-user - Market share 2023-2028 (%)
    • 7.2 Comparison by End-user
      • Exhibit 46: Chart on Comparison by End-user
      • Exhibit 47: Data Table on Comparison by End-user
    • 7.3 Foodservice industry - Market size and forecast 2023-2028
      • Exhibit 48: Chart on Foodservice industry - Market size and forecast 2023-2028 ($ billion)
      • Exhibit 49: Data Table on Foodservice industry - Market size and forecast 2023-2028 ($ billion)
      • Exhibit 50: Chart on Foodservice industry - Year-over-year growth 2023-2028 (%)
      • Exhibit 51: Data Table on Foodservice industry - Year-over-year growth 2023-2028 (%)
    • 7.4 Household - Market size and forecast 2023-2028
      • Exhibit 52: Chart on Household - Market size and forecast 2023-2028 ($ billion)
      • Exhibit 53: Data Table on Household - Market size and forecast 2023-2028 ($ billion)
      • Exhibit 54: Chart on Household - Year-over-year growth 2023-2028 (%)
      • Exhibit 55: Data Table on Household - Year-over-year growth 2023-2028 (%)
    • 7.5 Market opportunity by End-user
      • Exhibit 56: Market opportunity by End-user ($ billion)
      • Exhibit 57: Data Table on Market opportunity by End-user ($ billion)

    8 Customer Landscape

    • 8.1 Customer landscape overview
      • Exhibit 58: Analysis of price sensitivity, lifecycle, customer purchase basket, adoption rates, and purchase criteria

    9 Geographic Landscape

    • 9.1 Geographic segmentation
      • Exhibit 59: Chart on Market share by geography 2023-2028 (%)
      • Exhibit 60: Data Table on Market share by geography 2023-2028 (%)
    • 9.2 Geographic comparison
      • Exhibit 61: Chart on Geographic comparison
      • Exhibit 62: Data Table on Geographic comparison
    • 9.3 APAC - Market size and forecast 2023-2028
      • Exhibit 63: Chart on APAC - Market size and forecast 2023-2028 ($ billion)
      • Exhibit 64: Data Table on APAC - Market size and forecast 2023-2028 ($ billion)
      • Exhibit 65: Chart on APAC - Year-over-year growth 2023-2028 (%)
      • Exhibit 66: Data Table on APAC - Year-over-year growth 2023-2028 (%)
    • 9.4 North America - Market size and forecast 2023-2028
      • Exhibit 67: Chart on North America - Market size and forecast 2023-2028 ($ billion)
      • Exhibit 68: Data Table on North America - Market size and forecast 2023-2028 ($ billion)
      • Exhibit 69: Chart on North America - Year-over-year growth 2023-2028 (%)
      • Exhibit 70: Data Table on North America - Year-over-year growth 2023-2028 (%)
    • 9.5 Europe - Market size and forecast 2023-2028
      • Exhibit 71: Chart on Europe - Market size and forecast 2023-2028 ($ billion)
      • Exhibit 72: Data Table on Europe - Market size and forecast 2023-2028 ($ billion)
      • Exhibit 73: Chart on Europe - Year-over-year growth 2023-2028 (%)
      • Exhibit 74: Data Table on Europe - Year-over-year growth 2023-2028 (%)
    • 9.6 South America - Market size and forecast 2023-2028
      • Exhibit 75: Chart on South America - Market size and forecast 2023-2028 ($ billion)
      • Exhibit 76: Data Table on South America - Market size and forecast 2023-2028 ($ billion)
      • Exhibit 77: Chart on South America - Year-over-year growth 2023-2028 (%)
      • Exhibit 78: Data Table on South America - Year-over-year growth 2023-2028 (%)
    • 9.7 Middle East and Africa - Market size and forecast 2023-2028
      • Exhibit 79: Chart on Middle East and Africa - Market size and forecast 2023-2028 ($ billion)
      • Exhibit 80: Data Table on Middle East and Africa - Market size and forecast 2023-2028 ($ billion)
      • Exhibit 81: Chart on Middle East and Africa - Year-over-year growth 2023-2028 (%)
      • Exhibit 82: Data Table on Middle East and Africa - Year-over-year growth 2023-2028 (%)
    • 9.8 US - Market size and forecast 2023-2028
      • Exhibit 83: Chart on US - Market size and forecast 2023-2028 ($ billion)
      • Exhibit 84: Data Table on US - Market size and forecast 2023-2028 ($ billion)
      • Exhibit 85: Chart on US - Year-over-year growth 2023-2028 (%)
      • Exhibit 86: Data Table on US - Year-over-year growth 2023-2028 (%)
    • 9.9 Australia - Market size and forecast 2023-2028
      • Exhibit 87: Chart on Australia - Market size and forecast 2023-2028 ($ billion)
      • Exhibit 88: Data Table on Australia - Market size and forecast 2023-2028 ($ billion)
      • Exhibit 89: Chart on Australia - Year-over-year growth 2023-2028 (%)
      • Exhibit 90: Data Table on Australia - Year-over-year growth 2023-2028 (%)
    • 9.10 UK - Market size and forecast 2023-2028
      • Exhibit 91: Chart on UK - Market size and forecast 2023-2028 ($ billion)
      • Exhibit 92: Data Table on UK - Market size and forecast 2023-2028 ($ billion)
      • Exhibit 93: Chart on UK - Year-over-year growth 2023-2028 (%)
      • Exhibit 94: Data Table on UK - Year-over-year growth 2023-2028 (%)
    • 9.11 France - Market size and forecast 2023-2028
      • Exhibit 95: Chart on France - Market size and forecast 2023-2028 ($ billion)
      • Exhibit 96: Data Table on France - Market size and forecast 2023-2028 ($ billion)
      • Exhibit 97: Chart on France - Year-over-year growth 2023-2028 (%)
      • Exhibit 98: Data Table on France - Year-over-year growth 2023-2028 (%)
    • 9.12 Canada - Market size and forecast 2023-2028
      • Exhibit 99: Chart on Canada - Market size and forecast 2023-2028 ($ billion)
      • Exhibit 100: Data Table on Canada - Market size and forecast 2023-2028 ($ billion)
      • Exhibit 101: Chart on Canada - Year-over-year growth 2023-2028 (%)
      • Exhibit 102: Data Table on Canada - Year-over-year growth 2023-2028 (%)
    • 9.13 Market opportunity by geography
      • Exhibit 103: Market opportunity by geography ($ billion)
      • Exhibit 104: Data Tables on Market opportunity by geography ($ billion)

    10 Drivers, Challenges, and Trends

    • 10.1 Market drivers
      • 10.2 Market challenges
        • 10.3 Impact of drivers and challenges
          • Exhibit 105: Impact of drivers and challenges in 2023 and 2028
        • 10.4 Market trends

          11 Vendor Landscape

          • 11.1 Overview
            • 11.2 Vendor landscape
              • Exhibit 106: Overview on Criticality of inputs and Factors of differentiation
            • 11.3 Landscape disruption
              • Exhibit 107: Overview on factors of disruption
            • 11.4 Industry risks
              • Exhibit 108: Impact of key risks on business

            12 Vendor Analysis

            • 12.1 Vendors covered
              • Exhibit 109: Vendors covered
            • 12.2 Market positioning of vendors
              • Exhibit 110: Matrix on vendor position and classification
            • 12.3 Andros Group
              • Exhibit 111: Andros Group - Overview
              • Exhibit 112: Andros Group - Product / Service
              • Exhibit 113: Andros Group - Key offerings
            • 12.4 Arizona Spice Company LLC
              • Exhibit 114: Arizona Spice Company LLC - Overview
              • Exhibit 115: Arizona Spice Company LLC - Product / Service
              • Exhibit 116: Arizona Spice Company LLC - Key offerings
            • 12.5 Campbell Soup Co.
              • Exhibit 117: Campbell Soup Co. - Overview
              • Exhibit 118: Campbell Soup Co. - Business segments
              • Exhibit 119: Campbell Soup Co. - Key offerings
              • Exhibit 120: Campbell Soup Co. - Segment focus
            • 12.6 Conagra Brands Inc.
              • Exhibit 121: Conagra Brands Inc. - Overview
              • Exhibit 122: Conagra Brands Inc. - Business segments
              • Exhibit 123: Conagra Brands Inc. - Key news
              • Exhibit 124: Conagra Brands Inc. - Key offerings
              • Exhibit 125: Conagra Brands Inc. - Segment focus
            • 12.7 Cornitos
              • Exhibit 126: Cornitos - Overview
              • Exhibit 127: Cornitos - Product / Service
              • Exhibit 128: Cornitos - Key offerings
            • 12.8 Del Monte Pacific Ltd.
              • Exhibit 129: Del Monte Pacific Ltd. - Overview
              • Exhibit 130: Del Monte Pacific Ltd. - Business segments
              • Exhibit 131: Del Monte Pacific Ltd. - Key offerings
              • Exhibit 132: Del Monte Pacific Ltd. - Segment focus
            • 12.9 Dr. August Oetker KG
              • Exhibit 133: Dr. August Oetker KG - Overview
              • Exhibit 134: Dr. August Oetker KG - Product / Service
              • Exhibit 135: Dr. August Oetker KG - Key offerings
            • 12.10 McCormick and Co. Inc.
              • Exhibit 136: McCormick and Co. Inc. - Overview
              • Exhibit 137: McCormick and Co. Inc. - Business segments
              • Exhibit 138: McCormick and Co. Inc. - Key offerings
              • Exhibit 139: McCormick and Co. Inc. - Segment focus
            • 12.11 PepsiCo Inc.
              • Exhibit 140: PepsiCo Inc. - Overview
              • Exhibit 141: PepsiCo Inc. - Business segments
              • Exhibit 142: PepsiCo Inc. - Key news
              • Exhibit 143: PepsiCo Inc. - Key offerings
              • Exhibit 144: PepsiCo Inc. - Segment focus
            • 12.12 Renfro Foods
              • Exhibit 145: Renfro Foods - Overview
              • Exhibit 146: Renfro Foods - Product / Service
              • Exhibit 147: Renfro Foods - Key offerings
            • 12.13 Sandridge Crafted Foods
              • Exhibit 148: Sandridge Crafted Foods - Overview
              • Exhibit 149: Sandridge Crafted Foods - Product / Service
              • Exhibit 150: Sandridge Crafted Foods - Key offerings
            • 12.14 The Kraft Heinz Co.
              • Exhibit 151: The Kraft Heinz Co. - Overview
              • Exhibit 152: The Kraft Heinz Co. - Business segments
              • Exhibit 153: The Kraft Heinz Co. - Key offerings
              • Exhibit 154: The Kraft Heinz Co. - Segment focus
            • 12.15 VRB CONSUMER PRODUCTS Pvt. Ltd.
              • Exhibit 155: VRB CONSUMER PRODUCTS Pvt. Ltd. - Overview
              • Exhibit 156: VRB CONSUMER PRODUCTS Pvt. Ltd. - Product / Service
              • Exhibit 157: VRB CONSUMER PRODUCTS Pvt. Ltd. - Key offerings
            • 12.16 Wingreens Farms Pvt. Ltd.
              • Exhibit 158: Wingreens Farms Pvt. Ltd. - Overview
              • Exhibit 159: Wingreens Farms Pvt. Ltd. - Product / Service
              • Exhibit 160: Wingreens Farms Pvt. Ltd. - Key offerings
            • 12.17 Yihai International Holding Ltd
              • Exhibit 161: Yihai International Holding Ltd - Overview
              • Exhibit 162: Yihai International Holding Ltd - Product / Service
              • Exhibit 163: Yihai International Holding Ltd - Key offerings

            13 Appendix

            • 13.1 Scope of the report
              • 13.2 Inclusions and exclusions checklist
                • Exhibit 164: Inclusions checklist
                • Exhibit 165: Exclusions checklist
              • 13.3 Currency conversion rates for US$
                • Exhibit 166: Currency conversion rates for US$
              • 13.4 Research methodology
                • Exhibit 167: Research methodology
                • Exhibit 168: Validation techniques employed for market sizing
                • Exhibit 169: Information sources
              • 13.5 List of abbreviations
                • Exhibit 170: List of abbreviations

              Research Methodology

              Technavio presents a detailed picture of the market by way of study, synthesis, and summation of data from multiple sources. The analysts have presented the various facets of the market with a particular focus on identifying the key industry influencers. The data thus presented is comprehensive, reliable, and the result of extensive research, both primary and secondary.

              INFORMATION SOURCES

              Primary sources

              • Manufacturers and suppliers
              • Channel partners
              • Industry experts
              • Strategic decision makers

              Secondary sources

              • Industry journals and periodicals
              • Government data
              • Financial reports of key industry players
              • Historical data
              • Press releases

              DATA ANALYSIS

              Data Synthesis

              • Collation of data
              • Estimation of key figures
              • Analysis of derived insights

              Data Validation

              • Triangulation with data models
              • Reference against proprietary databases
              • Corroboration with industry experts

              REPORT WRITING

              Qualitative

              • Market drivers
              • Market challenges
              • Market trends
              • Five forces analysis

              Quantitative

              • Market size and forecast
              • Market segmentation
              • Geographical insights
              • Competitive landscape

              Interested in this report?

              Get your sample now to see our research methodology and insights!

              Download Now

              Frequently Asked Questions

              Dips and Spreads market growth will increase by $ 29.85 bn during 2024-2028 .

              The Dips and Spreads market is expected to grow at a CAGR of 5.82% during 2024-2028 .

              Dips and Spreads market is segmented by Distribution Channel( Offline, Online) End-user( Foodservice industry, Household)

              Andros Group, Arizona Spice Company LLC, AVT Gavia Foods Pvt. Ltd, Campbell Soup Co., Conagra Brands Inc., Cornitos, Del Monte Pacific Ltd., Dr. August Oetker KG, Euro American Brands LLC, Ferrero International S.A., Hormel Foods Corp., McCormick and Co. Inc., PepsiCo Inc., Renfro Foods, Sandridge Crafted Foods, The Hershey Co., The Kraft Heinz Co., VRB CONSUMER PRODUCTS Pvt. Ltd., Wingreens Farms Pvt. Ltd., Yihai International Holding Ltd are a few of the key vendors in the Dips and Spreads market.

              APAC will register the highest growth rate of 42% among the other regions. Therefore, the Dips and Spreads market in APAC is expected to garner significant business opportunities for the vendors during the forecast period.

              US, Canada, Australia, UK, France

              • Increasing influence of ethnic and international cuisines on dips and spreadsThe influence of ethnic and international cuisines significantly drives the global dips and spreads market is the driving factor this market.
              • shaping consumer preferences and expanding the variety of available options. As globalization continues to connect diverse cultures is the driving factor this market.
              • consumers increasingly seek authentic and exotic flavors is the driving factor this market.
              • fostering a growing demand for dips and spreads inspired by various culinary traditions. The market in focus is propelled by expanding multiculturalism and the exploration of global cuisines. Consumers are eager to experiment with flavors and ingredients from different parts of the world is the driving factor this market.
              • embracing the richness and diversity of ethnic foods. This trend has resulted in the introduction of a wide array of dips and spreads that cater to specific regional tastes is the driving factor this market.
              • including Mediterranean is the driving factor this market.
              • Middle Eastern is the driving factor this market.
              • Latin American is the driving factor this market.
              • Asian is the driving factor this market.
              • and African-inspired varieties. Ethnic dips like hummus is the driving factor this market.
              • tzatziki is the driving factor this market.
              • guacamole is the driving factor this market.
              • and salsa is the driving factor this market.
              • originating from Mediterranean is the driving factor this market.
              • Greek is the driving factor this market.
              • Mexican is the driving factor this market.
              • and Latin American cuisines is the driving factor this market.
              • respectively is the driving factor this market.
              • have gained immense popularity worldwide. Similarly is the driving factor this market.
              • international spreads is the driving factor this market.
              • such as chutneys from India is the driving factor this market.
              • harissa from North Africa is the driving factor this market.
              • or miso-based spreads from Japan is the driving factor this market.
              • have also garnered attention among consumers seeking authentic global flavors. Food manufacturers and brands are capitalizing on this trend by innovating and introducing diverse dips and spreads is the driving factor this market.
              • incorporating unique ingredients and traditional recipes. By embracing the influence of ethnic and international cuisines is the driving factor this market.
              • companies can capture the interest of consumers seeking adventurous culinary experiences is the driving factor this market.
              • contributing to the continued growth and diversification of the global dips and spreads market during the forecast period. is the driving factor this market.

              The Dips and Spreads market vendors should focus on grabbing business opportunities from the Offline segment as it accounted for the largest market share in the base year.