Direct Air Capture Market Analysis, Size, and Forecast 2025-2029: North America (US, Canada, and Mexico), Europe (Germany, UK, and France), APAC (China, Japan, and India), Middle East and Africa (Saudi Arabia, UAE, and South Africa), South America (Brazil, Argentina, and Colombia), and Rest of World (ROW)

Direct Air Capture Market Analysis, Size, and Forecast 2025-2029:
North America (US, Canada, and Mexico), Europe (Germany, UK, and France), APAC (China, Japan, and India), Middle East and Africa (Saudi Arabia, UAE, and South Africa), South America (Brazil, Argentina, and Colombia), and Rest of World (ROW)

Published: Dec 2025 286 Pages SKU: IRTNTR81139

Market Overview at a Glance

$524.32 Mn
Market Opportunity
49.7%
CAGR 2024 - 2029
49.7%
North America Growth
$32.94 Mn
Solid sorbent-based DAC segment 2023

Direct Air Capture Market Size 2025-2029

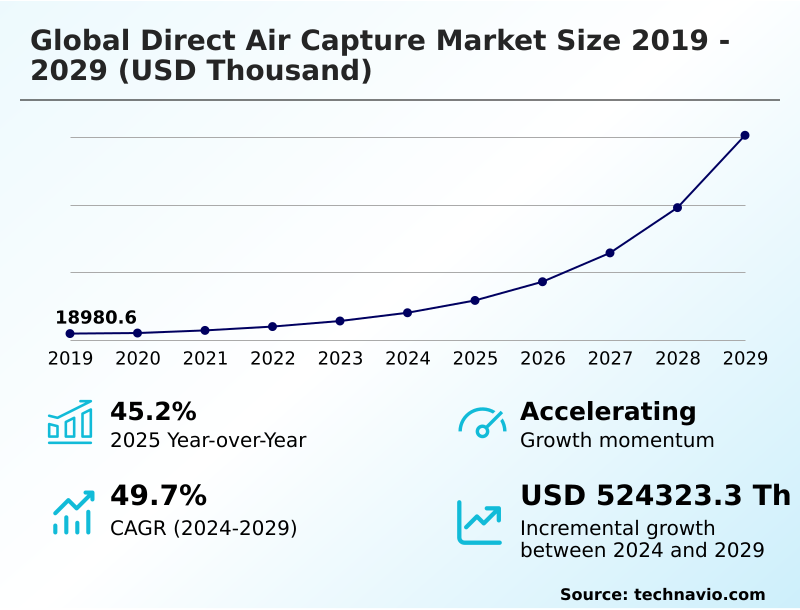
The direct air capture market size is valued to increase by USD 524.32 million, at a CAGR of 49.7% from 2024 to 2029. Increasing corporate net-zero commitments will drive the direct air capture market.

Major Market Trends & Insights

  • North America dominated the market and accounted for a 49.7% growth during the forecast period.
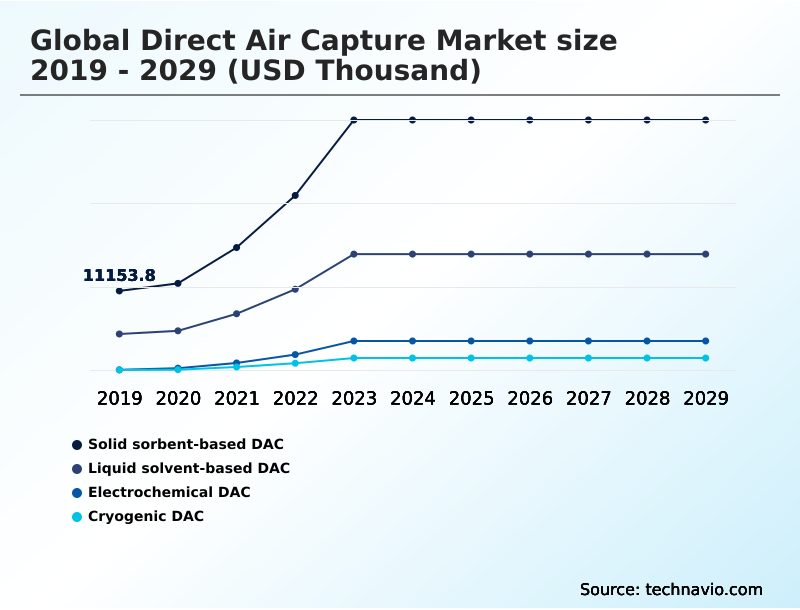
  • By Technology - Solid sorbent-based DAC segment was valued at USD 32.94 million in 2023
  • By Source - Electricity segment accounted for the largest market revenue share in 2023

Market Size & Forecast

  • Market Opportunities:
  • Market Future Opportunities: USD 524.32 million
  • CAGR from 2024 to 2029 : 49.7%

Market Summary

  • The direct air capture market is a critical component of global decarbonization strategies, focusing on technologies engineered for atmospheric carbon dioxide removal. This field is defined by several technological pathways, including solid sorbent-based dac, liquid solvent-based dac, and emerging electrochemical dac systems. Growth is fueled by increasing corporate net-zero commitments and supportive government policies providing financial incentives.
  • However, the industry contends with significant hurdles, notably the high energy consumption per ton co2 captured and the substantial capital expenditure required for deployment. A key trend involves the integration of dac facilities with renewable energy sources to ensure the carbon removal process is genuinely net-negative.
  • For instance, an industrial conglomerate might deploy modular dac systems powered by a dedicated solar farm, using the captured CO2 as a feedstock to produce carbon-neutral synthetic fuels, thereby creating a circular carbon economy and fulfilling its ESG mandates. This scenario highlights the strategic convergence of climate action and economic innovation, where carbon removal credits become a valuable asset.
  • The continuous drive for technological advancements, such as improving sorbent regeneration cycles, is essential for reducing costs and scaling this vital net-zero emissions technology.

What will be the Size of the Direct Air Capture Market during the forecast period?

Get Key Insights on Market Forecast (PDF) Request Free Sample

How is the Direct Air Capture Market Segmented?

The direct air capture industry research report provides comprehensive data (region-wise segment analysis), with forecasts and estimates in "USD thousand" for the period 2025-2029, as well as historical data from 2019-2023 for the following segments.

  • Technology
    • Solid sorbent-based DAC
    • Liquid solvent-based DAC
    • Electrochemical DAC
    • Cryogenic DAC
  • Source
    • Electricity
    • Heat
  • Application
    • Carbon capture and storage
    • Carbon capture utilization and storage
  • Geography
    • North America
      • US
      • Canada
      • Mexico
    • Europe
      • Germany
      • UK
      • France
    • APAC
      • China
      • Japan
      • India
    • Middle East and Africa
      • Saudi Arabia
      • UAE
      • South Africa
    • South America
      • Brazil
      • Argentina
      • Colombia
    • Rest of World (ROW)

By Technology Insights

The solid sorbent-based dac segment is estimated to witness significant growth during the forecast period.

The direct air capture market is segmented by technology, with solid sorbent-based DAC representing a prominent pathway. This method utilizes solid materials, such as those enabling CO2 mineralization, to adsorb carbon dioxide from ambient air.

Air is drawn through a CO2 air contactor where the sorbent binds to CO2 molecules. The sorbent is then regenerated, often through temperature swing adsorption, to release a concentrated CO2 stream for geological CO2 storage or carbon dioxide utilization.

Innovations in this segment focus on enhancing sorbent capacity and longevity to reduce operational costs, with advanced systems improving regeneration efficiency by over 15%.

This approach's modularity is a key advantage, facilitating scalable deployment for atmospheric carbon dioxide removal and the generation of carbon removal credits.

Request Free Sample

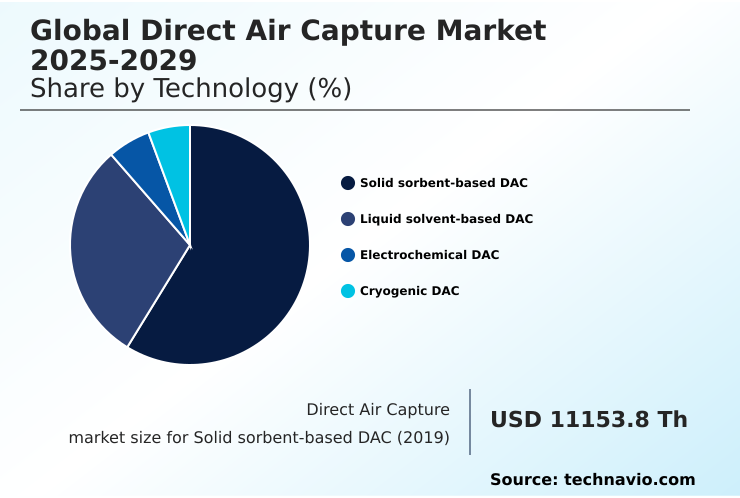
The Solid sorbent-based DAC segment was valued at USD 32.94 million in 2023 and showed a gradual increase during the forecast period.

Request Free Sample

Regional Analysis

North America is estimated to contribute 49.7% to the growth of the global market during the forecast period.Technavio’s analysts have elaborately explained the regional trends and drivers that shape the market during the forecast period.

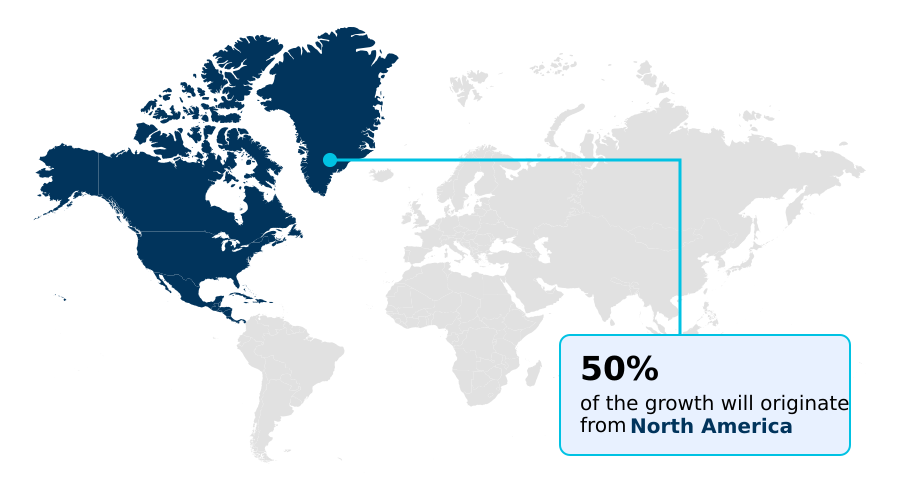
See How Direct Air Capture Market Demand is Rising in North America Request Free Sample

The geographic landscape of the direct air capture market is led by North America, which benefits from robust policy support and significant private investment.

This region is projected to exhibit an expansion rate of 50.3%, driven largely by initiatives in the United States and Canada. Europe is another key region, with an expected growth of 48.6%, focusing on renewable energy integration and industrial decarbonization.

However, the APAC region is forecast to expand at the fastest rate of 50.5%, with nations increasingly investing in net-zero emissions technology.

The development of CO2 transport infrastructure is a critical factor across all regions, enabling the connection between capture sites and locations for saline aquifer storage.

The advancement of passive direct air capture and moisture swing regeneration techniques is particularly relevant for diverse global climates, influencing regional technology adoption and decarbonization strategy.

Market Dynamics

Our researchers analyzed the data with 2024 as the base year, along with the key drivers, trends, and challenges. A holistic analysis of drivers will help companies refine their marketing strategies to gain a competitive advantage.

  • Strategic decision-making in the direct air capture market hinges on a nuanced understanding of competing technologies and their economic implications. A critical evaluation of solid sorbent vs liquid solvent dac efficiency reveals differing trade-offs in energy consumption and scalability, impacting long-term operational costs.
  • The continuous push for cost reduction in direct air capture technology is a central theme, with advancements in areas like moisture swing regeneration and amine-based sorbents for co2 capture showing promise. Integrating dac with renewable energy sources is now a baseline requirement for sustainable projects, directly influencing site selection and infrastructure planning.
  • The applications of captured co2 in industry are diversifying, moving beyond traditional uses toward high-value products like synthetic fuels and carbon-negative building materials. This shift is essential for improving the economic viability of carbon removal credits. However, significant challenges of scaling direct air capture facilities remain, particularly concerning capital investment and the development of geological storage site selection criteria.
  • The role of dac in corporate net-zero commitments is solidifying, with companies increasingly looking for durable carbon removal verification standards. Projects leveraging advanced electrochemical dac system design principles demonstrate a nearly twofold improvement in energy efficiency compared to earlier thermal systems, directly impacting operational planning and financial models.

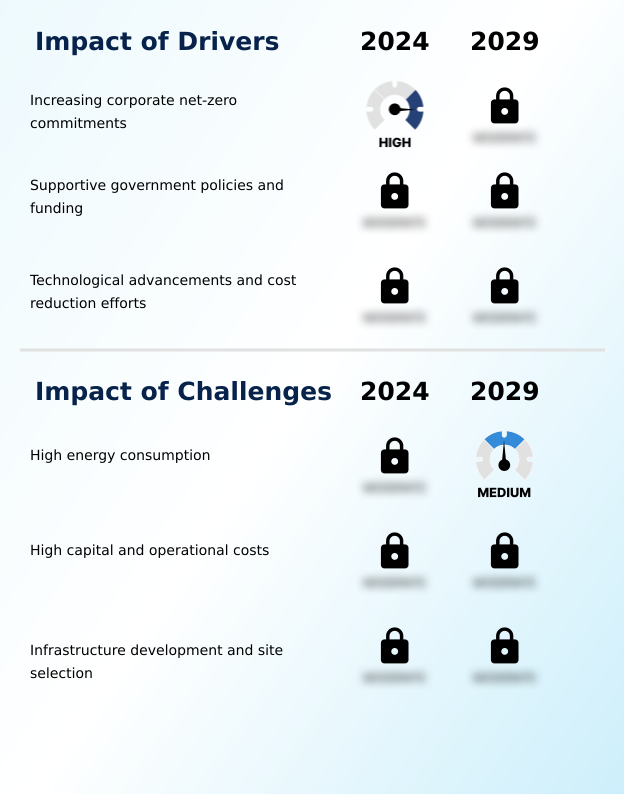
What are the key market drivers leading to the rise in the adoption of Direct Air Capture Industry?

  • The market's growth is primarily driven by the increasing number of corporate net-zero commitments, which necessitate active carbon dioxide removal solutions.

  • The primary driver propelling the direct air capture market is the global push toward climate change mitigation, underpinned by increasingly stringent corporate and national net-zero commitments. This has created strong demand for negative emission technology solutions.
  • Supportive government policies, offering substantial financial incentives, have de-risked investments and spurred a 40% year-over-year increase in private funding for new projects. Technological advancements are also crucial, with ongoing innovations in sorbent materials and process designs.
  • For example, new calcium oxide sorbent formulations have shown a 15% higher CO2 selectivity and durability, reducing operational expenditure.
  • Similarly, the development of more efficient electrochemical cells and passive direct air capture systems is lowering the high capital expenditure that has traditionally been a barrier, making the technology more accessible for widespread deployment.

What are the market trends shaping the Direct Air Capture Industry?

  • A prominent trend shaping the market is the discernible shift from pilot programs to the scaling up of commercial projects, reflecting growing confidence in the technology's viability for large-scale carbon removal.

  • A significant trend in the direct air capture market is the increasing integration of facilities with renewable energy sources to ensure climate-beneficial operations. This synergy is critical for achieving true negative emissions. For instance, projects utilizing dedicated geothermal powered DAC have demonstrated a 90% lower operational carbon footprint compared to grid-powered alternatives.
  • This move aligns with a broader decarbonization strategy and enhances the value of carbon credit procurement. Another key development is the diversification of carbon dioxide utilization pathways, with a focus on creating a circular carbon economy.
  • The use of captured CO2 in low-carbon concrete and other carbon-negative building materials is gaining traction, with some applications showing a 25% lower lifecycle emission profile. These trends are supported by advancements in technologies like membrane capture medium and cryogenic DAC, which offer different advantages in purity and scalability.

What challenges does the Direct Air Capture Industry face during its growth?

  • The industry's growth is significantly challenged by the high energy consumption inherent in direct air capture processes, impacting operational costs and scalability.

  • A primary challenge for the direct air capture market is the high energy consumption per ton CO2 captured, which inflates operational costs and complicates efforts to ensure a net-negative carbon footprint. Some systems still require over 2,000 kWh per ton, which is 30% higher than industry targets.
  • The substantial capital and operational costs (CapEx and OpEx) remain a significant hurdle, with the initial investment for a megaton-scale facility often exceeding that of comparable renewable energy projects by over 50%. Furthermore, the sorbent degradation rate necessitates periodic replacement, adding to long-term expenses.
  • Infrastructure development for CO2 transport and sequestration, including identifying suitable sites for saline aquifer storage and building pipelines, is both capital-intensive and faces regulatory and public acceptance challenges, thus constraining the pace of deployment.

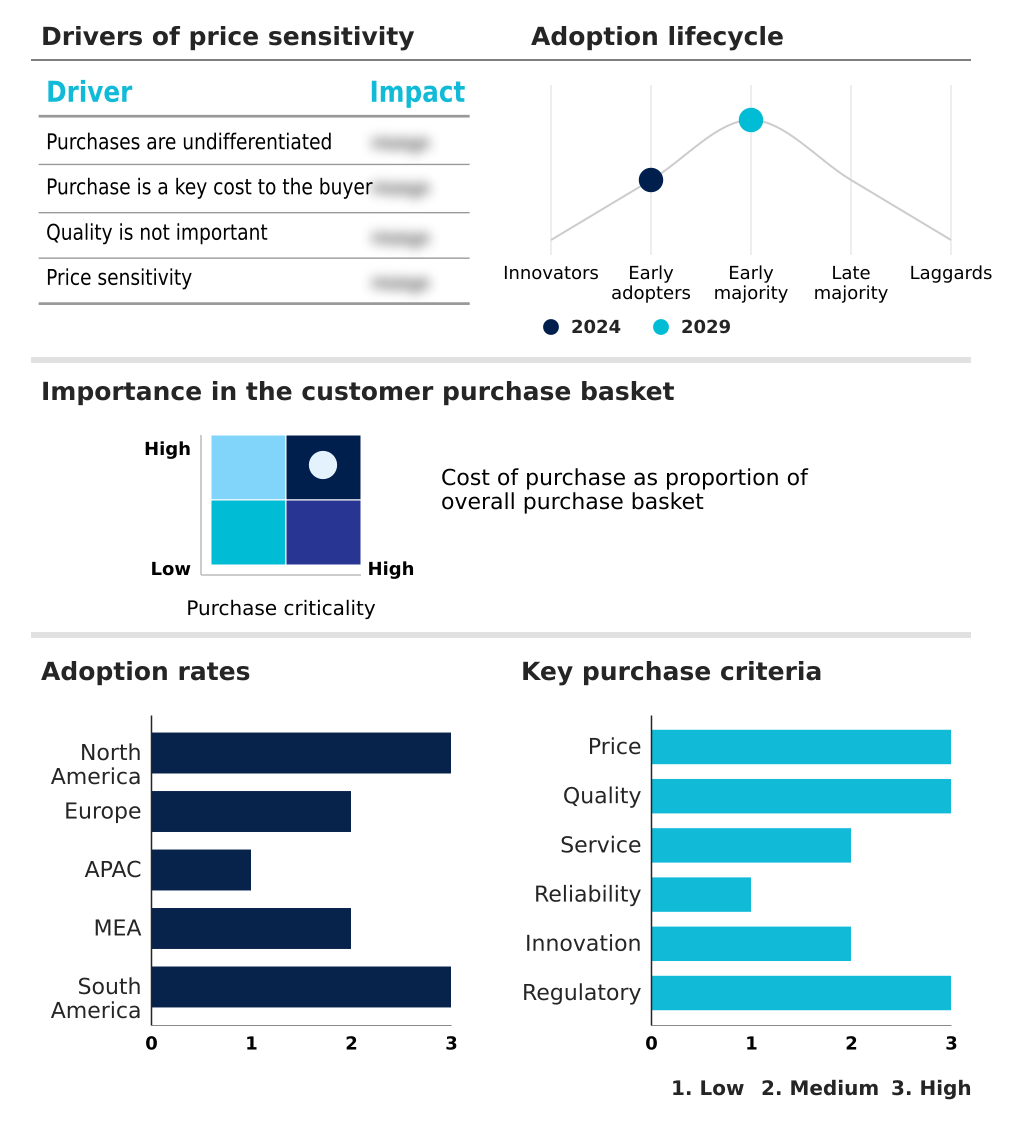
Exclusive Technavio Analysis on Customer Landscape

The direct air capture market forecasting report includes the adoption lifecycle of the market, covering from the innovator’s stage to the laggard’s stage. It focuses on adoption rates in different regions based on penetration. Furthermore, the direct air capture market report also includes key purchase criteria and drivers of price sensitivity to help companies evaluate and develop their market growth analysis strategies.

Customer Landscape of Direct Air Capture Industry

Competitive Landscape

Companies are implementing various strategies, such as strategic alliances, direct air capture market forecast, partnerships, mergers and acquisitions, geographical expansion, and product/service launches, to enhance their presence in the industry.

Aircapture - Provides containerized direct air capture units leveraging a solid capture medium with polymeric amine sorbent, regenerated through temperature and vacuum swing processes for scalable deployment.

The industry research and growth report includes detailed analyses of the competitive landscape of the market and information about key companies, including:

  • Aircapture
  • AirMyne
  • Avnos
  • Capture6
  • Carbon Collect
  • CarbonCapture Inc.
  • Carbyon
  • Climeworks
  • Deep Sky
  • Heirloom Carbon Technologies
  • Mission Zero Technologies
  • Noya
  • Octavia Carbon
  • Origen Carbon
  • Parallel Carbon
  • Phlair
  • RepAir
  • Sirona Technologies
  • Skytree
  • Soletair Power
  • Spiritus Technologies
  • Ucaneo

Qualitative and quantitative analysis of companies has been conducted to help clients understand the wider business environment as well as the strengths and weaknesses of key industry players. Data is qualitatively analyzed to categorize companies as pure play, category-focused, industry-focused, and diversified; it is quantitatively analyzed to categorize companies as dominant, leading, strong, tentative, and weak.

Recent Development and News in Direct air capture market

  • In August, 2024, 1PointFive commenced construction on its Stratos direct air capture plant in Texas, which is projected to become the world's largest DAC facility.
  • In September, 2024, Heirloom celebrated the activation of its direct air capture facility in California, which employs a novel limestone-based technology designed for enhanced energy efficiency and lower costs.
  • In March, 2025, Mission Zero Technologies entered into a partnership with a cement and concrete producer to explore the utilization of captured carbon dioxide in low-carbon concrete production.
  • In May, 2025, CarbonCapture Inc. announced a strategic agreement with clean energy provider Standard Power to explore powering its future direct air capture facilities with dedicated renewable energy.

Dive into Technavio’s robust research methodology, blending expert interviews, extensive data synthesis, and validated models for unparalleled Direct Air Capture Market insights. See full methodology.

Market Scope
Page number 286
Base year 2024
Historic period 2019-2023
Forecast period 2025-2029
Growth momentum & CAGR Accelerate at a CAGR of 49.7%
Market growth 2025-2029 USD 524323.3 thousand
Market structure Fragmented
YoY growth 2024-2025(%) 45.2%
Key countries US, Canada, Mexico, Germany, UK, France, Italy, The Netherlands, Spain, China, Japan, India, South Korea, Australia, Indonesia, Saudi Arabia, UAE, South Africa, Israel, Turkey, Brazil, Argentina and Colombia
Competitive landscape Leading Companies, Market Positioning of Companies, Competitive Strategies, and Industry Risks

Request Free Sample

Research Analyst Overview

  • The direct air capture market is advancing beyond research and development into a phase of early commercialization, defined by a push for industrial-scale deployment. Key technological pathways, including solid sorbent-based DAC, liquid solvent-based DAC, and electrochemical DAC, are being refined to improve efficiency and reduce costs.
  • The industry is focused on optimizing every stage, from the CO2 air contactor and sorbent regeneration cycle to final geological CO2 storage. The trend toward scaling up projects presents a critical boardroom decision, requiring significant capital allocation toward technologies like amine-based structured sorbents or hybrid direct air capture systems.
  • Success hinges on achieving lower energy consumption through innovations such as temperature swing adsorption and vacuum swing regeneration. As companies scale, they are securing offtake agreements for carbon removal credits, which are essential for project financing.
  • Firms adopting advanced sorbent technologies have reported up to a 20% improvement in capture rates, directly influencing their competitive positioning and ability to meet net-zero emissions technology targets through effective atmospheric carbon dioxide removal.

What are the Key Data Covered in this Direct Air Capture Market Research and Growth Report?

  • What is the expected growth of the Direct Air Capture Market between 2025 and 2029?

    • USD 524.32 million, at a CAGR of 49.7%

  • What segmentation does the market report cover?

    • The report is segmented by Technology (Solid sorbent-based DAC, Liquid solvent-based DAC, Electrochemical DAC, and Cryogenic DAC), Source (Electricity, and Heat), Application (Carbon capture and storage, and Carbon capture utilization and storage) and Geography (North America, Europe, APAC, Middle East and Africa, South America)

  • Which regions are analyzed in the report?

    • North America, Europe, APAC, Middle East and Africa and South America

  • What are the key growth drivers and market challenges?

    • Increasing corporate net-zero commitments, High energy consumption

  • Who are the major players in the Direct Air Capture Market?

    • Aircapture, AirMyne, Avnos, Capture6, Carbon Collect, CarbonCapture Inc., Carbyon, Climeworks, Deep Sky, Heirloom Carbon Technologies, Mission Zero Technologies, Noya, Octavia Carbon, Origen Carbon, Parallel Carbon, Phlair, RepAir, Sirona Technologies, Skytree, Soletair Power, Spiritus Technologies and Ucaneo

Market Research Insights

  • The direct air capture market is characterized by rapid technological evolution and shifting economic drivers. The development of a circular carbon economy is reshaping investment priorities, with a focus on creating value from captured CO2. Innovations in CO2 as a feedstock are enabling new revenue streams, while enhanced oil recovery remains a viable, albeit debated, utilization pathway.
  • Companies are achieving notable efficiency gains; for instance, advancements in sorbent materials have improved capture selectivity by up to 15%. Furthermore, process optimizations that integrate with renewable energy sources have demonstrated a potential 20% reduction in operational expenditures, bolstering project viability.
  • This progress is critical as the industry moves toward megaton-scale carbon removal, where lifecycle emissions analysis informs both technological choices and policy incentives, driving the market toward more sustainable and economically sound solutions.

We can help! Our analysts can customize this direct air capture market research report to meet your requirements.

Get in touch

1. Executive Summary

1.1 Market overview

Executive Summary - Chart on Market Overview
Executive Summary - Data Table on Market Overview
Executive Summary - Chart on Global Market Characteristics
Executive Summary - Chart on Market by Geography
Executive Summary - Chart on Market Segmentation by Technology
Executive Summary - Chart on Market Segmentation by Source
Executive Summary - Chart on Market Segmentation by Application
Executive Summary - Chart on Incremental Growth
Executive Summary - Data Table on Incremental Growth
Executive Summary - Chart on Company Market Positioning

2. Technavio Analysis

2.1 Analysis of price sensitivity, lifecycle, customer purchase basket, adoption rates, and purchase criteria

2.2 Criticality of inputs and Factors of differentiation

Chart on Overview on criticality of inputs and factors of differentiation

2.3 Factors of disruption

Chart on Overview on factors of disruption

2.4 Impact of drivers and challenges

Chart on Impact of drivers and challenges in 2024 and 2029

3. Market Landscape

3.1 Market ecosystem

Chart on Parent Market
Data Table on - Parent Market

3.2 Market characteristics

Chart on Market characteristics analysis

3.3 Value chain analysis

Chart on Value chain analysis

4. Market Sizing

4.1 Market definition

Data Table on Offerings of companies included in the market definition

4.2 Market segment analysis

Market segments

4.3 Market size 2024

4.4 Market outlook: Forecast for 2024-2029

Chart on Global - Market size and forecast 2024-2029 ($ thousand)
Data Table on Global - Market size and forecast 2024-2029 ($ thousand)
Chart on Global Market: Year-over-year growth 2024-2029 (%)
Data Table on Global Market: Year-over-year growth 2024-2029 (%)

5. Historic Market Size

5.1 Global Direct Air Capture Market 2019 - 2023

Historic Market Size - Data Table on Global Direct Air Capture Market 2019 - 2023 ($ thousand)

5.2 Technology segment analysis 2019 - 2023

Historic Market Size - Technology Segment 2019 - 2023 ($ thousand)

5.3 Source segment analysis 2019 - 2023

Historic Market Size - Source Segment 2019 - 2023 ($ thousand)

5.4 Application segment analysis 2019 - 2023

Historic Market Size - Application Segment 2019 - 2023 ($ thousand)

5.5 Geography segment analysis 2019 - 2023

Historic Market Size - Geography Segment 2019 - 2023 ($ thousand)

5.6 Country segment analysis 2019 - 2023

Historic Market Size - Country Segment 2019 - 2023 ($ thousand)

6. Qualitative Analysis

6.1 Impact of AI on global direct air capture market

7. Five Forces Analysis

7.1 Five forces summary

Five forces analysis - Comparison between 2024 and 2029

7.2 Bargaining power of buyers

Bargaining power of buyers - Impact of key factors 2024 and 2029

7.3 Bargaining power of suppliers

Bargaining power of suppliers - Impact of key factors in 2024 and 2029

7.4 Threat of new entrants

Threat of new entrants - Impact of key factors in 2024 and 2029

7.5 Threat of substitutes

Threat of substitutes - Impact of key factors in 2024 and 2029

7.6 Threat of rivalry

Threat of rivalry - Impact of key factors in 2024 and 2029

7.7 Market condition

Chart on Market condition - Five forces 2024 and 2029

8. Market Segmentation by Technology

8.1 Market segments

Chart on Technology - Market share 2024-2029 (%)
Data Table on Technology - Market share 2024-2029 (%)

8.2 Comparison by Technology

Chart on Comparison by Technology
Data Table on Comparison by Technology

8.3 Solid sorbent-based DAC - Market size and forecast 2024-2029

Chart on Solid sorbent-based DAC - Market size and forecast 2024-2029 ($ thousand)
Data Table on Solid sorbent-based DAC - Market size and forecast 2024-2029 ($ thousand)
Chart on Solid sorbent-based DAC - Year-over-year growth 2024-2029 (%)
Data Table on Solid sorbent-based DAC - Year-over-year growth 2024-2029 (%)

8.4 Liquid solvent-based DAC - Market size and forecast 2024-2029

Chart on Liquid solvent-based DAC - Market size and forecast 2024-2029 ($ thousand)
Data Table on Liquid solvent-based DAC - Market size and forecast 2024-2029 ($ thousand)
Chart on Liquid solvent-based DAC - Year-over-year growth 2024-2029 (%)
Data Table on Liquid solvent-based DAC - Year-over-year growth 2024-2029 (%)

8.5 Electrochemical DAC - Market size and forecast 2024-2029

Chart on Electrochemical DAC - Market size and forecast 2024-2029 ($ thousand)
Data Table on Electrochemical DAC - Market size and forecast 2024-2029 ($ thousand)
Chart on Electrochemical DAC - Year-over-year growth 2024-2029 (%)
Data Table on Electrochemical DAC - Year-over-year growth 2024-2029 (%)

8.6 Cryogenic DAC - Market size and forecast 2024-2029

Chart on Cryogenic DAC - Market size and forecast 2024-2029 ($ thousand)
Data Table on Cryogenic DAC - Market size and forecast 2024-2029 ($ thousand)
Chart on Cryogenic DAC - Year-over-year growth 2024-2029 (%)
Data Table on Cryogenic DAC - Year-over-year growth 2024-2029 (%)

8.7 Market opportunity by Technology

Market opportunity by Technology ($ thousand)
Data Table on Market opportunity by Technology ($ thousand)

9. Market Segmentation by Source

9.1 Market segments

Chart on Source - Market share 2024-2029 (%)
Data Table on Source - Market share 2024-2029 (%)

9.2 Comparison by Source

Chart on Comparison by Source
Data Table on Comparison by Source

9.3 Electricity - Market size and forecast 2024-2029

Chart on Electricity - Market size and forecast 2024-2029 ($ thousand)
Data Table on Electricity - Market size and forecast 2024-2029 ($ thousand)
Chart on Electricity - Year-over-year growth 2024-2029 (%)
Data Table on Electricity - Year-over-year growth 2024-2029 (%)

9.4 Heat - Market size and forecast 2024-2029

Chart on Heat - Market size and forecast 2024-2029 ($ thousand)
Data Table on Heat - Market size and forecast 2024-2029 ($ thousand)
Chart on Heat - Year-over-year growth 2024-2029 (%)
Data Table on Heat - Year-over-year growth 2024-2029 (%)

9.5 Market opportunity by Source

Market opportunity by Source ($ thousand)
Data Table on Market opportunity by Source ($ thousand)

10. Market Segmentation by Application

10.1 Market segments

Chart on Application - Market share 2024-2029 (%)
Data Table on Application - Market share 2024-2029 (%)

10.2 Comparison by Application

Chart on Comparison by Application
Data Table on Comparison by Application

10.3 Carbon capture and storage - Market size and forecast 2024-2029

Chart on Carbon capture and storage - Market size and forecast 2024-2029 ($ thousand)
Data Table on Carbon capture and storage - Market size and forecast 2024-2029 ($ thousand)
Chart on Carbon capture and storage - Year-over-year growth 2024-2029 (%)
Data Table on Carbon capture and storage - Year-over-year growth 2024-2029 (%)

10.4 Carbon capture utilization and storage - Market size and forecast 2024-2029

Chart on Carbon capture utilization and storage - Market size and forecast 2024-2029 ($ thousand)
Data Table on Carbon capture utilization and storage - Market size and forecast 2024-2029 ($ thousand)
Chart on Carbon capture utilization and storage - Year-over-year growth 2024-2029 (%)
Data Table on Carbon capture utilization and storage - Year-over-year growth 2024-2029 (%)

10.5 Market opportunity by Application

Market opportunity by Application ($ thousand)
Data Table on Market opportunity by Application ($ thousand)

11. Customer Landscape

11.1 Customer landscape overview

Analysis of price sensitivity, lifecycle, customer purchase basket, adoption rates, and purchase criteria

12. Geographic Landscape

12.1 Geographic segmentation

Chart on Market share by geography 2024-2029 (%)
Data Table on Market share by geography 2024-2029 (%)

12.2 Geographic comparison

Chart on Geographic comparison
Data Table on Geographic comparison

12.3 North America - Market size and forecast 2024-2029

Chart on North America - Market size and forecast 2024-2029 ($ thousand)
Data Table on North America - Market size and forecast 2024-2029 ($ thousand)
Chart on North America - Year-over-year growth 2024-2029 (%)
Data Table on North America - Year-over-year growth 2024-2029 (%)
Chart on Regional Comparison - North America
Data Table on Regional Comparison - North America

12.3.1 US - Market size and forecast 2024-2029

Chart on US - Market size and forecast 2024-2029 ($ thousand)
Data Table on US - Market size and forecast 2024-2029 ($ thousand)
Chart on US - Year-over-year growth 2024-2029 (%)
Data Table on US - Year-over-year growth 2024-2029 (%)

12.3.2 Canada - Market size and forecast 2024-2029

Chart on Canada - Market size and forecast 2024-2029 ($ thousand)
Data Table on Canada - Market size and forecast 2024-2029 ($ thousand)
Chart on Canada - Year-over-year growth 2024-2029 (%)
Data Table on Canada - Year-over-year growth 2024-2029 (%)

12.3.3 Mexico - Market size and forecast 2024-2029

Chart on Mexico - Market size and forecast 2024-2029 ($ thousand)
Data Table on Mexico - Market size and forecast 2024-2029 ($ thousand)
Chart on Mexico - Year-over-year growth 2024-2029 (%)
Data Table on Mexico - Year-over-year growth 2024-2029 (%)

12.4 Europe - Market size and forecast 2024-2029

Chart on Europe - Market size and forecast 2024-2029 ($ thousand)
Data Table on Europe - Market size and forecast 2024-2029 ($ thousand)
Chart on Europe - Year-over-year growth 2024-2029 (%)
Data Table on Europe - Year-over-year growth 2024-2029 (%)
Chart on Regional Comparison - Europe
Data Table on Regional Comparison - Europe

12.4.1 Germany - Market size and forecast 2024-2029

Chart on Germany - Market size and forecast 2024-2029 ($ thousand)
Data Table on Germany - Market size and forecast 2024-2029 ($ thousand)
Chart on Germany - Year-over-year growth 2024-2029 (%)
Data Table on Germany - Year-over-year growth 2024-2029 (%)

12.4.2 UK - Market size and forecast 2024-2029

Chart on UK - Market size and forecast 2024-2029 ($ thousand)
Data Table on UK - Market size and forecast 2024-2029 ($ thousand)
Chart on UK - Year-over-year growth 2024-2029 (%)
Data Table on UK - Year-over-year growth 2024-2029 (%)

12.4.3 France - Market size and forecast 2024-2029

Chart on France - Market size and forecast 2024-2029 ($ thousand)
Data Table on France - Market size and forecast 2024-2029 ($ thousand)
Chart on France - Year-over-year growth 2024-2029 (%)
Data Table on France - Year-over-year growth 2024-2029 (%)

12.4.4 Italy - Market size and forecast 2024-2029

Chart on Italy - Market size and forecast 2024-2029 ($ thousand)
Data Table on Italy - Market size and forecast 2024-2029 ($ thousand)
Chart on Italy - Year-over-year growth 2024-2029 (%)
Data Table on Italy - Year-over-year growth 2024-2029 (%)

12.4.5 The Netherlands - Market size and forecast 2024-2029

Chart on The Netherlands - Market size and forecast 2024-2029 ($ thousand)
Data Table on The Netherlands - Market size and forecast 2024-2029 ($ thousand)
Chart on The Netherlands - Year-over-year growth 2024-2029 (%)
Data Table on The Netherlands - Year-over-year growth 2024-2029 (%)

12.4.6 Spain - Market size and forecast 2024-2029

Chart on Spain - Market size and forecast 2024-2029 ($ thousand)
Data Table on Spain - Market size and forecast 2024-2029 ($ thousand)
Chart on Spain - Year-over-year growth 2024-2029 (%)
Data Table on Spain - Year-over-year growth 2024-2029 (%)

12.5 APAC - Market size and forecast 2024-2029

Chart on APAC - Market size and forecast 2024-2029 ($ thousand)
Data Table on APAC - Market size and forecast 2024-2029 ($ thousand)
Chart on APAC - Year-over-year growth 2024-2029 (%)
Data Table on APAC - Year-over-year growth 2024-2029 (%)
Chart on Regional Comparison - APAC
Data Table on Regional Comparison - APAC

12.5.1 China - Market size and forecast 2024-2029

Chart on China - Market size and forecast 2024-2029 ($ thousand)
Data Table on China - Market size and forecast 2024-2029 ($ thousand)
Chart on China - Year-over-year growth 2024-2029 (%)
Data Table on China - Year-over-year growth 2024-2029 (%)

12.5.2 Japan - Market size and forecast 2024-2029

Chart on Japan - Market size and forecast 2024-2029 ($ thousand)
Data Table on Japan - Market size and forecast 2024-2029 ($ thousand)
Chart on Japan - Year-over-year growth 2024-2029 (%)
Data Table on Japan - Year-over-year growth 2024-2029 (%)

12.5.3 India - Market size and forecast 2024-2029

Chart on India - Market size and forecast 2024-2029 ($ thousand)
Data Table on India - Market size and forecast 2024-2029 ($ thousand)
Chart on India - Year-over-year growth 2024-2029 (%)
Data Table on India - Year-over-year growth 2024-2029 (%)

12.5.4 South Korea - Market size and forecast 2024-2029

Chart on South Korea - Market size and forecast 2024-2029 ($ thousand)
Data Table on South Korea - Market size and forecast 2024-2029 ($ thousand)
Chart on South Korea - Year-over-year growth 2024-2029 (%)
Data Table on South Korea - Year-over-year growth 2024-2029 (%)

12.5.5 Australia - Market size and forecast 2024-2029

Chart on Australia - Market size and forecast 2024-2029 ($ thousand)
Data Table on Australia - Market size and forecast 2024-2029 ($ thousand)
Chart on Australia - Year-over-year growth 2024-2029 (%)
Data Table on Australia - Year-over-year growth 2024-2029 (%)

12.5.6 Indonesia - Market size and forecast 2024-2029

Chart on Indonesia - Market size and forecast 2024-2029 ($ thousand)
Data Table on Indonesia - Market size and forecast 2024-2029 ($ thousand)
Chart on Indonesia - Year-over-year growth 2024-2029 (%)
Data Table on Indonesia - Year-over-year growth 2024-2029 (%)

12.6 Middle East and Africa - Market size and forecast 2024-2029

Chart on Middle East and Africa - Market size and forecast 2024-2029 ($ thousand)
Data Table on Middle East and Africa - Market size and forecast 2024-2029 ($ thousand)
Chart on Middle East and Africa - Year-over-year growth 2024-2029 (%)
Data Table on Middle East and Africa - Year-over-year growth 2024-2029 (%)
Chart on Regional Comparison - Middle East and Africa
Data Table on Regional Comparison - Middle East and Africa

12.6.1 Saudi Arabia - Market size and forecast 2024-2029

Chart on Saudi Arabia - Market size and forecast 2024-2029 ($ thousand)
Data Table on Saudi Arabia - Market size and forecast 2024-2029 ($ thousand)
Chart on Saudi Arabia - Year-over-year growth 2024-2029 (%)
Data Table on Saudi Arabia - Year-over-year growth 2024-2029 (%)

12.6.2 UAE - Market size and forecast 2024-2029

Chart on UAE - Market size and forecast 2024-2029 ($ thousand)
Data Table on UAE - Market size and forecast 2024-2029 ($ thousand)
Chart on UAE - Year-over-year growth 2024-2029 (%)
Data Table on UAE - Year-over-year growth 2024-2029 (%)

12.6.3 South Africa - Market size and forecast 2024-2029

Chart on South Africa - Market size and forecast 2024-2029 ($ thousand)
Data Table on South Africa - Market size and forecast 2024-2029 ($ thousand)
Chart on South Africa - Year-over-year growth 2024-2029 (%)
Data Table on South Africa - Year-over-year growth 2024-2029 (%)

12.6.4 Israel - Market size and forecast 2024-2029

Chart on Israel - Market size and forecast 2024-2029 ($ thousand)
Data Table on Israel - Market size and forecast 2024-2029 ($ thousand)
Chart on Israel - Year-over-year growth 2024-2029 (%)
Data Table on Israel - Year-over-year growth 2024-2029 (%)

12.6.5 Turkey - Market size and forecast 2024-2029

Chart on Turkey - Market size and forecast 2024-2029 ($ thousand)
Data Table on Turkey - Market size and forecast 2024-2029 ($ thousand)
Chart on Turkey - Year-over-year growth 2024-2029 (%)
Data Table on Turkey - Year-over-year growth 2024-2029 (%)

12.7 South America - Market size and forecast 2024-2029

Chart on South America - Market size and forecast 2024-2029 ($ thousand)
Data Table on South America - Market size and forecast 2024-2029 ($ thousand)
Chart on South America - Year-over-year growth 2024-2029 (%)
Data Table on South America - Year-over-year growth 2024-2029 (%)
Chart on Regional Comparison - South America
Data Table on Regional Comparison - South America

12.7.1 Brazil - Market size and forecast 2024-2029

Chart on Brazil - Market size and forecast 2024-2029 ($ thousand)
Data Table on Brazil - Market size and forecast 2024-2029 ($ thousand)
Chart on Brazil - Year-over-year growth 2024-2029 (%)
Data Table on Brazil - Year-over-year growth 2024-2029 (%)

12.7.2 Argentina - Market size and forecast 2024-2029

Chart on Argentina - Market size and forecast 2024-2029 ($ thousand)
Data Table on Argentina - Market size and forecast 2024-2029 ($ thousand)
Chart on Argentina - Year-over-year growth 2024-2029 (%)
Data Table on Argentina - Year-over-year growth 2024-2029 (%)

12.7.3 Colombia - Market size and forecast 2024-2029

Chart on Colombia - Market size and forecast 2024-2029 ($ thousand)
Data Table on Colombia - Market size and forecast 2024-2029 ($ thousand)
Chart on Colombia - Year-over-year growth 2024-2029 (%)
Data Table on Colombia - Year-over-year growth 2024-2029 (%)

12.8 Market opportunity by geography

Market opportunity by geography ($ thousand)
Data Tables on Market opportunity by geography ($ thousand)

13. Drivers, Challenges, and Opportunity

13.1 Market drivers

Increasing corporate net-zero commitments
Supportive government policies and funding
Technological advancements and cost reduction efforts

13.2 Market challenges

High energy consumption
High capital and operational costs
Infrastructure development and site selection

13.3 Impact of drivers and challenges

Impact of drivers and challenges in 2024 and 2029

13.4 Market opportunities

Scaling up of commercial projects
Integration with renewable energy sources
Diversification of CO2 utilization pathways

14. Competitive Landscape

14.1 Overview

14.2

Overview on criticality of inputs and factors of differentiation

14.3 Landscape disruption

Overview on factors of disruption

14.4 Industry risks

Impact of key risks on business

15. Competitive Analysis

15.1 Companies profiled

Companies covered

15.2 Company ranking index

15.3 Market positioning of companies

Matrix on companies position and classification

15.4 Aircapture

Aircapture - Overview
Aircapture - Product / Service
Aircapture - Key offerings
SWOT

15.5 Avnos

Avnos - Overview
Avnos - Product / Service
Avnos - Key offerings
SWOT

15.6 Capture6

Capture6 - Overview
Capture6 - Product / Service
Capture6 - Key offerings
SWOT

15.7 CarbonCapture Inc.

CarbonCapture Inc. - Overview
CarbonCapture Inc. - Product / Service
CarbonCapture Inc. - Key offerings
SWOT

15.8 Carbyon

Carbyon - Overview
Carbyon - Product / Service
Carbyon - Key offerings
SWOT

15.9 Climeworks

Climeworks - Overview
Climeworks - Product / Service
Climeworks - Key offerings
SWOT

15.10 Deep Sky

Deep Sky - Overview
Deep Sky - Product / Service
Deep Sky - Key offerings
SWOT

15.11 Heirloom Carbon Technologies

Heirloom Carbon Technologies - Overview
Heirloom Carbon Technologies - Product / Service
Heirloom Carbon Technologies - Key offerings
SWOT

15.12 Mission Zero Technologies

Mission Zero Technologies - Overview
Mission Zero Technologies - Product / Service
Mission Zero Technologies - Key offerings
SWOT

15.13 Noya

Noya - Overview
Noya - Product / Service
Noya - Key offerings
SWOT

15.14 Octavia Carbon

Octavia Carbon - Overview
Octavia Carbon - Product / Service
Octavia Carbon - Key offerings
SWOT

15.15 Origen Carbon

Origen Carbon - Overview
Origen Carbon - Product / Service
Origen Carbon - Key offerings
SWOT

15.16 Skytree

Skytree - Overview
Skytree - Product / Service
Skytree - Key offerings
SWOT

15.17 Spiritus Technologies

Spiritus Technologies - Overview
Spiritus Technologies - Product / Service
Spiritus Technologies - Key offerings
SWOT

15.18 Ucaneo

Ucaneo - Overview
Ucaneo - Product / Service
Ucaneo - Key offerings
SWOT

16. Appendix

16.1 Scope of the report

Market definition
Objectives
Notes and caveats

16.2 Inclusions and exclusions checklist

Inclusions checklist
Exclusions checklist

16.3 Currency conversion rates for US$

16.4 Research methodology

16.5 Data procurement

Information sources

16.6 Data validation

16.7 Validation techniques employed for market sizing

16.8 Data synthesis

16.9 360 degree market analysis

16.10 List of abbreviations

Research Methodology

Technavio presents a detailed picture of the market by way of study, synthesis, and summation of data from multiple sources. The analysts have presented the various facets of the market with a particular focus on identifying the key industry influencers. The data thus presented is comprehensive, reliable, and the result of extensive research, both primary and secondary.

INFORMATION SOURCES

Primary sources

  • Manufacturers and suppliers
  • Channel partners
  • Industry experts
  • Strategic decision makers

Secondary sources

  • Industry journals and periodicals
  • Government data
  • Financial reports of key industry players
  • Historical data
  • Press releases

DATA ANALYSIS

Data Synthesis

  • Collation of data
  • Estimation of key figures
  • Analysis of derived insights

Data Validation

  • Triangulation with data models
  • Reference against proprietary databases
  • Corroboration with industry experts

REPORT WRITING

Qualitative

  • Market drivers
  • Market challenges
  • Market trends
  • Five forces analysis

Quantitative

  • Market size and forecast
  • Market segmentation
  • Geographical insights
  • Competitive landscape

Interested in this report?

Get your sample now to see our research methodology and insights!

Download Now

Frequently Asked Questions

Direct Air Capture market growth will increase by USD 524323.3 thousand thousand during 2025-2029 .

The Direct Air Capture market is expected to grow at a CAGR of 49.7% during 2025-2029 .

Direct Air Capture market is segmented by Technology (Solid sorbent-based DAC, Liquid solvent-based DAC, Electrochemical DAC, Cryogenic DAC) Source (Electricity, Heat) Application (Carbon capture and storage, Carbon capture utilization and storage)

Aircapture, AirMyne, Avnos, Capture6, Carbon Collect, CarbonCapture Inc., Carbyon, Climeworks, Deep Sky, Heirloom Carbon Technologies, Mission Zero Technologies, Noya, Octavia Carbon, Origen Carbon, Parallel Carbon, Phlair, RepAir, Sirona Technologies, Skytree, Soletair Power, Spiritus Technologies, Ucaneo are a few of the key vendors in the Direct Air Capture market.

North America will register the highest growth rate of 49.7% among the other regions. Therefore, the Direct Air Capture market in North America is expected to garner significant business opportunities for the vendors during the forecast period.

US, Canada, Mexico, Germany, UK, France, Italy, The Netherlands, Spain, China, Japan, India, South Korea, Australia, Indonesia, Saudi Arabia, UAE, South Africa, Israel, Turkey, Brazil, Argentina, Colombia

  • Increasing corporate net-zero commitments is the driving factor this market.

The Direct Air Capture market vendors should focus on grabbing business opportunities from the Technology segment as it accounted for the largest market share in the base year.