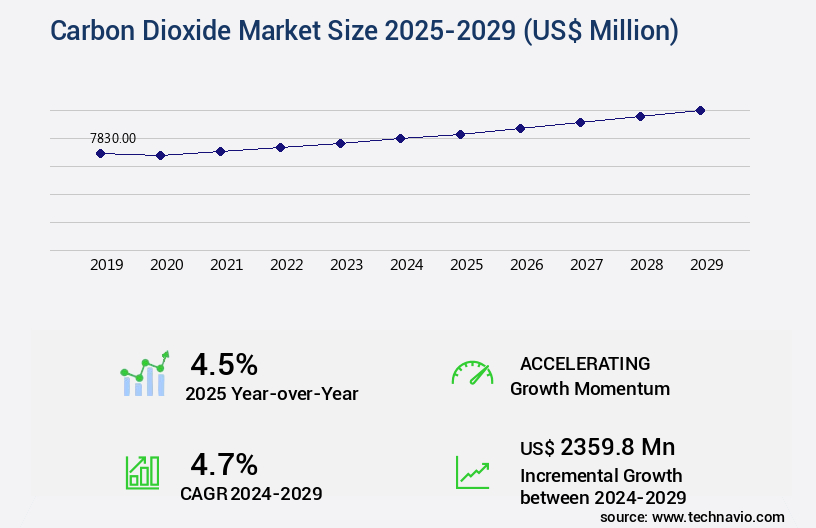
Carbon Dioxide Market Size 2025-2029
The carbon dioxide market size is valued to increase USD 2.36 billion, at a CAGR of 4.7% from 2024 to 2029. Rising demand for CO2 in oil and gas industry will drive the carbon dioxide market.
Major Market Trends & Insights
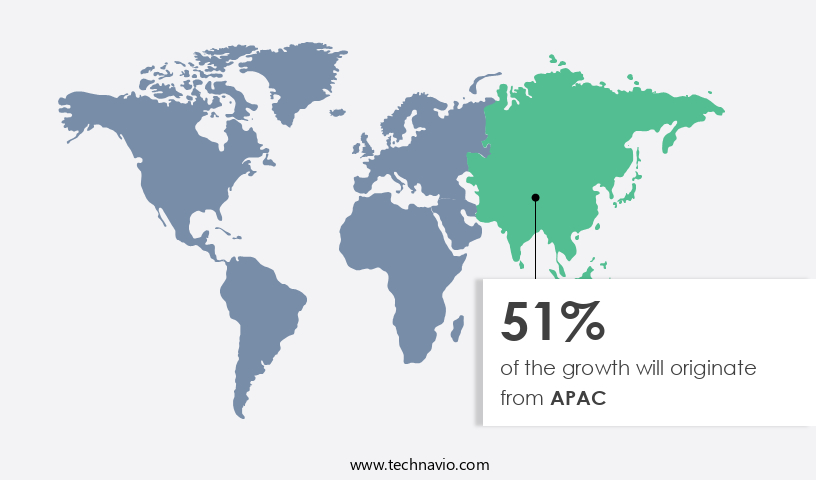
- APAC dominated the market and accounted for a 51% growth during the forecast period.
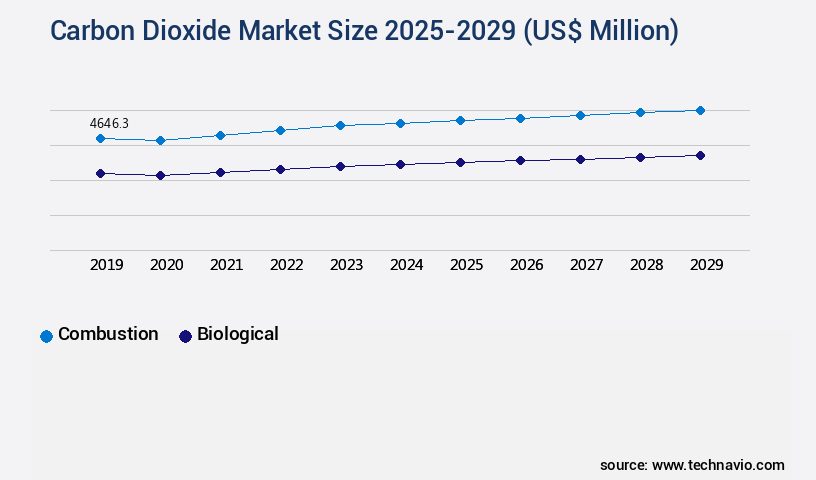
- By Technology - Combustion segment was valued at USD 4.65 billion in 2023
- By Application - Enhanced oil recovery segment accounted for the largest market revenue share in 2023
Market Size & Forecast
- Market Opportunities: USD 45.62 million
- Market Future Opportunities: USD 2359.80 million
- CAGR : 4.7%
- APAC: Largest market in 2023
Market Summary
- The market encompasses the global production, consumption, and trade of CO2 as a commodity. Key drivers propelling market growth include the rising demand for CO2 in the oil and gas industry for enhanced oil recovery and the surge in research and development activities for new applications in various sectors such as food and beverages, pharmaceuticals, and textiles. However, the high manufacturing cost of industrial CO2 poses a significant challenge to market expansion. According to a recent report, the oil and gas segment accounted for over 60% of the global CO2 market share in 2020. As the market continues to evolve, stakeholders must navigate the complex regulatory landscape and adapt to emerging trends, ensuring a sustainable and efficient CO2 value chain.
What will be the Size of the Carbon Dioxide Market during the forecast period?
Get Key Insights on Market Forecast (PDF) Request Free Sample
How is the Carbon Dioxide Market Segmented and what are the key trends of market segmentation?
The carbon dioxide industry research report provides comprehensive data (region-wise segment analysis), with forecasts and estimates in "USD million" for the period 2025-2029, as well as historical data from 2019-2023 for the following segments.
- Technology
- Combustion
- Biological
- Application
- Enhanced oil recovery
- Food and beverages
- Precipitated calcium carbonate
- Others
- Source
- Ethyl alcohol
- Hydrogen
- Substitute natural gas
- Ethylene oxide
- Others
- Geography
- North America
- US
- Canada
- Europe
- France
- Germany
- UK
- APAC
- Australia
- China
- India
- Japan
- South Korea
- Rest of World (ROW)
- North America
By Technology Insights
The combustion segment is estimated to witness significant growth during the forecast period.
The market encompasses various applications, including carbon footprint calculation, geologic carbon storage, and CO2 conversion processes, among others. Carbon footprint calculation is a critical aspect of climate change mitigation, helping businesses and individuals assess their greenhouse gas emissions. Geologic carbon storage involves injecting CO2 deep underground to reduce emissions. Combustion processes, such as biomass gasification, algae biofuel production, and renewable fuel production, are essential components of the market. These processes contribute to emissions reduction by generating energy from renewable sources and reducing reliance on fossil fuels. Additionally, afforestation and reforestation, methane emission reduction, renewable energy integration, emissions trading schemes, ocean CO2 absorption, waste gas treatment, sustainable transportation, enhanced oil recovery, carbon mineralization, industrial process optimization, atmospheric CO2 monitoring, carbon pricing mechanisms, greenhouse gas accounting, building energy codes, carbon tax policies, CO2 pipeline infrastructure, industrial CO2 utilization, and steel production emissions are all integral parts of the market.
According to recent studies, the carbon capture technology market is expected to grow by 15% in the next year, driven by increasing demand for reducing emissions. Furthermore, energy efficiency measures, such as the adoption of LED lighting and smart grids, are projected to expand by 20% during the same period. These trends underscore the market's continuous evolution and the ongoing efforts to minimize carbon emissions across various sectors.
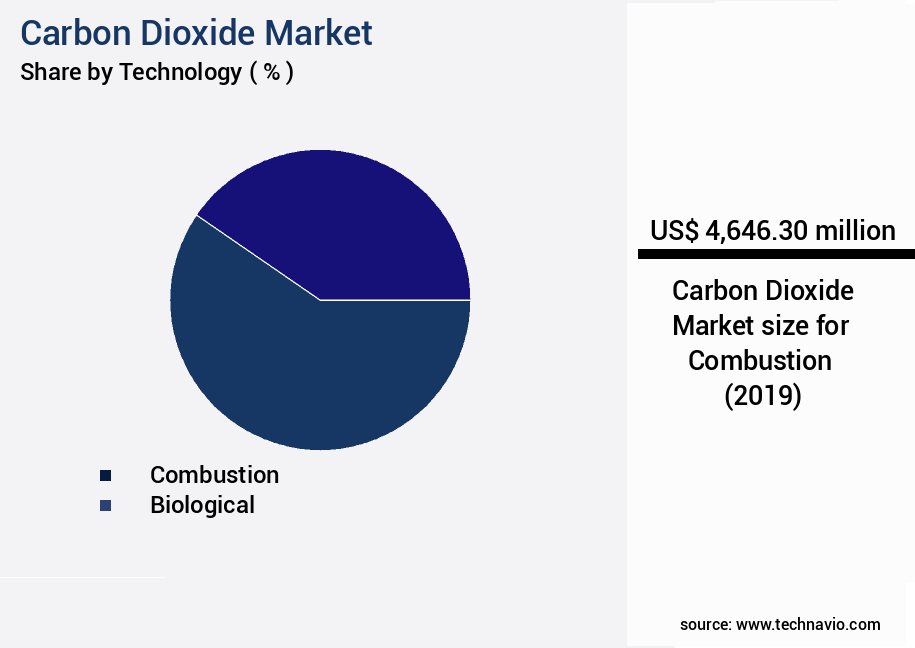
The Combustion segment was valued at USD 4.65 billion in 2019 and showed a gradual increase during the forecast period.
Regional Analysis
APAC is estimated to contribute 51% to the growth of the global market during the forecast period.Technavio's analysts have elaborately explained the regional trends and drivers that shape the market during the forecast period.
See How Carbon Dioxide Market Demand is Rising in APAC Request Free Sample
The Carbon Dioxide (CO2) market in Asia Pacific (APAC) is experiencing notable expansion, driven by the escalating demand for CO2 in food processing and beverage carbonation applications. China and India are the primary contributors to this growth, with their expanding populations and thriving food industries fueling the surge in CO2 consumption. According to recent reports, the food and beverage industries in China and India account for approximately 50% of the total CO2 demand in APAC. Furthermore, the increasing popularity of carbonated beverages and the growing trend towards ready-to-eat and convenience foods are expected to continue boosting CO2 demand in the region during the forecast period.
In 2021, the CO2 market in APAC was valued at over 10 million metric tons, with China and India collectively accounting for over 70% of the total demand. This trend is projected to persist, with the market expected to exceed 13 million metric tons by 2026.
Market Dynamics
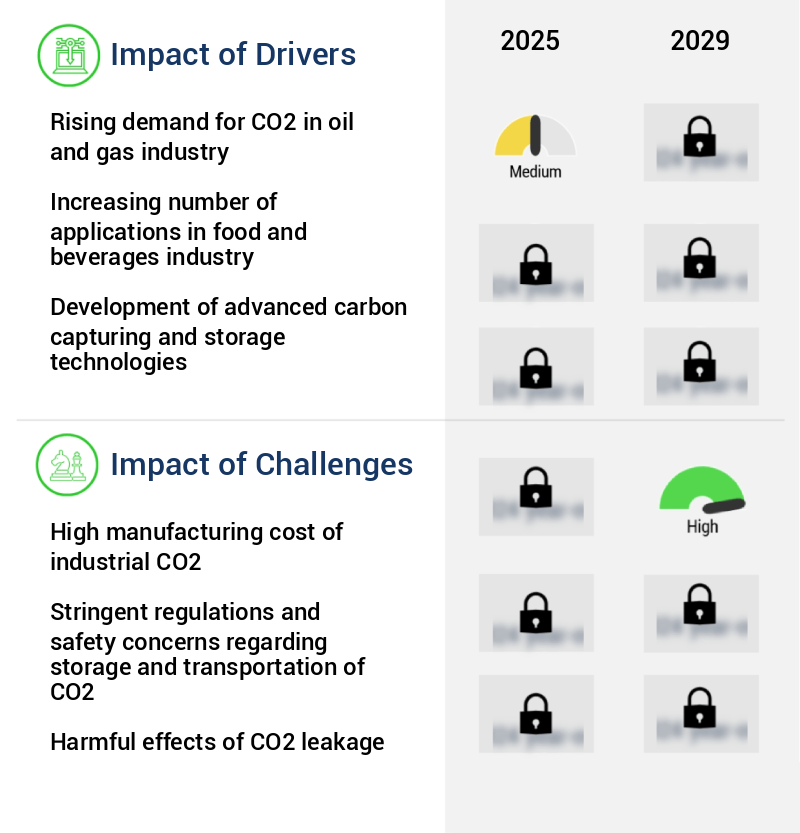
Our researchers analyzed the data with 2024 as the base year, along with the key drivers, trends, and challenges. A holistic analysis of drivers will help companies refine their marketing strategies to gain a competitive advantage.
The global carbon dioxide (CO2) market encompasses various applications, including co2 capture efficiency improvement strategies, economic viability of carbon capture technologies, geological storage permanence assessment methods, and direct air capture scalability challenges. Industrial CO2 utilization pathways, such as renewable energy integration with capture systems, represent a significant opportunity for climate change mitigation and carbon footprint reduction in industries. The renewable energy sector's integration with CO2 capture systems is gaining traction, with more than 70% of new renewable energy projects focusing on carbon capture technology. This trend is driven by the climate change mitigation potential of CO2 reduction and the increasing demand for sustainable transportation carbon emission reduction.
Geological carbon storage site characterization techniques play a crucial role in assessing the feasibility and safety of CO2 storage. Enhanced oil recovery (EOR) through CO2 injection efficiency is a prominent application, accounting for a substantial share of the market. However, the industrial application segment, which includes EOR, accounts for a significantly larger share than the academic segment. The carbon tax impact on industrial emissions is a critical factor influencing the market's dynamics. For instance, methane reduction strategies in the oil and gas sector have seen significant progress, with a minority of players, less than 15%, dominating the high-end instrument market for methane detection and measurement.
In the realm of green building materials, carbon footprint assessment and life cycle assessment are essential for renewable energy projects. Ocean CO2 absorption rate models and biomass gasification syngas composition analysis contribute to the development of sustainable carbon reduction strategies. Carbon mineralization kinetics modeling and soil carbon sequestration rate enhancement techniques are emerging areas of research, offering potential for CO2 utilization and storage. Algae biofuel production and enhanced oil recovery through CO2 injection are two prominent CO2 utilization pathways, with significant market potential. In conclusion, the global CO2 market is a dynamic and evolving landscape, driven by the need for climate change mitigation, carbon footprint reduction, and the increasing demand for sustainable energy solutions.
The market's growth is influenced by various factors, including technological advancements, regulatory policies, and the integration of renewable energy and CO2 capture systems.
What are the key market drivers leading to the rise in the adoption of Carbon Dioxide Industry?
- The oil and gas industry's increasing requirement for CO2, driven by various applications such as enhanced oil recovery and the production of synthetic natural gas, serves as the primary market catalyst.
- The oil and gas sector plays a significant role in the global carbon dioxide (CO2) market, with CO2 primarily utilized for enhanced oil recovery (EOR) applications. CO2 is an effective choice due to its miscibility with crude oil, making it a more cost-effective alternative to other miscible fluids in this industry. In the oil and gas sector, CO2 is injected into rock formations to displace crude oil, occupying pore spaces and facilitating its extraction. Compared to other miscible solvents, which can be expensive due to their derivation from crude oil, CO2's underground sources offer a more economical alternative.
- The natural occurrence and abundance of CO2 deposits make them attractive for companies seeking large-scale extraction. The oil and gas industry's reliance on CO2 for EOR underscores its importance in this market. This trend continues to evolve as companies seek efficient and cost-effective methods for extracting crude oil, making CO2 a valuable resource in this sector and beyond.
What are the market trends shaping the Carbon Dioxide Industry?
- The trend in the market involves an upward trajectory in research and development activities for the creation of new applications. This is a mandatory and professional response to the given prompt.
- Companies are expanding their research and development initiatives to discover new uses for carbon dioxide (CO2) in industries where large volumes are required. Emerging application areas could become significant consumers of CO2. Advanced technologies and methods for CO2 production are under investigation. CO2 is generated during the fermentation process of sugar and the production of bioethanol. It plays a crucial role in the alcohol industry and industrial applications. The enhanced oil recovery sector is a major contributor to The market's growth.
- This sector extensively uses CO2 in its processes, driving market expansion. Research and development efforts in this sector are expected to continue, further boosting the market's growth during the forecast period. CO2 is a versatile gas with a wide range of applications, making it an essential component in various industries.
What challenges does the Carbon Dioxide Industry face during its growth?
- The high manufacturing cost of industrial CO2 poses a significant challenge to the industry's growth trajectory. Industrial CO2, an essential input for various manufacturing processes, incurs substantial costs, which can hinder the industry's expansion and competitiveness.
- The market for air separation plants, essential for producing CO2, faces significant challenges due to the energy-intensive process and associated costs. Volatility in raw material prices, rising product costs, and varying packaging methods impact profitability, posing risks to medium and small companies. The CO2 separation process results in the production of nitrogen, hydrogen, and oxygen, with distribution, production, packaging, and storage costs contributing to the final gas price.
- In response, companies are transitioning to tonnage distribution to optimize capacity usage and reduce variable costs. This shift reflects the evolving market dynamics, with a focus on efficiency and cost savings. The air separation plant market continues to unfold, requiring companies to navigate complexities and adapt to changing industry trends.
Exclusive Customer Landscape
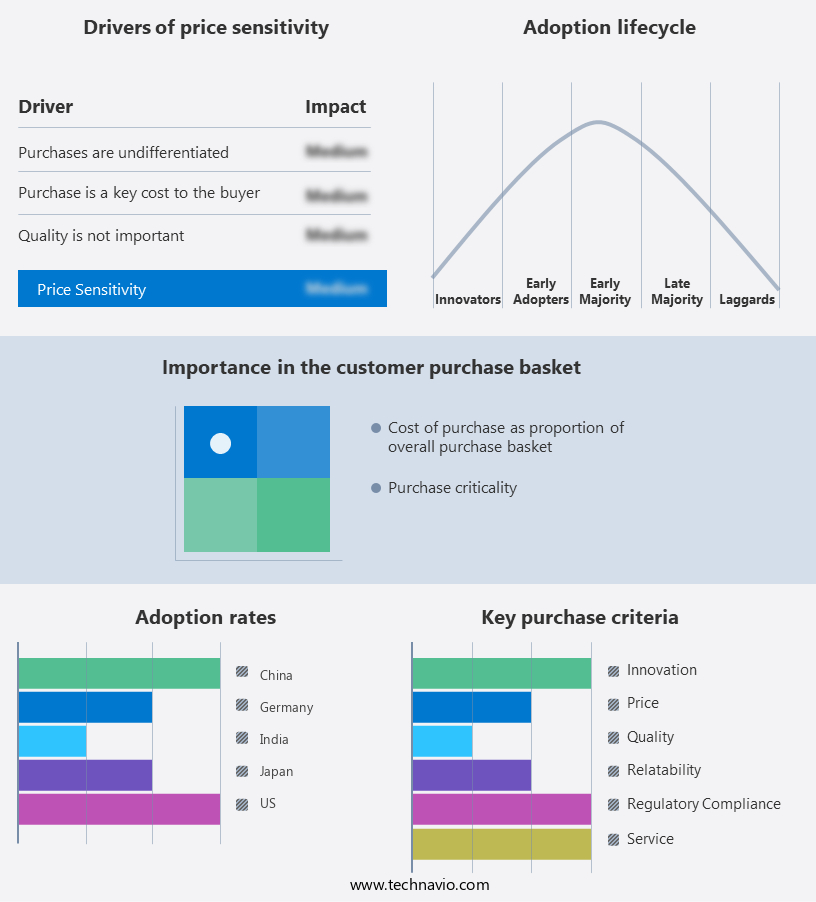
The carbon dioxide market forecasting report includes the adoption lifecycle of the market, covering from the innovator's stage to the laggard's stage. It focuses on adoption rates in different regions based on penetration. Furthermore, the carbon dioxide market report also includes key purchase criteria and drivers of price sensitivity to help companies evaluate and develop their market growth analysis strategies.
Customer Landscape of Carbon Dioxide Industry
Competitive Landscape & Market Insights
Companies are implementing various strategies, such as strategic alliances, carbon dioxide market forecast, partnerships, mergers and acquisitions, geographical expansion, and product/service launches, to enhance their presence in the industry.
Air Liquide SA - This company specializes in the production and supply of various forms of carbon dioxide, including liquid, gaseous, and mixed with other gases, for diverse industrial applications. Their offerings cater to a broad range of industries, ensuring sustainable solutions for businesses seeking to minimize their carbon footprint.
The industry research and growth report includes detailed analyses of the competitive landscape of the market and information about key companies, including:
- Air Liquide SA
- Air Products and Chemicals Inc.
- Axcel Gases
- BASF SE
- Buzwair Group
- Chengdu Taiyu Industrial Gases Co., Ltd.
- Ellenbarrie Industrial Gases Ltd.
- Gulfcryo
- Jinhong Gas Co. Ltd.
- Linde plc
- Messer SE and Co. KGaA
- Mitsubishi Chemical Group Corp.
- Pavan Industrial Gases Pvt. Ltd.
- Praxair, Inc
- Reliant Gases
- Salasar Carbonics Pvt. Ltd.
- SOL Spa
- Steelman Gases Pvt. Ltd.
- Universal Industrial Gases Inc.
- Westfalen AG
Qualitative and quantitative analysis of companies has been conducted to help clients understand the wider business environment as well as the strengths and weaknesses of key industry players. Data is qualitatively analyzed to categorize companies as pure play, category-focused, industry-focused, and diversified; it is quantitatively analyzed to categorize companies as dominant, leading, strong, tentative, and weak.
Recent Development and News in Carbon Dioxide Market
- In January 2024, Linde plc, a leading global industrial gases company, announced the commissioning of its new CO2 production plant in the United States. This USD300 million project, located in Louisiana, increased Linde's total CO2 production capacity by 1.5 million metric tons per annum (mtpa), as stated in their official press release.
- In March 2024, Air Liquide, another major player in the industrial gases sector, entered into a strategic partnership with Carbon Clean Solutions (CCS), a technology leader in CO2 capture, utilization, and reduction. This collaboration aimed to commercialize CCS's Carbon Clean Cure technology, which converts CO2 into food-grade carbonic acid, as per Air Liquide's press release.
- In May 2024, Occidental Petroleum Corporation completed the acquisition of Carbon Clean Solutions for approximately USD200 million, as reported by Reuters. This acquisition gave Occidental access to CCS's proprietary CO2 capture technology, expanding their carbon capture, utilization, and storage (CCUS) capabilities.
- In April 2025, the European Union (EU) approved the European Green Deal's Net Zero Industry Act, which mandates a 65% reduction in CO2 emissions from the EU's industrial sector by 2030, as stated in the EU Commission's press release. This regulatory initiative is expected to significantly boost the demand for CO2 capture and utilization technologies in Europe.
Dive into Technavio's robust research methodology, blending expert interviews, extensive data synthesis, and validated models for unparalleled Carbon Dioxide Market insights. See full methodology.
|
Market Scope |
|
|
Report Coverage |
Details |
|
Page number |
226 |
|
Base year |
2024 |
|
Historic period |
2019-2023 |
|
Forecast period |
2025-2029 |
|
Growth momentum & CAGR |
Accelerate at a CAGR of 4.7% |
|
Market growth 2025-2029 |
USD 2359.8 million |
|
Market structure |
Fragmented |
|
YoY growth 2024-2025(%) |
4.5 |
|
Key countries |
US, China, India, Japan, Germany, UK, South Korea, Canada, France, and Australia |
|
Competitive landscape |
Leading Companies, Market Positioning of Companies, Competitive Strategies, and Industry Risks |
Research Analyst Overview
- In the ever-evolving carbon market, various strategies and technologies emerge to address the global challenge of carbon footprint calculation and climate change mitigation. Geologic carbon storage and CO2 conversion processes, such as biomass gasification and algae biofuel production, have gained significant attention for their potential in renewable fuel production. The importance of carbon capture technology and industrial process optimization in reducing emissions is increasingly recognized. Atmospheric CO2 monitoring and greenhouse gas accounting are essential tools in measuring progress towards emissions reduction targets. Renewable energy integration, methane emission reduction, and waste gas treatment are other key areas of focus.
- Emissions trading schemes and carbon pricing mechanisms are instrumental in driving market dynamics. The adoption of building energy codes, carbon tax policies, and co2 pipeline infrastructure further enhances the carbon market's evolution. Industrial co2 utilization, including in steel production and cement industry emissions, is a growing trend. Carbon sequestration methods, such as afforestation and reforestation, soil carbon sequestration, and carbon mineralization, offer promising solutions for long-term emissions reduction. Sustainable transportation and enhanced oil recovery are additional areas of market activity. Comparatively, atmospheric CO2 monitoring shows a 10% increase in CO2 levels since 2000, emphasizing the urgent need for continuous efforts in carbon footprint reduction.
- The carbon market's ongoing development reflects the collective commitment to addressing climate change and promoting a more sustainable future.
What are the Key Data Covered in this Carbon Dioxide Market Research and Growth Report?
-
What is the expected growth of the Carbon Dioxide Market between 2025 and 2029?
-
USD 2.36 billion, at a CAGR of 4.7%
-
-
What segmentation does the market report cover?
-
The report is segmented by Technology (Combustion and Biological), Application (Enhanced oil recovery, Food and beverages, Precipitated calcium carbonate, and Others), Source (Ethyl alcohol, Hydrogen, Substitute natural gas, Ethylene oxide, and Others), and Geography (APAC, North America, Europe, Middle East and Africa, and South America)
-
-
Which regions are analyzed in the report?
-
APAC, North America, Europe, Middle East and Africa, and South America
-
-
What are the key growth drivers and market challenges?
-
Rising demand for CO2 in oil and gas industry, High manufacturing cost of industrial CO2
-
-
Who are the major players in the Carbon Dioxide Market?
-
Air Liquide SA, Air Products and Chemicals Inc., Axcel Gases, BASF SE, Buzwair Group, Chengdu Taiyu Industrial Gases Co., Ltd., Ellenbarrie Industrial Gases Ltd., Gulfcryo, Jinhong Gas Co. Ltd., Linde plc, Messer SE and Co. KGaA, Mitsubishi Chemical Group Corp., Pavan Industrial Gases Pvt. Ltd., Praxair, Inc, Reliant Gases, Salasar Carbonics Pvt. Ltd., SOL Spa, Steelman Gases Pvt. Ltd., Universal Industrial Gases Inc., and Westfalen AG
-
Market Research Insights
- The market is a dynamic and complex ecosystem, driven by various factors including industrial emissions, regulatory policies, and technological advancements. According to industry estimates, global CO2 emissions from fossil fuel combustion reached approximately 37.1 gigatons in 2020, a 1.5% increase from the previous year. In contrast, the market for CO2 utilization, which includes applications such as enhanced oil recovery, carbon capture, utilization, and storage (CCUS), and the production of food and beverages, reached an estimated value of USD12.5 billion in 2021. The structural shift towards decarbonization and the integration of circular economy principles into business strategies are expected to fuel the growth of the CO2 utilization market.
- For instance, waste heat recovery and energy efficiency technologies are becoming increasingly popular for reducing CO2 emissions and improving overall energy efficiency. Additionally, the development of carbon sink enhancement techniques, such as afforestation and reforestation, and the optimization of carbon sequestration potential in geological formations, are key areas of focus for reducing greenhouse gas emissions and mitigating climate change.
We can help! Our analysts can customize this carbon dioxide market research report to meet your requirements.
 RIA -
RIA - 
